")
Back to Journals » International Journal of General Medicine » Volume 15
Association of Sex Hormones and Fat Distribution in Men with Different Obese and Metabolic Statuses
Authors Zhou YH, Guo Y, Wang F, Zhou CL, Tang CY , Tang HN, Yan DW, Zhou HD
Received 2 December 2021
Accepted for publication 19 January 2022
Published 9 February 2022 Volume 2022:15 Pages 1225—1238
DOI https://doi.org/10.2147/IJGM.S351282
Checked for plagiarism Yes
Review by Single anonymous peer review
Peer reviewer comments 3
Editor who approved publication: Dr Scott Fraser
Ying-Hui Zhou,1,* Yue Guo,1,2,* Fang Wang,3,* Ci-La Zhou,1 Chen-Yi Tang,1 Hao-Neng Tang,4 De-Wen Yan,5 Hou-De Zhou1
1National Clinical Research Center for Metabolic Diseases, Hunan Provincial Key Laboratory for Metabolic Bone Diseases, Department of Metabolism and Endocrinology, The Second Xiangya Hospital of Central South University, Changsha, 410011, Hunan, People’s Republic of China; 2Department of Stomatology, The Second Xiangya Hospital, Central South University, Changsha, 410011, Hunan, People’s Republic of China; 3Department of Endocrinology and Metabolism, Heping Hospital Affiliated to Changzhi Medical College, Changzhi, Shanxi, 046000, People’s Republic of China; 4Department of Laboratory Medicine, The Second XiangYa Hospital of Central South University, Changsha, Hunan, People’s Republic of China; 5Department of Endocrinology, Shenzhen Second People’s Hospital, The First Affiliated Hospital of Shenzhen University, Shenzhen, People’s Republic of China
*These authors contributed equally to this work
Correspondence: Hou-De Zhou
National Clinical Research Center for Metabolic Diseases, Hunan Provincial Key Laboratory for Metabolic Bone Diseases, and Department of Metabolism and Endocrinology, The Second Xiangya Hospital of Central South University, Changsha, 410011, Hunan, People’s Republic of China
, Tel +86-731-85292223
, Fax +86-731-85533525
, Email [email protected]
Purpose: Although several studies have explored the association of sex hormones with glucose metabolism, the association between sex hormones and body fat distribution, which is closely related to insulin resistance, has not been fully elucidated. We have tried to explore the relationship of testosterone (T) and estradiol (E2) with visceral adipose tissue (VAT) and subcutaneous adipose tissue (SAT) mass in Chinese men with different obese and metabolic statuses.
Patients and Methods: A total of 128 men from the Health Management Center of the Second Xiangya Hospital, Central South University were collected and grouped in accordance with their obese and metabolic syndrome (MS) statuses: metabolically healthy non-overweight/obese men (MHNO), metabolically healthy overweight/obese men (MHO) and metabolically unhealthy overweight/obese men (MUO). Multiple regression analyses were performed to estimate contributions of sex hormones levels to the variations of body fat distribution and the contributions of body fat distribution to the variations of sex hormone levels.
Results: With fat mass parameters as independent variables, SAT had a strong negative association with T in MHNO (β = − 2.772, P = 0.034), VAT was positively correlated with E2 in MHO (β = 22.269, P = 0.009), and SAT was negatively associated with T in MUO (β = − 3.315, P = 0.010). With sex hormones as independent variables, E2 positively correlated with VAT (β = − 176.259, P = 0.048), while T negatively correlated with VAT in MHO (β = 183.150, P = 0.029). In MUO, an inverse association of T with SAT was observed (β = − 213.689, P = 0.021).
Conclusion: E2 and VAT had a mutual influence, thus resulting in a vicious circle, and the negative correlation between T and VAT may be related to the decrease of the MS occurrence in the MHO group. There were bi-directional relationships between sex hormones and fat distribution in men with different obese and metabolic statuses.
Trial Registration: Chinese Clinical Trial Registry, ChiCTR-EOC-16010194. Retrospectively registered.
Keywords: sex hormone, body fat distribution, metabolic syndrome, obesity, Chinese
Introduction
Several studies have reported the association of sex hormones (testosterone, T; and estradiol, E2) with obesity and metabolic syndrome (MS). Increased level of E21–3 in obese men is strongly associated with unfavorable body fat distribution and MS.4,5 Meanwhile, epidemiology studies show an inverse relationship of T with obesity and MS. Obese men6,7 and those with MS8 tend to have decreased testosterone level, which contributes to adiposity,9 visceral fat accumulation10,11 and an increased risk of MS,12,13 while a high serum T level could aid in the prevention of MS development.14,15 Furthermore, recent studies suggest the role of body fat distribution in the relationship between sex hormone levels and metabolic disorders. The association between T levels and MS components was disrupted following visceral adipose tissue (VAT) control.16,17
There is a paucity of literature on the relationship between body fat distribution and sex hormones in Chinese men. Results from other countries are inconsistent and incomparable due to different population groups.18–24 A negative correlation of T to SAT but not to VAT has been reported, and no association of E2 with VAT or SAT in healthy men has been observed.22 In men with a low risk of secondary androgen deficiency, both VAT and SAT were negatively related to T, whereas E2 was not correlated with VAT or SAT irrespective of the presence of obesity.20 However, in obese adult men with at least one MS criterion, a positive correlation of VAT to E2 was noted but none with T.23 These studies suggest that the relationship between sex hormones and body fat distribution was dependent on the extent of obese and metabolic status. Moreover, it is not scientific to study the relationship between sex hormones and fat and metabolic status according to the current BMI-based obesity diagnostic criteria. Hence, the classification of subjects based on their extent of obese and metabolic status and standardization of the independent variables seems imperative.21
Changes in body fat mass could contribute to the variations in sex hormone levels, yet the interactions between the two indices were not clear.19–23,25 Recent studies could not conclude whether sex hormones influence fat mass or vice versa, which means that the relationship between sex hormone levels and adiposity indices appeared to be bi-directional. The reduced T levels in obese men might be a consequence of obesity. Also, the association between weight loss and testosterone level is inverse.6,7,26 Several studies suggested that the variation in fat mass could be a consequence of the change in sex hormone levels. Indeed, low T level leads to the accumulation of VAT,10,14 whereas T therapy reduces total body fat mass and VAT.10,14,27 Hence, a deeper understanding of bi-directional relationships between sex hormones and body fat distribution is important.
Computed tomography (CT) and magnetic resonance (MRI) were recommended as standard methods for the evaluation of abdominal obesity by the International Diabetes Federation (IDF).28,29 Application of these methods in daily clinical practice has been limited due to high costs, low availability, radiation exposure and specific software requirements. Recently, dual-energy X-ray absorptiometry (DEXA) was approved as an effective method to measure fat mass. VAT measured by DEXA was not inferior to VAT by CT.30 Compared with other techniques, DEXA has the following advantages: rapid and precise regional or total-body analysis, low radiation exposure and low cost.28,31 Therefore, this study aimed to explore the bi-directional relationships between sex hormone levels and DEXA-assessed body fat distributions in Chinese men with different obese and metabolic statuses.
Materials and Methods
Subjects
This cross-sectional study comprised 128 men aged 19–63 years who were recruited from the Health Management Center of the Second Xiangya Hospital, Central South University, in the period from 2014 to 2015 (67 men with missing data were excluded). Exclusion criteria were as follows: BMI > 40 kg/m2,23 severe liver and kidney disease, thyroid dysfunction, bulimia, cancer, or obesity due to other known diseases such as hypothalamic disease or Cushing syndrome. Subjects who received medication known to intervene with sex hormones and body weight (eg, adrenocortical hormones, anti-inflammatory therapy including aspirin, yeast, isoniazide, reserpine or chlorpromazine) were also excluded.
All subjects were subdivided into three obese and metabolic status groups: metabolically healthy non-obese men (MHNO), metabolically healthy overweight/obese men (MHO), metabolically unhealthy overweight/obese men (MUO). Body mass index (BMI) ≥24 kg/m2 was used to define overweight/obesity.32 MS was defined as per the 2007 Joint Committee for Developing Chinese Guidelines (JCDCG2007). Each subject met three or more of the following criteria: waist circumference (WC) ≥90 cm; triglyceride (TG) ≥1.7 mmol/L or specific treatment for dyslipidemia; high-density lipoprotein cholesterol (HDL-C) <1.04 mmol/L or specific treatment for dyslipidemia; blood pressure (BP) ≥130/85 mmHg or treatment for previously diagnosed hypertension; fasting plasma glucose (FPG) ≥6.1 mmol/L and/or 2-hour postprandial plasma glucose (2hPG) ≥7.8 mmol/L or previously diagnosed type 2 diabetes (T2DM).33 This study was conducted in accordance with the Declaration of Helsinki. The study was approved by the ethics committee of National Clinical Research Center for Metabolic Disease, the Second Xiangya Hospital of Central South University (No. 2015-06) and all participants gave their written informed consent for getting involved in the study. Clinical trial registration number: ChiCTR-EOC-16010194. All data and related metadata underlying the findings reported in the submitted manuscript have been deposited in the public repository (ResMan, http://www.medresman.org/pub/cn/proj/projectshow.aspx?proj=2139).
Physical Examination and Laboratory Analyses
All participants received physical examinations including weight, height, WC, hip circumference (HC) and BP. WC was measured midway between the costal margin and the iliac crest on the mid-axillary line and HC was measured at the widest part of the gluteal region. BP was measured by one operator with a sphygmomanometer and the mean value of three times was recorded.
For the measurement of FPG, TG, and HDL-C, venous blood samples were collected after overnight fasting of more than 10 hours. FPG level was measured using the hexokinase enzymatic method (Ningbo Medical System Biotechnology Co. Ltd., China). Serum TG and HDL-C levels were measured by an automatic analyzer ARCHITECT C8000 (Abbott, USA). T and E2 were measured by the automated chemiluminescent ADVIA-Centaur (Siemens Healthcare Diagnostics, USA). Normal ranges for T and E2 were 8.40–28.70 nmol/L and 0.044–0.529 nmol/L, respectively. The lowest detectable level for E2 was 0.04 nmol/L. Between-run CV concentrations at three different levels were 13.33% (3.96 nmol/L), 12.85% (15.9 nmol/L) and 11.38% (28.2 nmol/L) for T and 4.57% (313 pmol/L), 5.24% (775 pmol/L) and 3.99% (2.14 nmol/L) for E2.
Body Fat Distribution Analyzed by Dual-Energy X-Ray Absorptiometry
Body fat distribution including visceral adipose tissue, android fat mass, and gynoid fat mass were determined by DEXA and the scans were analyzed using the soft enCORE version 16 (GE healthy, USA).34 A calibration block consisting of a tissue-equivalent material with three bone-simulating chambers was used for daily calibration and was supplied by the manufacturer.31 Scanning of the subjects was performed with standard protocols.
The area between the ribs and the pelvis which was totally enclosed by the trunk region was defined as the region of interest (ROI) for android. The upper boundary was 20% of the distance between the iliac crest and the neck. The lower boundary was at the top of the pelvis. The ROI of gynoid included the hips and upper thighs, and overlapping both the leg and trunk regions. The upper boundary was below the top of the iliac crest at 1.5 times the android height. The total height of the gynoid ROI was two times the height of the android ROI. The ROI for android contains both VAT and SAT. The software estimated the quantity of VAT in the ROI of android. SAT was computed by subtracting VAT from the total android fat.
Statistical Analysis
Logarithmic and square root transformation were performed to obtain normal distributions of the serum parameters and the DEXA parameters. One-way ANOVA was performed to compare the differences between groups.35 For each reference interval, the method proposed by Lahti et al36 was used to interpret whether a partitioning of the reference population into MHNO, MHO and MUO were advisable. Linear regression analysis was used to test for univariate, linear trends between body fat distributions and hormonal concentrations. Multiple regression analyses were performed to estimate contributions of sex hormone levels to the variations of different body fat indices and the contributions of adiposity indices to the variations of sex hormone levels. All multiple regression analysis were adjusted for age, while T was controlled when E2 was analyzed as a dependent variable. All linear regression analysis and multiple regression analysis were performed using continuous standard deviation scores (SDS) as independent variables.21 The SDS categorization (<-1.00; −1.00, −0.51; −0.50, −0.01; 0.00, 0.49; 0.50, 0.99; and ≥1.00) for VAT, SAT, android fat mass, gynoid fat mass, T and E2 are shown in Supplementary Table 1.21 The level of significance was set at P<0.05. Data were analyzed using SPSS 17.0 software.
Results
Comparisons of Participants’ Characteristics Among the Three Groups
The patient characteristics for each group are shown in Table 1. Weight, BMI, WC, HC and WHR (P< 0.001) were higher in the MHO group compared with the MHNO group. Compared with the MHNO group, the MHO group had lower serum T levels (18.25 ± 5.54 nmol/L vs 13.49 ± 5.86 nmol/L), while serum E2 levels did not differ significantly (P = 0.679). SAT, VAT, android fat mass and gynoid fat mass were significantly higher in MHO than in MHNO (P< 0.001).
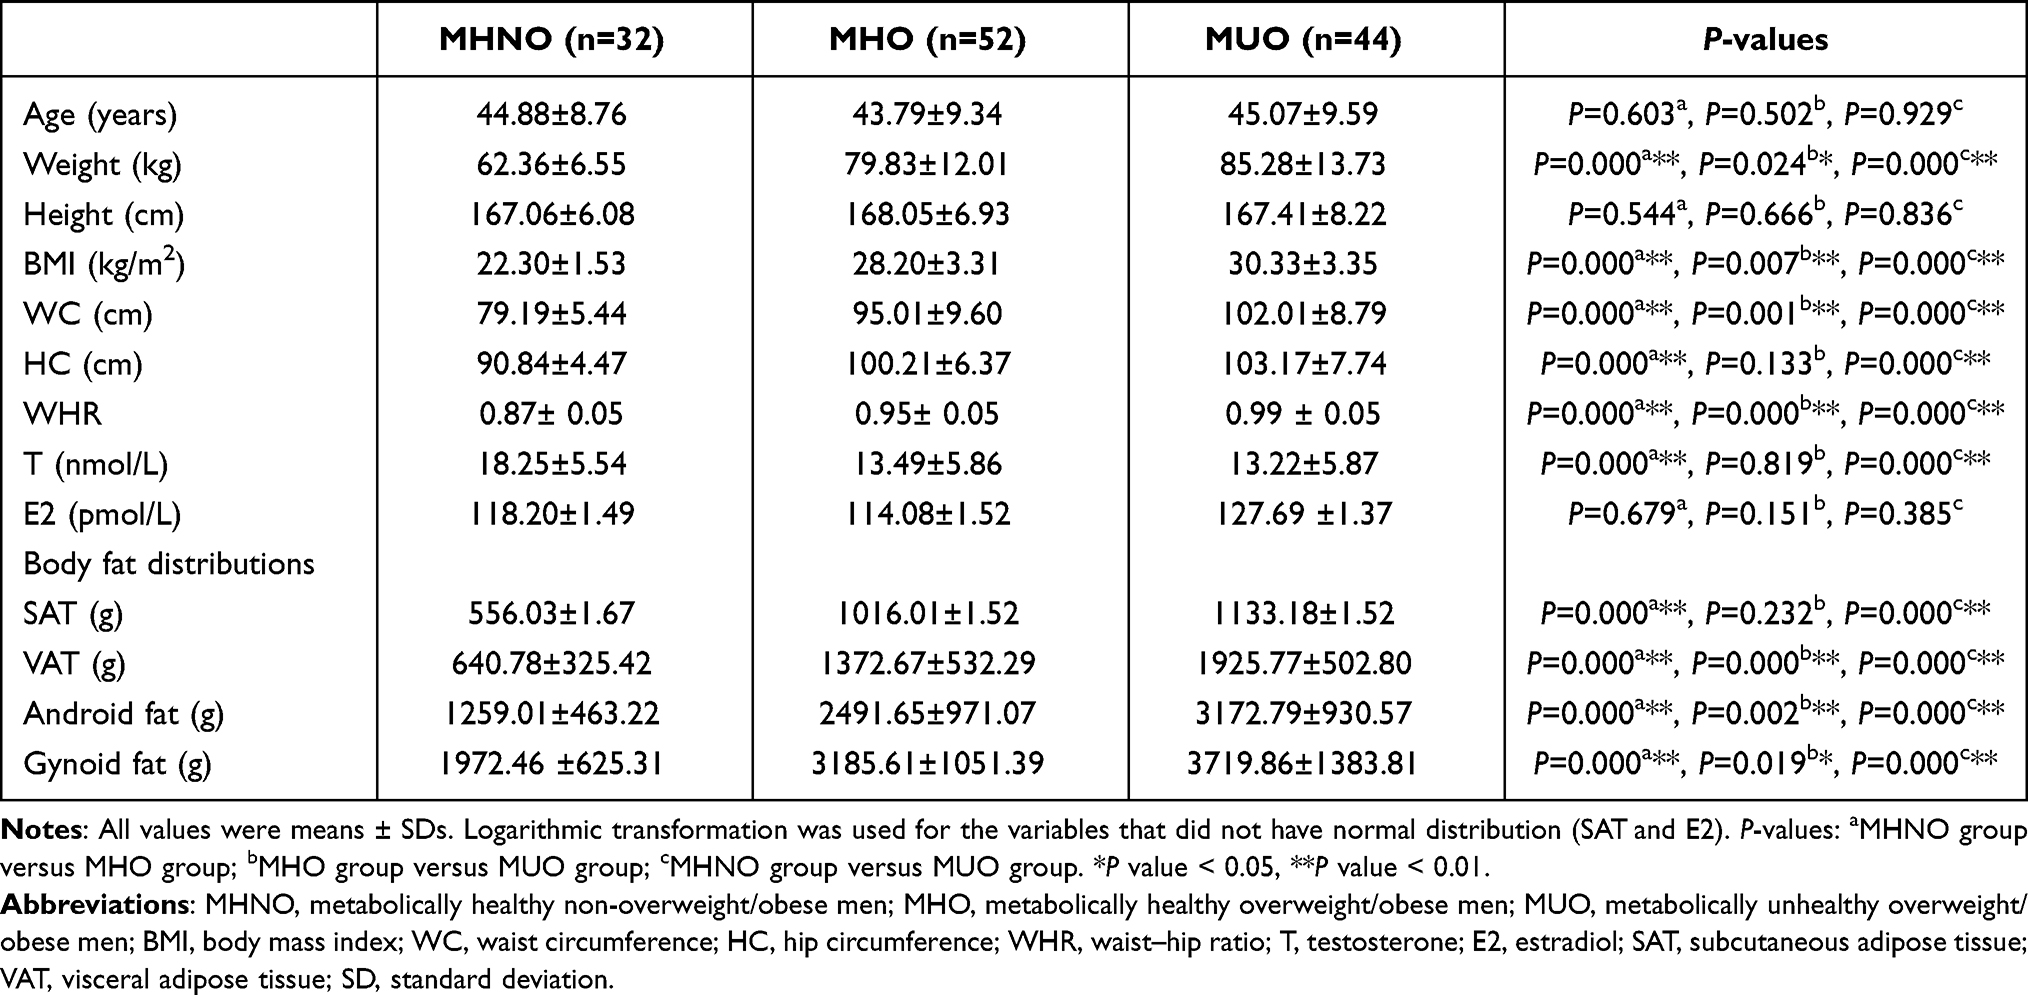 |
Table 1 Comparisons of Participants’ Characteristics Among Three Groups (Mean ± SD) |
Compared with the MHO group, the MUO group had higher weight, BMI, WC and WHR (P< 0.05). Serum T (P = 0.819) and E2 (P = 0.151) levels were not significantly different between the two groups. VAT, android fat mass, and gynoid fat mass were higher in MUO than in MHO (P< 0.05), while SAT was higher in MUO than in MHO (1133.18 ±1.52 g vs 1016.01 ±1.52 g) with no statistical significance.
Reference Intervals for T and E2 Should Be Established in MHNO, MHO, and MUO
The reference limits for serum T and E2 levels in the three test groups are shown in Table 2. The T reference values were significantly displaced to the left in MHO and MUO compared with the MHNO group. Compared with the MHO group, the distribution of T was significantly displaced to the right in the MUO group. Partitioning was suggested for T between MHNO and MHO, MHNO and MUO, and MHO and MUO (partitioning was suggested when one of the conclusions for the upper and lower limit is definite),37 which means reference intervals for T should be established in the three groups.
 |
Table 2 Application of Partitioning Criteria to T and E2 in Three Groups |
Contributions of Body Fat Distributions to the Variations in Sex Hormones
To quantify the association of body fat distributions to the variation in sex hormone levels, univariate analyses (Figure 1 and Supplementary Figure 1) and multiple regression analyses (Table 3 and Supplementary Table 2) were performed using body fat distribution parameters as independent variables.
 |
Table 3 SAT/VAT as Independent Variables to the Variations in Sex Hormones in Multiple Linear Regression Analyses |
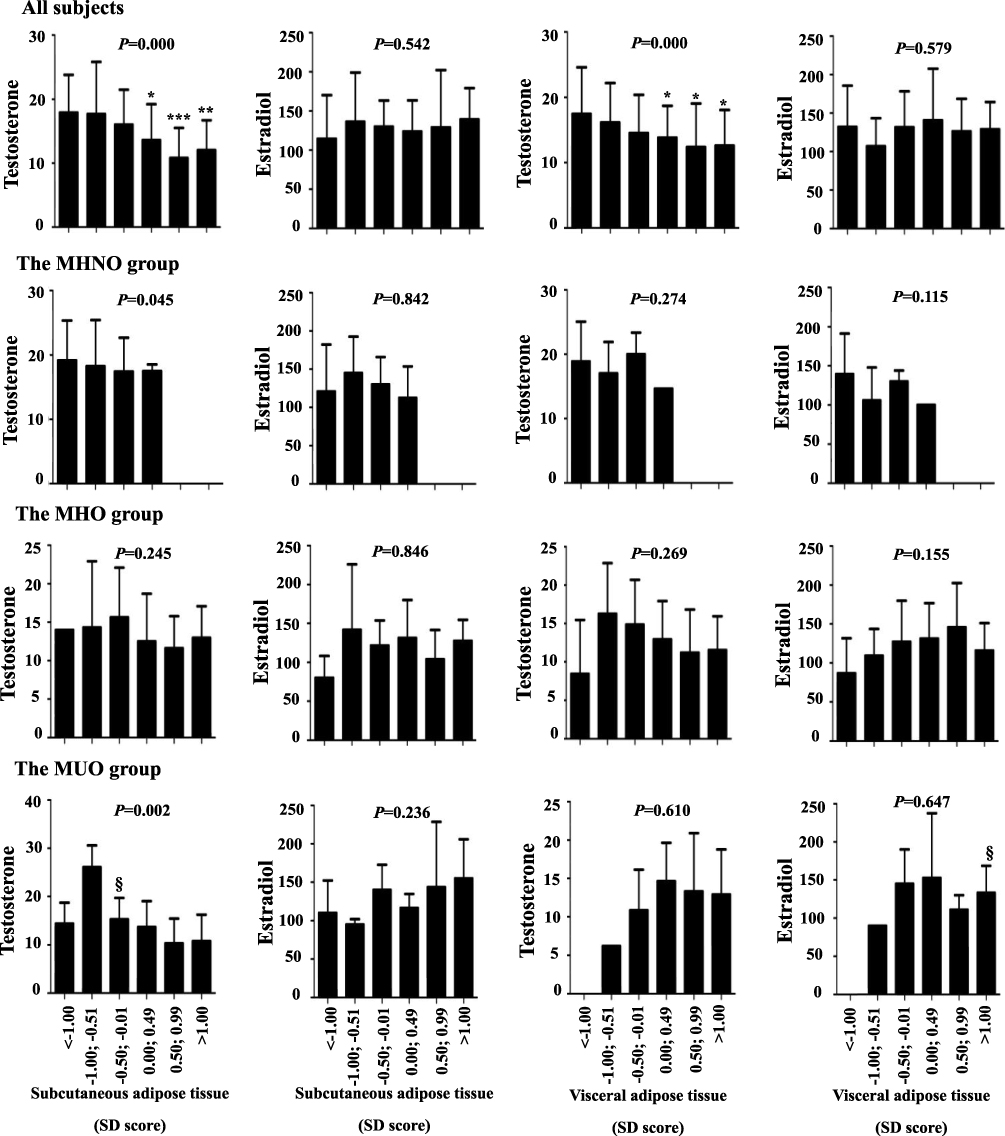 |
Figure 1 T and E2 in relation to SAT and VAT in different groups. All subjects, n=128; MHNO, n=32; MHO, n=52; MUO, n=44. P values in bar charts were results from univariate linear regression analyses. *P< 0.05; **P< 0.01 and ***P< 0.001 vs men with SDS less than −1.0. §P < 0.05 vs the preceding group. Whiskers represent SEM. Abbreviations: MHNO, metabolically healthy non-overweight/obese men; MHO, metabolically healthy overweight/obese men; MUO, metabolically unhealthy overweight/obese men; T, testosterone; E2, estradiol; SAT, subcutaneous adipose tissue; VAT, visceral adipose tissue. |
Within all participates, serum T was inversely correlated with SAT (β = −2.661, P = 0.000), VAT (β = −1.903, P = 0.000), android fat mass (β = −2.308, P = 0.000) and gynoid fat mass (β = −2.174, P = 0.000), while E2 was not in the univariate analyses. However, SAT only correlated with reduced serum T levels in multiple regression analyses (β = −2.350, P = 0.000), and the SAT-T relation remained significant after adjustment for age (β = −2.490, P = 0.001).
In MHNO, T inversely correlated with SAT (β = −2.036, P = 0.045), but not with VAT, android fat mass or gynoid fat mass in univariate analyses. In multiple regression analyses, a negative association of SAT with T after adjustment for age (β = −2.772, P = 0.034) was noted. Serum E2 was independent of the investigated fat mass parameters.
Univariate analyses demonstrated that T and E2 were independent of fat mass parameters in MHO (P> 0.05). But, in multiple regression analysis, a positive correlation of VAT with E2 was found after adjustment for T (β = 19.265, P = 0.023), which still existed after adjustment for age (β = 22.269, P = 0.009).
In the MUO group, univariate analysis showed that T was inversely correlated with SAT (β = −3.389, P = 0.002), android fat mass (β = −2.250, P = 0.036) and gynoid fat mass (β = −1.678, P = 0.042), whereas there was no direct relationship between serum E2 levels and fat mass parameters investigated. In multiple regression analyses, SAT remained negatively associated with T (β = −3.503, P = 0.002), while android fat mass and gynoid fat mass were not. Furthermore, the inverse association between SAT and T persisted after adjustment for age (β = −3.315, P = 0.010). Although E2 positively correlated with SAT after adjustment for T (β = 24.726, P = 0.049), the correlation disappeared after adjustment for age.
Contribution of Sex Hormones to the Variation in Body Fat Distribution
To investigate the contribution of sex hormones to the variation in body fat distribution indices, univariate analyses (Figure 2 and Supplementary Figure 2) and multiple regression analyses (Table 4 and Supplementary Table 3) were performed with sex hormones as the independent variables.
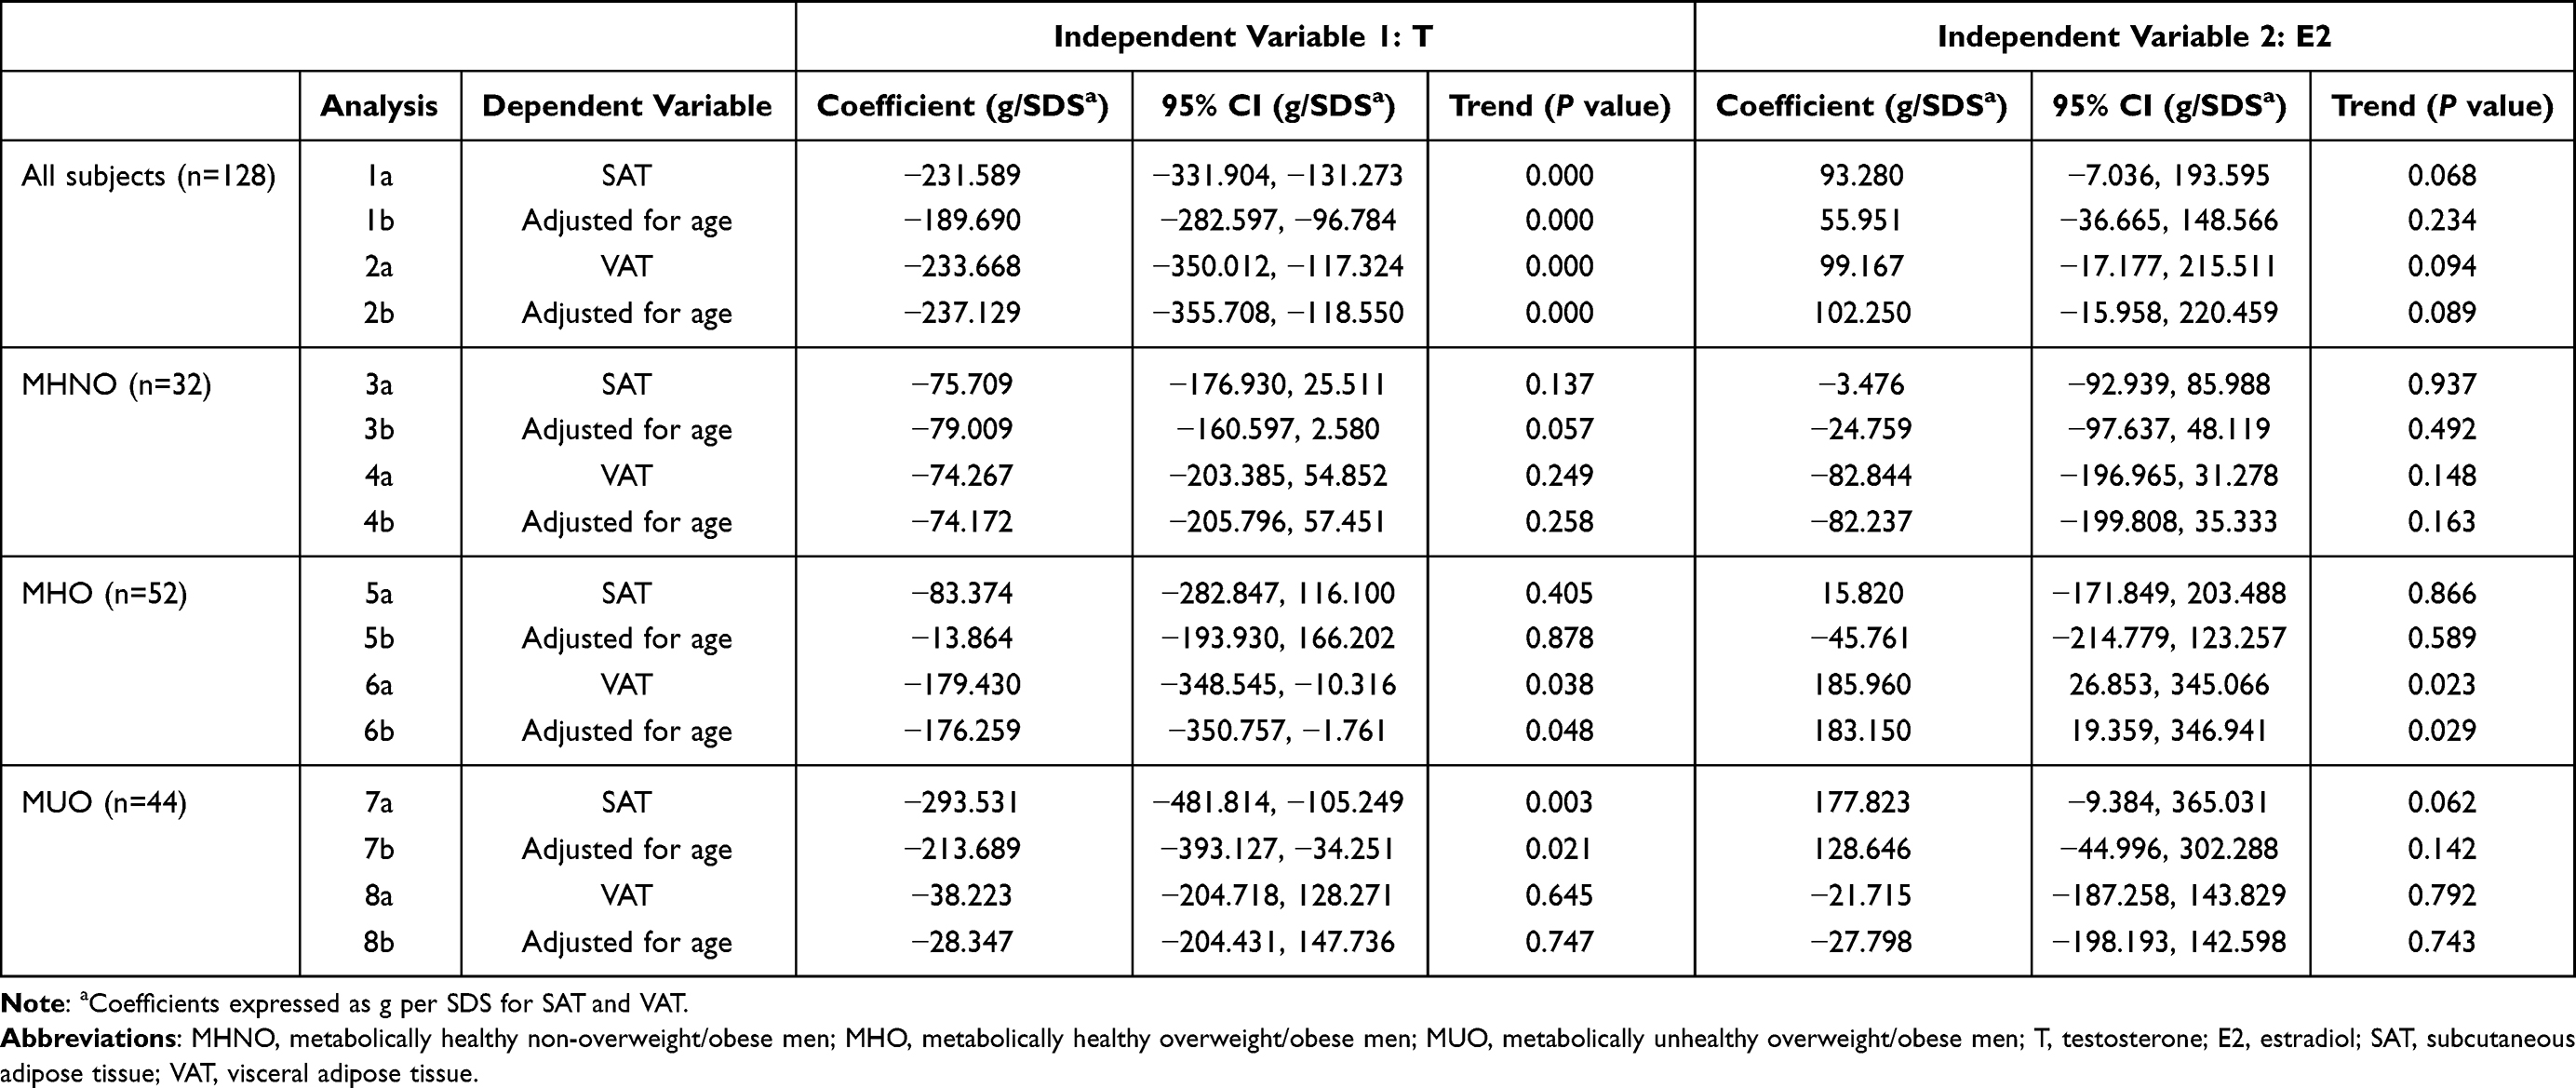 |
Table 4 T/E2 as Independent Variables to the Variations in Fat Distributions in Multiple Linear Regression Analyses |
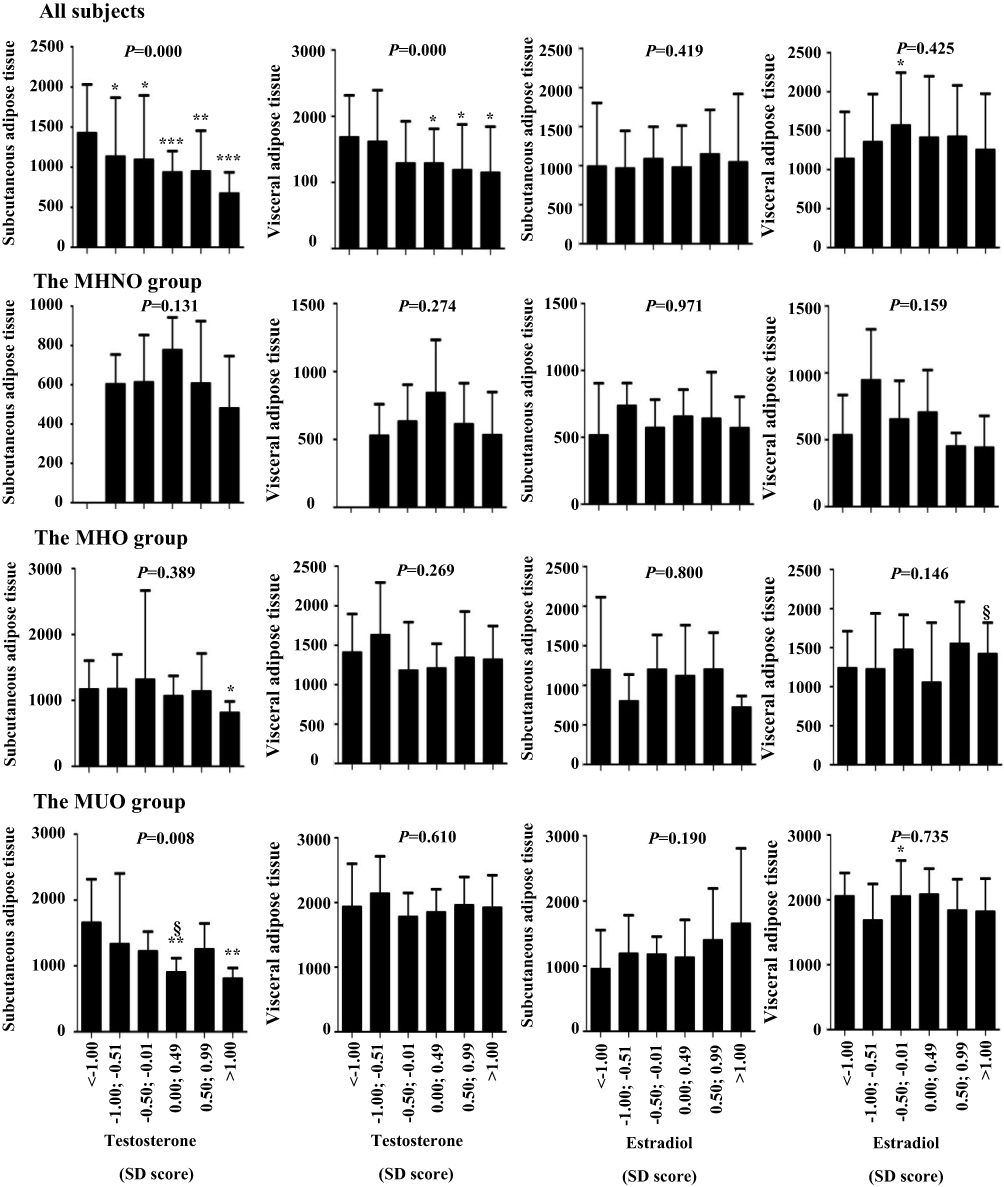 |
Figure 2 SAT and VAT in relation to T and E2 in different groups. All subjects, n=128; MHNO, n=32; MHO, n=52; MUO, n=44. P values in bar charts were results from univariate linear regression analyses. *P< 0.05; **P< 0.01 and ***P< 0.001 vs men with SDS less than −1.0. §P< 0.05 vs the preceding group. Whiskers represent SEM. Abbreviations: MHNO, metabolically healthy non-overweight/obese men; MHO, metabolically healthy overweight/obese men; MUO, metabolically unhealthy overweight/obese men; T, testosterone; E2, estradiol; SAT, subcutaneous adipose tissue; VAT, visceral adipose tissue. |
Within all subjects, T was inversely correlated with SAT (β = −211.398, P = 0.000), VAT (β = −212.203, P = 0.000), android fat mass (β = −423.600, P = 0.000) and gynoid fat mass (β = −455.803, P = 0.000) in univariate analyses. No significant correlation of E2 with any of the measured fat distribution indices was observed. In multiple regression analyses, serum T negatively correlated with SAT (β = −231.589, P = 0.000), VAT (β = −233.668, P = 0.000), android fat mass (β = −465.256, P = 0.000) and gynoid fat mass (β = −515.144, P = 0.000), while E2 positively correlated with android fat mass (β = 192.446, P = 0.042) and gynoid fat mass (β = 274.147, P = 0.012). These associations were not altered after adjustment for age, except for the relationship between E2 and android fat mass.
In the MHNO group, univariate analyses indicated that there was no relationship between the investigated sex hormones and fat mass parameters (P> 0.05). While in multiple regressions analyses, a higher T was correlated with a lower gynoid fat mass after adjustment for age (β = −224.228, P = 0.048).
In MHO, no significant relationship was observed between investigated sex hormones and body fat distributions in univariate analyses (P> 0.005). In multiple regression analyses, T negatively correlated with VAT (β = −179.430, P = 0.038). A positive correlation was found between E2 and VAT (β = 185.960, P = 0.023). All these associations remained significant after adjustment for age.
In MUO, T was negatively correlated with SAT (β = −226.990, P = 0.008), android fat mass (β = −308.454, P = 0.035) and gynoid fat mass (β = −445.139, P = 0.042) in univariate analyses. In multiple linear regression analyses, T was inversely correlated with SAT both before and after adjustment for age (β = −293.531, P = 0.003; β = −213.689, P = 0.021, respectively). However, the relationships between T and android fat mass (β = −331.754, P = 0.026), T and gynoid fat mass (β = −509.339, P = 0.018), E2 and gynoid fat mass (β = 430.124, P = 0.042) disappeared after adjustment for age.
Discussion
The aim of our study is to explore the bi-directional relationships between sex hormones and body fat distribution in Chinese men with different obese and metabolic statuses. Results of studies so far concerning the relationships between abdominal adipose tissues and sex hormones are inconsistent. Phillips et al found that in healthy men, T negatively correlated with SAT but not with VAT, and E2 was neither related with SAT nor with VAT.20 In adult obese men with at least one MS criterion, the negative correlation observed between T and SAT, was not evident, while a positive correlation between VAT and E2 was noted irrespective of the age group.23 However, when obesity was not taken into account, both VAT and SAT negatively correlated with T but not with E2.22 These studies led us to believe that T and E2 have different relations with VAT and SAT in men with different obese and metabolic statuses. We have tried to explore further the relationship between sex hormones and body fat distribution, and we divided all subjects into three groups on the basis of their varying obese and metabolic statuses.
Levels of sex hormones and body fat distribution in men with different obese and metabolic statuses were taken into account. In our study, we observed that, in men with deteriorating obese and metabolic status, there was a progressive increase in SAT and VAT with a higher proportion of VAT (+114 to 201%) than SAT (+83 to 104%) although the differences in SAT was not statistically significant between MHO group and MUO group (Table 1). In addition, we found that serum T levels were lower in MHO than in MHNO, but there was no significant difference between MHO and MUO. Goncharov et al discovered that from non-obese men without MS to obese men with MS, MRI-measured SAT and VAT increased gradually, whereas T decreased gradually,22 which was different with our study. This discrepancy could possibly be due to the difference in races and ages of the studied population.
Liao et al and Tchernof et al noted that there was no difference in E2 levels in Asian men with or without MS25 and Canadian men with or without obesity,18 respectively, which was consistent with our findings that E2 levels among the MHNO, MHO, and MUO group were not significantly different. Thus, our results reinforce the well-documented theory that obesity and MS are related to the alterations in the body fat distributions and serum T levels.
We then analyzed the reference intervals for serum T and E2 level in men with varying severity of obese and metabolic condition for the first time (Table 2). Our study showed that not only the T reference interval between MHNO and MHO was significantly different,21 but also the T reference interval of MUO was different from MHNO and MHO. Interestingly, the T reference interval was displaced to the right in MUO compared with MHO, which could possibly be due to the varying association of sex hormones and body fat distribution in men with obesity and different metabolic statuses. In addition, compared with MHNO and MHO, although the E2 levels of MUO were not significantly different (Table 1), the E2 reference interval was displaced to the right. In view of these findings, we suggest that reference intervals for T and E2 should be established in men with different obese and metabolic statuses.
Our study demonstrated that in men with different obese and metabolic statuses, the body fat distributions and sex hormone levels were different (Table 1), so the relationships between the two indices could possibly differ. Thus, we explored the relationship between sex hormones and body fat distribution in men with different obese and metabolic conditions.18,38
It is well known that adipose tissue is an endocrine organ that could affect sex hormones production that influences the pathogenesis of obesity and type 2 diabetes. For instance, increasing body fat mass could suppress the hypothalamic-pituitary (HP) axis via increased aromatization of T to E2, secretion of pro-inflammatory cytokines, insulin resistance and diabetes, and ultimately lowering circulating T.18,26,38
Conversely, sex hormones could also affect fat mass: reduced T could promote accumulation of fat mass by increasing lipoprotein lipase activity, impairing lipolysis, stimulating adipocyte differentiation and lipogenesis.26 Therefore, we studied the bi-directional relationships between sex hormones and body fat distributions in men with different obese and metabolic conditions. Our research demonstrated that in the MHNO group, T could be negatively regulated by SAT, but the changes in T and E2 did not affect SAT and VAT. Consistent with our results, Goncharov et al also discovered that levels of total T inversely correlated with MRI-assessed SAT in non-obese metabolically healthy men under the age of 40 years.22 However, in the MHO group, E2 and VAT had a mutual influence, which was consistent with the study of Gautier et al that VAT was significantly related with E2 in obese men with at least one MS criterion.23 At the same time, our study showed that high T could contribute to a low VAT. These indicated that once an individual gained weight, the relation between E2 and VAT would become imbalanced; E2 and VAT would promote each other resulting in a vicious circle. Although the so-called “metabolically healthy obesity” does have an increased VAT, T could suppress the increase of VAT, thus preventing the occurrence of MS, suggesting that the abnormal body fat mass regulation could be compensated in this status.37 In the MUO group, E2 was not related to VAT and the relationship between sex hormones and body fat distributions became a negative mutual influence of SAT and T level. This suggests that when a metabolic status deteriorates to overweight/obesity with MS, T negatively regulates SAT instead of VAT, but since VAT rather than SAT accumulation is associated with increased metabolic risk,37 T can no longer prevent the occurrence of MS at this stage. However, a study in men under 40 found that T was related with neither SAT nor VAT in obese men with MS.22 This discrepancy could be attributed to different ages and population.19 In addition, our study found that T interacted with SAT in all subjects; the same trend could only be found in the MUO group. Therefore, obese and metabolic status should be considered in studies exploring the interrelationships between sex hormones and fat mass.
This study also has the following drawbacks: First, the sample size is relatively small. The alpha level is set to 0.10 to reduce the risk of type II errors, but this also increases the risk of type I errors. However, the linear regression analysis of each group could provide about 70–80% power to detect the relationships between sex hormones and fat distribution, which means that this study is relatively reliable. Second, further studies that take other variables such as socioeconomic factors and smoking/drinking status into account is needed to validate our findings. The mechanism by which the relationship between sex hormones and body fat distribution differed depending on obese and metabolic status is worthy of further study. Thirdly, this study only analyzes the relationship between fat distribution and T routinely measured by the Chinese Medical Center.
Conclusion
The relationship between sex hormones and body fat distribution differed depending on the severity of obese and metabolic status. In the MHO group, E2 and VAT had a mutual influence thus resulting in a vicious circle; and at the same time, T was negatively correlated with VAT, which may be related to the decrease of the MS occurrence. Moreover, the negative correlation between T and VAT disappeared in the MUO group. Therefore, in clinical practice, the difference in metabolically healthy obesity and metabolically unhealthy obesity should be considered.
Abbreviations
MHNO, non-overweight/obese men; MHO, metabolically healthy overweight/obese men; MUO, metabolically unhealthy overweight/obese men; SAT, subcutaneous adipose tissue; T, testosterone; VAT, visceral adipose tissue; E2, estradiol; MS, metabolic syndrome; CT, computed tomography; MRI, magnetic resonance; DEXA, dual-energy X-ray absorptiometry; BMI, body mass index; WC, waist circumference; HC, hip circumference; ROI, region of interest; WHR, waist–hip ratio.
Data Sharing Statement
The data that support the findings of this study are openly available in [ResMan] at [http://www.medresman.org/pub/cn/proj/projectshow.aspx?proj=2139].
Ethics Approval and Informed Consent
The study was approved by the ethics committee of National Clinical Research Center for Metabolic Disease, the Second Xiangya Hospital of Central South University (No. 2015-06), and all participants gave their written informed consent for getting involved in the study.
Author Contributions
Hou-De Zhou: Conceptualization, Supervision and Funding acquisition. Ying-Hui Zhou, Yue Guo, Fang Wang, Ci-La Zhou, Chen-Yi Tang and Hao-Neng Tang: Methodology execution and acquisition of data. Ying-Hui Zhou, Yue Guo, Fang Wang and De-Wen Yan: Formal analysis and Interpretation. All authors took part in drafting, revising or critically reviewing the article; gave final approval of the version to be published; have agreed on the journal to which the article has been submitted; and agree to be accountable for all aspects of the work.
Funding
This work was supported by the National Natural Scientific Foundation of China [grant numbers: 82170900, 8217033609, 81770880, 81800788, 81970762], the Science & Technology Department of Hunan Province [grant numbers: 2020SK2080, 2015JC3012 and 2018SK52511] and Changsha City [grant numbers: k1906019, kq1901118], and the Open Sharing Fund for the Large-scale Instruments and Equipment of Central South University.
Disclosure
The authors report no conflicts of interest in this work.
References
1. Starka L, Hill M, Pospisilova H, Duskova M. Estradiol, obesity and hypogonadism. Physiol Res. 2020;69:S273–S278. doi:10.33549/physiolres.934510
2. Vihma V, Naukkarinen J, Turpeinen U, et al. Metabolism of sex steroids is influenced by acquired adiposity-a study of young adult male monozygotic twin pairs. J Steroid Biochem Mol Biol. 2017;172:98–105. doi:10.1016/j.jsbmb.2017.06.007
3. Traish AM, Feeley RJ, Guay A. Mechanisms of obesity and related pathologies: androgen deficiency and endothelial dysfunction may be the link between obesity and erectile dysfunction. FEBS J. 2009;276:5755–5767. doi:10.1111/j.1742-4658.2009.07305.x
4. Hammoud A, Gibson M, Hunt SC, et al. Effect of Roux-en-Y gastric bypass surgery on the sex steroids and quality of life in obese men. J Clin Endocrinol Metab. 2009;94:1329–1332. doi:10.1210/jc.2008-1598
5. Maggio M, Lauretani F, Ceda GP, et al. Estradiol and metabolic syndrome in older Italian men: the InCHIANTI Study. J Androl. 2010;31:155–162. doi:10.2164/jandrol.108.006098
6. Mangolim AS, Brito LAR, Nunes-Nogueira VS. Effectiveness of testosterone therapy in obese men with low testosterone levels, for losing weight, controlling obesity complications, and preventing cardiovascular events: protocol of a systematic review of randomized controlled trials. Medicine (Baltimore). 2018;97:e0482. doi:10.1097/MD.0000000000010482
7. Liu F, Tu Y, Zhang P, Bao Y, Han J, Jia W. Decreased visceral fat area correlates with improved total testosterone levels after Roux-en-Y gastric bypass in obese Chinese males with type 2 diabetes: a 12-month follow-up. Surg Obes Relat Dis. 2018;14:462–468. doi:10.1016/j.soard.2017.11.009
8. Traish AM, Johansen V. Impact of testosterone deficiency and testosterone therapy on lower urinary tract symptoms in men with metabolic syndrome. World J Mens Health. 2018;36:199–222. doi:10.5534/wjmh.180032
9. Grossmann M. Hypogonadism and male obesity: focus on unresolved questions. Clin Endocrinol (Oxf). 2018;89:11–21. doi:10.1111/cen.13723
10. Sebo ZL, Rodeheffer MS. Testosterone metabolites differentially regulate obesogenesis and fat distribution. Mol Metab. 2021;44:101141. doi:10.1016/j.molmet.2020.101141
11. Tchernof A, Brochu D, Maltais-Payette I, et al. Androgens and the regulation of adiposity and body fat distribution in humans. Compr Physiol. 2018;8:1253–1290.
12. Dimopoulou C, Goulis DG, Corona G, Maggi M. The complex association between metabolic syndrome and male hypogonadism. Metabolism. 2018;86:61–68. doi:10.1016/j.metabol.2018.03.024
13. Bianchi VE, Locatelli V. Testosterone a key factor in gender related metabolic syndrome. Obes Rev. 2018;19:557–575. doi:10.1111/obr.12633
14. Pivonello R, Menafra D, Riccio E, et al. Metabolic disorders and male hypogonadotropic hypogonadism. Front Endocrinol (Lausanne). 2019;10:345. doi:10.3389/fendo.2019.00345
15. Kim M, Kyung YS, Ahn TY. Cross-sectional association of metabolic syndrome and its components with serum testosterone levels in a Korean-Screened Population. World J Mens Health. 2020;38:85–94. doi:10.5534/wjmh.190030
16. Needham BL, Kim C, Mukherjee B, et al. Endogenous sex steroid hormones and glucose in a South-Asian population without diabetes: the metabolic syndrome and atherosclerosis in South-Asians living in America pilot study. Diabet Med. 2015;32:1193–1200. doi:10.1111/dme.12642
17. Phillips GB, Jing T, Heymsfield SB. Does insulin resistance, visceral adiposity, or a sex hormone alteration underlie the metabolic syndrome? Studies in women. Metabolism. 2008;57:838–844. doi:10.1016/j.metabol.2008.01.029
18. Tchernof A, Despres JP, Belanger A, et al. Reduced testosterone and adrenal C19 steroid levels in obese men. Metabolism. 1995;44:513–519. doi:10.1016/0026-0495(95)90060-8
19. Gao J, Zhang M, Zhu C, et al. The change in the percent of android and gynoid fat mass correlated with increased testosterone after laparoscopic sleeve gastrectomy in Chinese obese men: a 6-month follow-up. Obes Surg. 2018;28:1960–1965. doi:10.1007/s11695-018-3116-0
20. Phillips GB, Jing T, Heymsfield SB. Relationships in men of sex hormones, insulin, adiposity, and risk factors for myocardial infarction. Metabolism. 2003;52:784–790. doi:10.1016/S0026-0495(03)00072-6
21. Nielsen TL, Hagen C, Wraae K, et al. Visceral and subcutaneous adipose tissue assessed by magnetic resonance imaging in relation to circulating androgens, sex hormone-binding globulin, and luteinizing hormone in young men. J Clin Endocrinol Metab. 2007;92:2696–2705. doi:10.1210/jc.2006-1847
22. Goncharov NP, Katsya GV, Chagina NA, Gooren LJ. Testosterone and obesity in men under the age of 40 years. Andrologia. 2009;41:76–83. doi:10.1111/j.1439-0272.2008.00863.x
23. Gautier A, Bonnet F, Dubois S, et al. Associations between visceral adipose tissue, inflammation and sex steroid concentrations in men. Clin Endocrinol (Oxf). 2013;78:373–378. doi:10.1111/j.1365-2265.2012.04401.x
24. Kocarnik BM, Boyko EJ, Matsumoto AM, et al. Baseline estradiol concentration in community-dwelling Japanese American men is not associated with intra-abdominal fat accumulation over 10 years. Obes Res Clin Pract. 2016;10:624–632. doi:10.1016/j.orcp.2015.12.002
25. Liao CH, Huang CY, Li HY, Yu HJ, Chiang HS, Liu CK. Testosterone and sex hormone-binding globulin have significant association with metabolic syndrome in Taiwanese men. Aging Male. 2012;15:1–6. doi:10.3109/13685538.2011.597462
26. Kelly DM, Jones TH. Testosterone and obesity. Obes Rev. 2015;16:581–606. doi:10.1111/obr.12282
27. Fink J, Matsumoto M, Tamura Y. Potential application of testosterone replacement therapy as treatment for obesity and type 2 diabetes in men. Steroids. 2018;138:161–166. doi:10.1016/j.steroids.2018.08.002
28. Shuster A, Patlas M, Pinthus JH, Mourtzakis M. The clinical importance of visceral adiposity: a critical review of methods for visceral adipose tissue analysis. Br J Radiol. 2012;85:1–10. doi:10.1259/bjr/38447238
29. Alberti KG, Zimmet P, Shaw J. Metabolic syndrome–a new world-wide definition. A consensus statement from the International Diabetes Federation. Diabet Med. 2006;23:469–480. doi:10.1111/j.1464-5491.2006.01858.x
30. Olarescu NC, Jorgensen AP, Godang K, Jurik AG, Froslie KF, Bollerslev J. Dual-energy X-ray absorptiometry is a valid method to estimate visceral adipose tissue in adult patients with Prader-Willi syndrome during treatment with growth hormone. J Clin Endocrinol Metab. 2014;99:E1727–1731. doi:10.1210/jc.2014-2059
31. Godang K, Qvigstad E, Voldner N, et al. Assessing body composition in healthy newborn infants: reliability of dual-energy x-ray absorptiometry. J Clin Densitom. 2010;13:151–160. doi:10.1016/j.jocd.2010.01.121
32. Shen Y, Dong H, Lu X, et al. Associations among maternal pre-pregnancy body mass index, gestational weight gain and risk of autism in the Han Chinese population. BMC Psychiatry. 2018;18:11. doi:10.1186/s12888-018-1593-2
33. Zhang L, Shen Y, Zhou J, et al. Relationship between waist circumference and elevation of carotid intima-media thickness in newly-diagnosed diabetic patients. Biomed Environ Sci. 2014;27:335–342. doi:10.3967/bes2014.058
34. Li S, Guo H, Liu Y, et al. Relationships of serum lipid profiles and bone mineral density in postmenopausal Chinese women. Clin Endocrinol (Oxf). 2015;82:53–58. doi:10.1111/cen.12616
35. Guo Y, Tang CY, Man XF, et al. Insulin receptor substrate-1 time-dependently regulates bone formation by controlling collagen Alpha 2 expression via miR-342. FASEB J. 2016;30:4214–4226. doi:10.1096/fj.201600445RR
36. Lahti A, Hyltoft Petersen P, Boyd JC, Fraser CG, Jorgensen N. Objective criteria for partitioning Gaussian-distributed reference values into subgroups. Clin Chem. 2002;48:338–352. doi:10.1093/clinchem/48.2.338
37. Shah RV, Murthy VL, Abbasi SA, et al. Visceral adiposity and the risk of metabolic syndrome across body mass index: the Mesa study. JACC Cardiovasc Imaging. 2014;7:1221–1235. doi:10.1016/j.jcmg.2014.07.017
38. Fui MN, Dupuis P, Grossmann M. Lowered testosterone in male obesity: mechanisms, morbidity and management. Asian J Androl. 2014;16:223–231. doi:10.4103/1008-682X.122365
 © 2022 The Author(s). This work is published and licensed by Dove Medical Press Limited. The full terms of this license are available at https://www.dovepress.com/terms.php and incorporate the Creative Commons Attribution - Non Commercial (unported, v3.0) License.
By accessing the work you hereby accept the Terms. Non-commercial uses of the work are permitted without any further permission from Dove Medical Press Limited, provided the work is properly attributed. For permission for commercial use of this work, please see paragraphs 4.2 and 5 of our Terms.
© 2022 The Author(s). This work is published and licensed by Dove Medical Press Limited. The full terms of this license are available at https://www.dovepress.com/terms.php and incorporate the Creative Commons Attribution - Non Commercial (unported, v3.0) License.
By accessing the work you hereby accept the Terms. Non-commercial uses of the work are permitted without any further permission from Dove Medical Press Limited, provided the work is properly attributed. For permission for commercial use of this work, please see paragraphs 4.2 and 5 of our Terms.