")
Back to Journals » Journal of Inflammation Research » Volume 16
Association of Serum Uric Acid Level with Risk of Abdominal Aortic Calcification: A Large Cross-Sectional Study
Authors Liu T , Zuo R, Song J, Wang J, Zhu Z, Sun L, Wang S, Li B, Pan Y, Wang B
Received 27 January 2023
Accepted for publication 15 April 2023
Published 26 April 2023 Volume 2023:16 Pages 1825—1836
DOI https://doi.org/10.2147/JIR.S404668
Checked for plagiarism Yes
Review by Single anonymous peer review
Peer reviewer comments 3
Editor who approved publication: Dr Adam D Bachstetter
Tao Liu,1,* Ronghua Zuo,2,* Jia Song,1,* Jia Wang,3 Zhijian Zhu,1 Lifang Sun,1 Shasha Wang,1 Baoyin Li,1 Yesheng Pan,1 Bing Wang1
1Department of Cardiology, Jinshan Branch of Shanghai Sixth People’s Hospital, Shanghai, 201500, People’s Republic of China; 2Department of Anesthesiology, the First Affiliated Hospital of Nanjing Medical University, Nanjing, Jiangsu, 210029, People’s Republic of China; 3Department of Nephrology, the Affiliated Hospital of Xuzhou Medical University, Xuzhou, Jiangsu, 221000, People’s Republic of China
*These authors contributed equally to this work
Correspondence: Bing Wang, Department of Cardiology, Jinshan Branch of Shanghai Sixth People’s Hospital, Shanghai, 201500, People’s Republic of China, Email [email protected]
Objective: The association between serum uric acid (sUA) and incident abdominal aortic calcification (AAC), and severe abdominal aortic calcification (SAAC) in the general population of the United States (US) is unclear. Therefore, this research aimed to investigate the association between sUA and the risk of AAC and SAAC.
Methods: Individuals from National Health and Nutrition Examination Survey (NHANES) database were analyzed cross-sectionally between 2013 and 2014. The restricted cubic spline (RCS), multivariable logistic regression model and subgroup analysis were utilized to evaluate the correlation between sUA and incident AAC, and SAAC. In addition, generalized additive models with smooth functions were employed to survey the relationship between sUA and the degree of AAC.
Results: This study included 3016 individuals from the NHANES database. According to the RCS plot, sUA levels were associated with the risk of AAC/SAAC in a U-shaped pattern in the US population. The degree of calcification decreased at first and then increased with the increase in the sUA level.
Conclusion: Close monitoring and adequate control of sUA levels in the US general population may reduce the risk of AAC and SAAC.
Keywords: abdominal aortic calcification, serum uric acid, cross-sectional study, China, United States
Introduction
The abnormal buildup of minerals, such as calcium and phosphate, in blood vessels is called vascular calcification (VC).1 Calcification of any arterial bed could result in cardiovascular disease (CVD) morbidity and even death; moreover, CT is the standard for assessing VC.2 VC is a systemic process, and abdominal aortic calcification (AAC) is linked to calcification and subclinical atherosclerosis in other vascular beds.3–5 Dual-energy X-ray absorptiometry (DXA), a technique commonly used to assess bone density and body composition, can be used to measure AAC.6 Coronary artery calcification (CAC) has been shown to predict CVD morbidity and mortality independently of traditional CVD risk factors.7–11 Additionally, AAC is a subclinical atherosclerosis marker and a predictor of subsequent vascular-associated morbidity and mortality.12 Previously, VC primarily focused on CAC, but recently, AAC has received a lot more attention.13
Serum uric acid (sUA), the end product of purine metabolism, has been linked to several metabolic abnormalities and coronary artery disease.14 The glomerular filtration rate excretes the majority of the sUA. The glomerular filtration rate is reduced in patients with renal insufficiency, such as chronic kidney disease, resulting in decreased uric acid excretion and elevated sUA.15 Recent studies have linked high sUA to gout and CVD.16 According to studies, high sUA is linked to nondripping blood pressure, myocardial infarction, and mortality due to CVD.17 Increased sUA levels are linked to increased oxidative stress and inflammation. Several studies have allied elevated sUA levels to hypertension, atherosclerosis, renal disease, obesity, insulin resistance, and dyslipidemia.18 In addition to aggravated lipid metabolism disorders, elevated sUA can result in high levels of low-density lipoprotein cholesterol.19 However, research into the relationship between sUA and AAC is currently limited. Therefore, this study analyzed the data from the National Health and Nutrition Examination Survey (NHANES) between 2013 and 2014 to explore the link between sUA and risk of AAC and severe AAC (SAAC) in the US general population.
Materials and Methods
Study Population
The NHANES is a study of the general public’s health and diet undertaken annually by the National Center for Health Statistics (NCHS). The NHANES data from 2013 to 2014 were included in this study. This database comprised cross-sectional socio-demographic, nutritional, and medical information gathered through questionnaires, regular physical exams, and laboratory testing.20 Furthermore, AAC data for 3708 participants were available. After excluding participants with missing sUA data (n = 124), 3016 participants were included in this analysis. The study was approved by the NCHS Ethics Review Board. Each participant provided informed written permission.
Assessment of sUA
Eligible participants were 12 years of age and older. Using a timed endpoint method, the DxC800 measured uric acid concentrations in serum, plasma, and urine. Allantoin and hydrogen peroxide result from the oxidation of sUA by uricase. In a reaction catalyzed by peroxidase, hydrogen peroxide reacts with 4-aminoantipyrine and 3, 5-dichloro-2-hydroxybenzene sulfonate (DCHBS) to produce a colored product. At a fixed time interval, the system monitors the change in absorbance at 520 nm. Absorbance changes in uric acid samples are directly proportional to concentration. Detailed laboratory procedure manuals of the methods are given in the Laboratory Method Files section (https://wwwn.cdc.gov/Nchs/Nhanes/2013-2014/BIOPRO_H.htm#LBXSUA).
AAC Measurement
DXA (Densitometer Discovery A, Hologic, Marlborough, MA, USA) was performed on the lumbar spine (vertebrae L1–L4), and the Kauppila score system was utilized to obtain and quantify AAC.21,22 DXA scans were executed by trained and certified radiology technologists at the NHANES mobile examination center. Higher AAC scores indicated SAAC. In this study, the Kauppila scores ranged from 0 to 24, with a score >6 demonstrating significant calcification and classified as SAAC.23–25 A detailed description of AAC measurements is available at https://wwwn.cdc.gov/Nchs/Nhanes/2013-2014/DXXAAC_H.htm.
Covariates
The following covariates were included in the study: age, sex, race/ethnicity, family poverty income ratio (PIR), marital status, education level, the complication of hypertension, diabetes mellitus (DM), smoking status, alcohol consumption status, physical activity (PA), body mass index (BMI), waist circumference, mean energy intake, dietary phosphorus and calcium intake, hemoglobin (Hb), fast glucose (FBG), glycohemoglobin (HbA1c), aspartate aminotransferase (AST), alanine aminotransferase (ALT), total bilirubin, gamma-glutamyl transferase (GGT), blood urea nitrogen (BUN), serum creatinine (Scr), estimated glomerular filtration rate (eGFR), serum phosphorus and calcium, total cholesterol (TC), triglyceride (TG), and high-density lipoprotein-cholesterol (HDL-C). The following data were self-reported by participants during the home interview: age, sex, race/ethnicity, marital status, education level, smoking status, alcohol consumption status, and dietary intake. Furthermore, data including Hb, FBG, HbA1c, AST, ALT, total bilirubin, GGT, BUN, Scr, eGFR, serum phosphorus and calcium, TC, TG, and HDL-C were obtained from the laboratory tests. A detailed description of the variables used in this research is available at https://www.cdc.gov/nchs/nhanes/.
Statistical Analysis
All analyses were conducted using Stata version 14.0 (Stata Corporation, College Station, TX, USA) and R version 4.2.0 (R Foundation for Statistical Computing, Vienna, Austria). The “mice” package was used for multiple imputations on samples with missing covariate data. The sUA levels were categorized into quartiles, and the lowest quartile served as the reference group (Q1). When calculating all estimates, we accounted for the NHANES sample weights. Results for continuous variables were reported as mean (standard deviation), and categorical variables were expressed as numbers and numbers (%). The significance of differences was determined via weighted linear regression models for the continuous variables and weighted chi-square tests for the categorical variables. A weighted multiple-regression model was used to examine the relationship between sUA levels and the risk of AAC and SAAC. Model 1 was adjusted for age and sex. Model 2 was adjusted for model 1 variables and race/ethnicity, marital status, education level, family PIR, smoking status, alcohol consumption status, the complication of hypertension, and DM. Finally, model 3 was adjusted for model 2 variables plus PA, BMI, waist circumference, mean energy intake, dietary phosphorus and calcium intake, Hb, FBG, HbA1c, AST, ALT, total bilirubin, GGT, BUN, Scr, eGFR, serum phosphorus and calcium, TC, TG, and HDL-C, as the final model. A P-value <0.05 was regarded as statistically significant.
Results
Baseline Characteristics
Weighted socio-demographic and medical characteristics are described in Table 1. The prevalence of AAC and SAAC was 30.1% and 10.8%, respectively. According to the sUA quartiles (Q1: 0.7–4.5 mg/dL, Q2: 4.6–5.4 mg/dL, Q3: 5.5–6.3 mg/dL, and Q4: 6.4–11.3 mg/dL), the individuals were divided into four groups. There were significant differences in sex, the complication of hypertension, alcohol consumption status, BMI, waist circumference, FBG, ALT, GGT, total bilirubin, mean energy intake, calcium and phosphorus intake, Hb, BUN, Scr, eGFR, HDL-C, and TG among the Q1, Q2, Q3, and Q4 groups. Compared with the Q1, Q3, and Q4 groups, the Q2 group had the lowest mean energy, calcium and phosphorus intake levels. However, compared with the Q1, Q2, and Q4 groups, the Q3 group had the lowest levels of TG and phosphorus while the highest levels of DBP and HbA1c. In addition, compared with Q1, Q2, and Q3, participants in Q4 were older, had the highest proportion of hypertension, and DM, highest levels of BMI, waist circumference, FBG, ALT, AST, GGT, total bilirubin, mean energy intake, phosphorus intake, Hb, BUN, Scr, TC, TG, calcium, and degree of calcification, and lower levels of DBP, eGFR, and HDL-C.
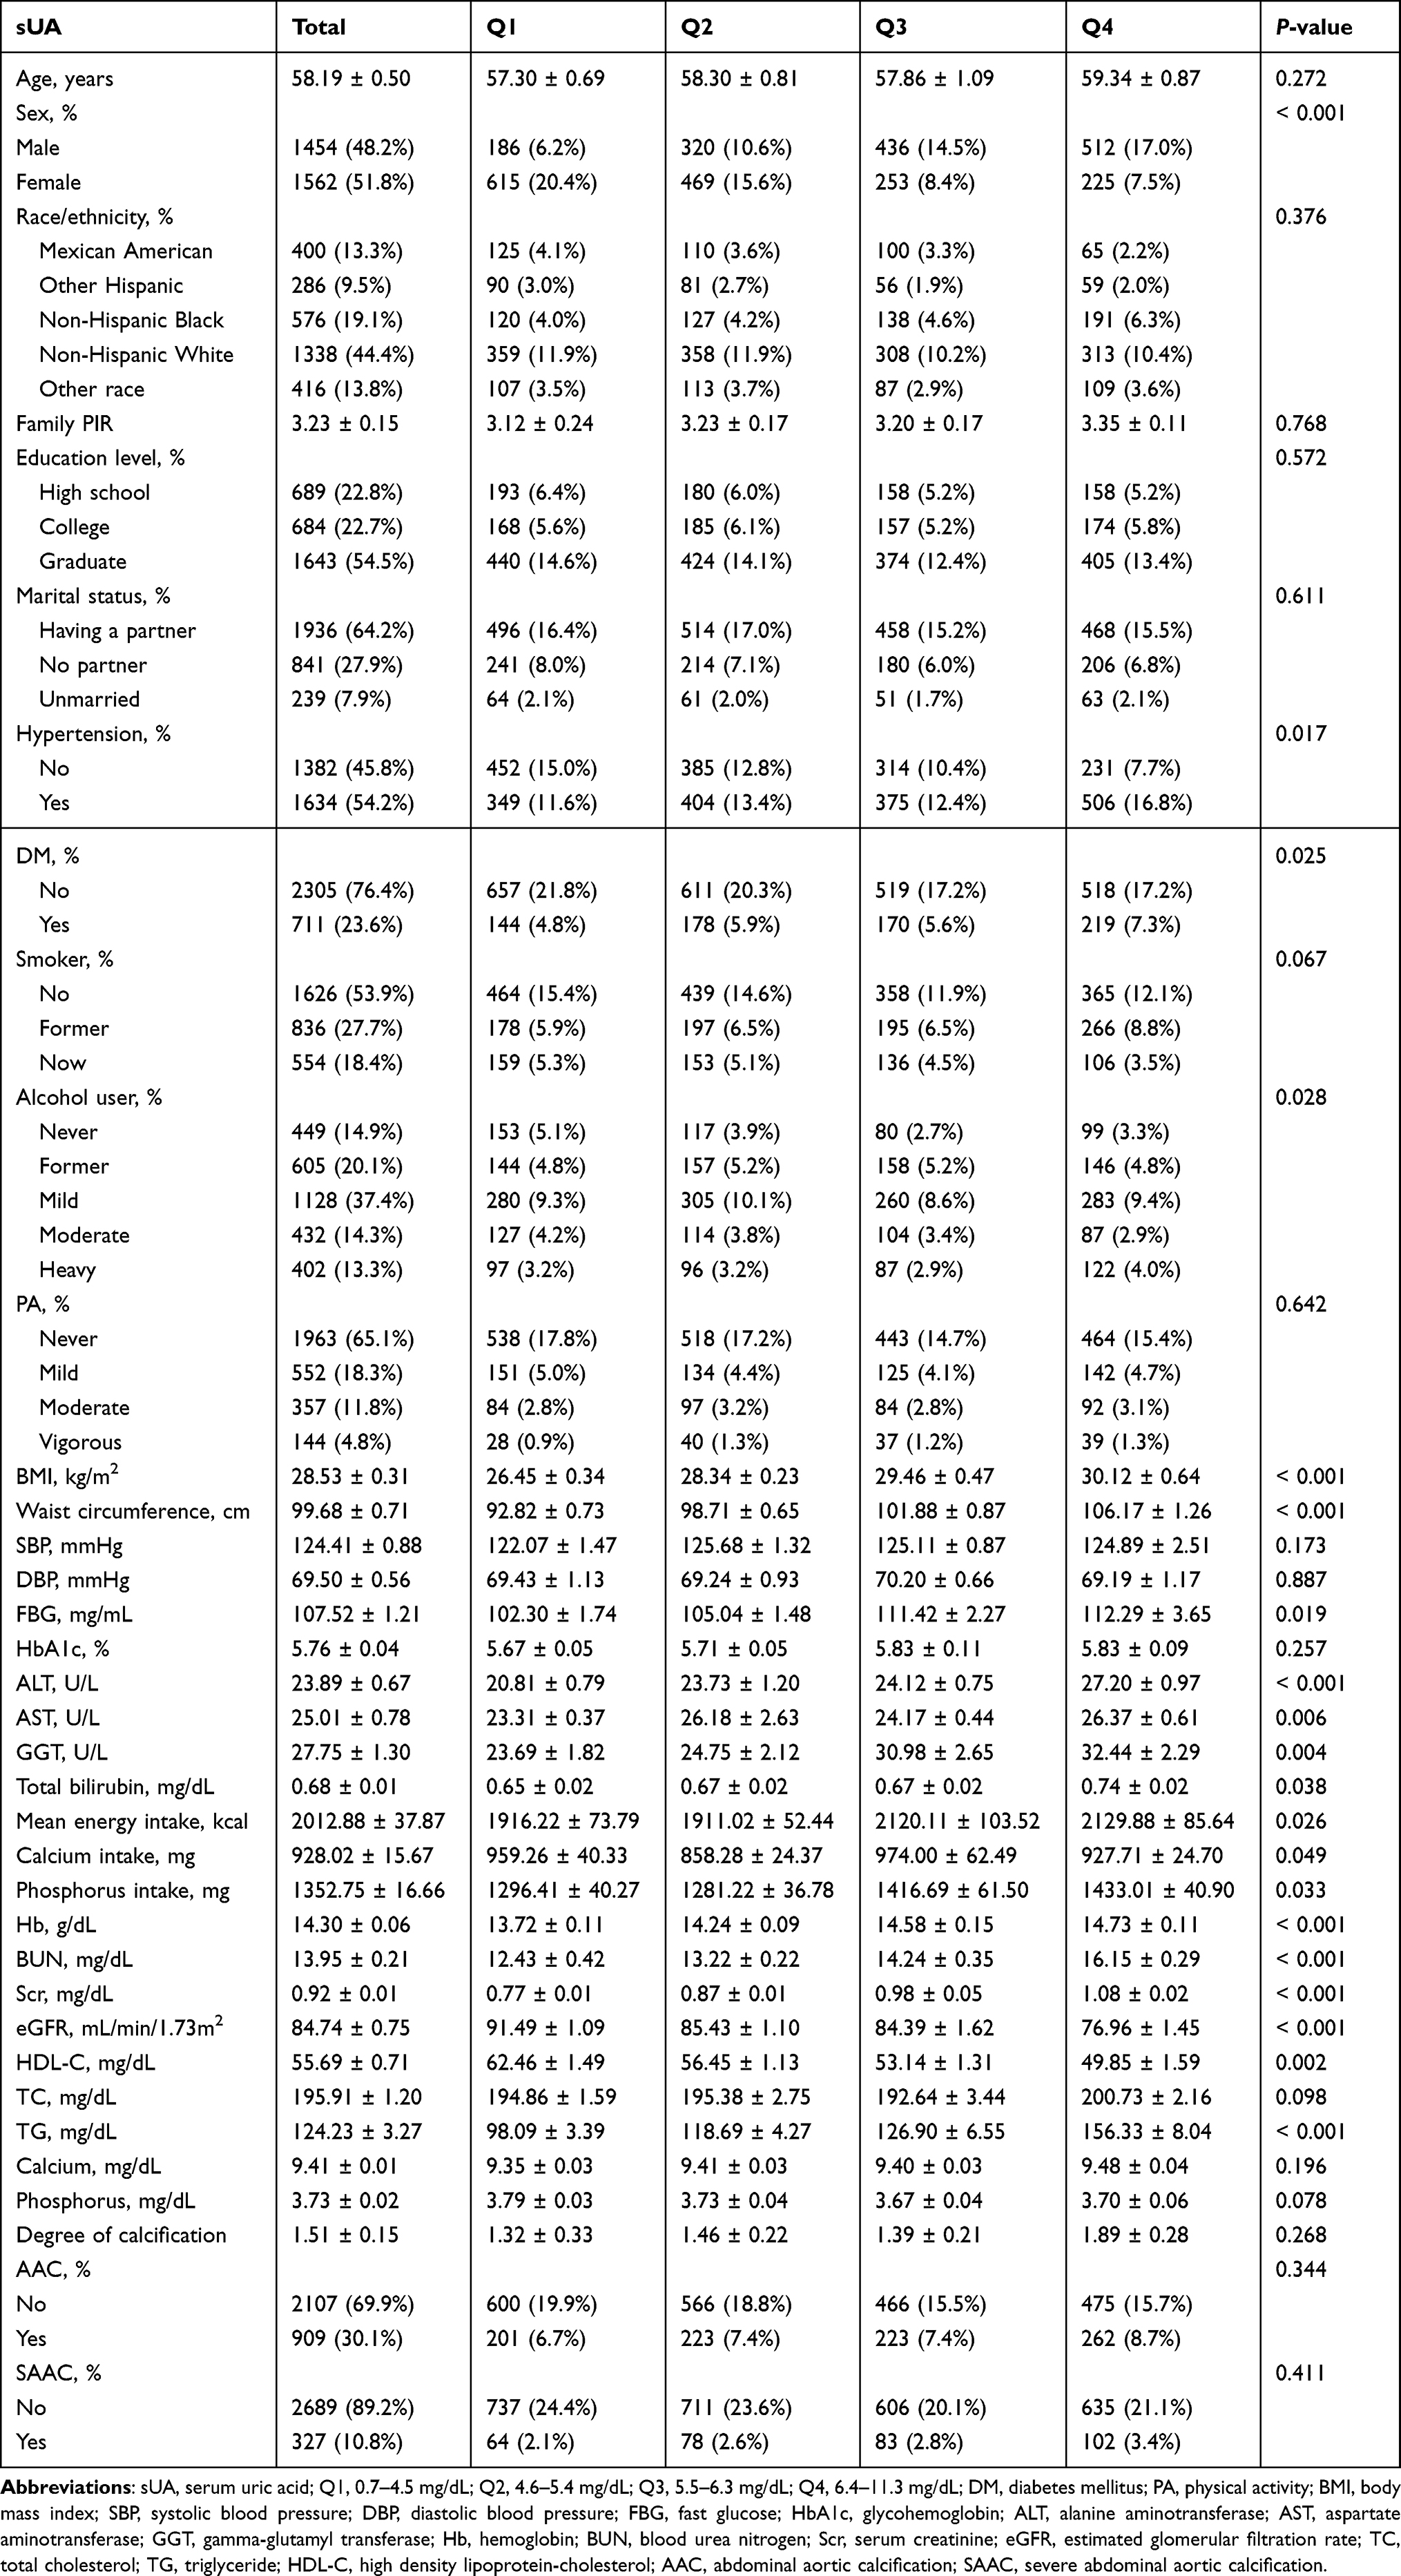 |
Table 1 Characteristics of the Study Population Based on sUA Quartiles |
Associations of sUA with AAC and SAAC
The weighted multiple-regression analysis results presented the association of sUA with AAC and SAAC. After adjusting for confounding factors, compared with the Q1 group, the odds ratios (ORs) with 95% confidence intervals (CIs) of sUA association with AAC across Q2, Q3, and Q4 were 0.967 (0.632, 1.480), 1.144 (0.719, 1.821), and 1.275 (0.762, 2.134) (Table 2). Moreover, in the fully adjusted model, the ORs and 95% CIs for SAAC risk across the sUA quartiles were 0.751 (0.378, 1.489), 0.958 (0.433, 2.121), and 1.084 (0.533, 2.205), compared with Q1 (Table 3). The restricted cubic spline (RCS) curves revealed a U-shaped relationship between sUA and the risk of AAC and SAAC in the US population (P for nonlinearity <0.05, Figures 1A and B). An inflection point for sUA was observed in our study. The risk of AAC and SAAC was lowest when the sUA level was 5.42 nmol/L and 6.08 mg/dL, respectively.
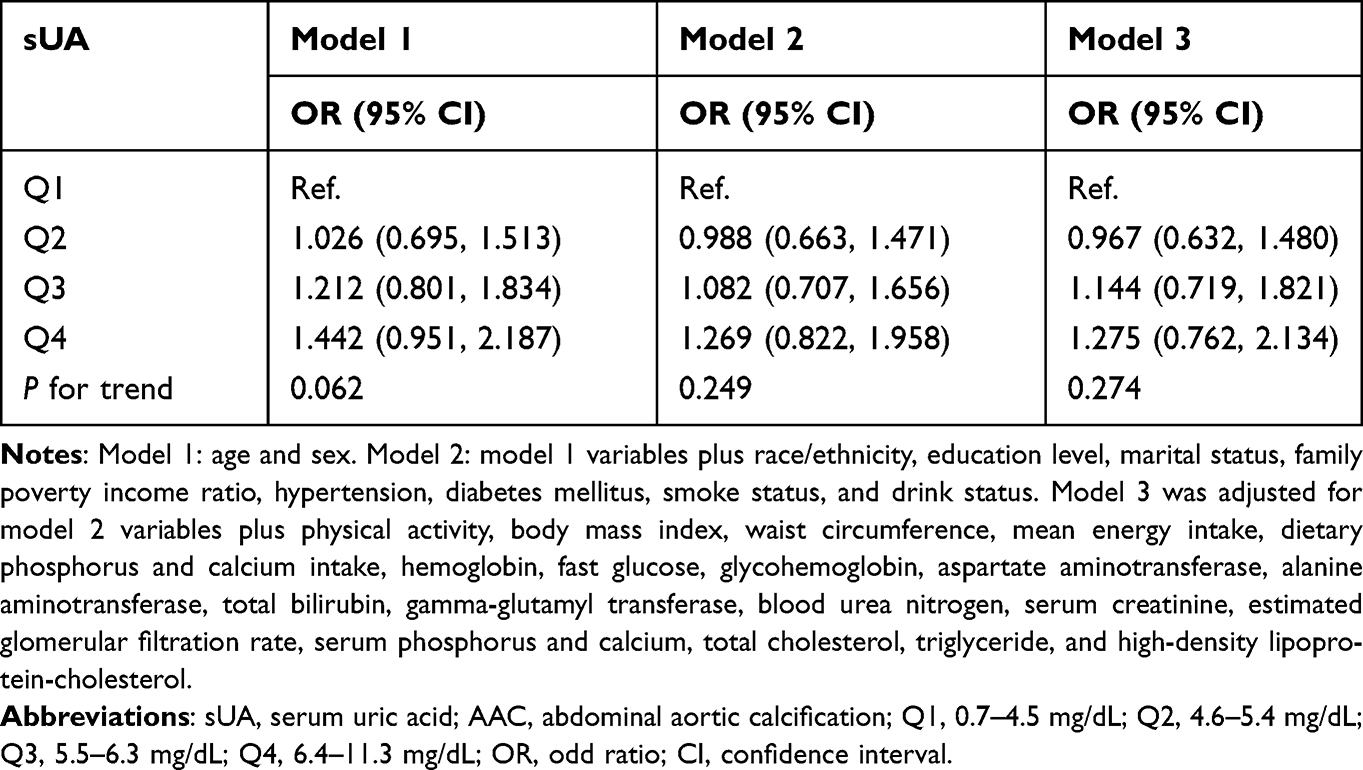 |
Table 2 Adjusted ORs for Associations Between sUA and the Risk of AAC |
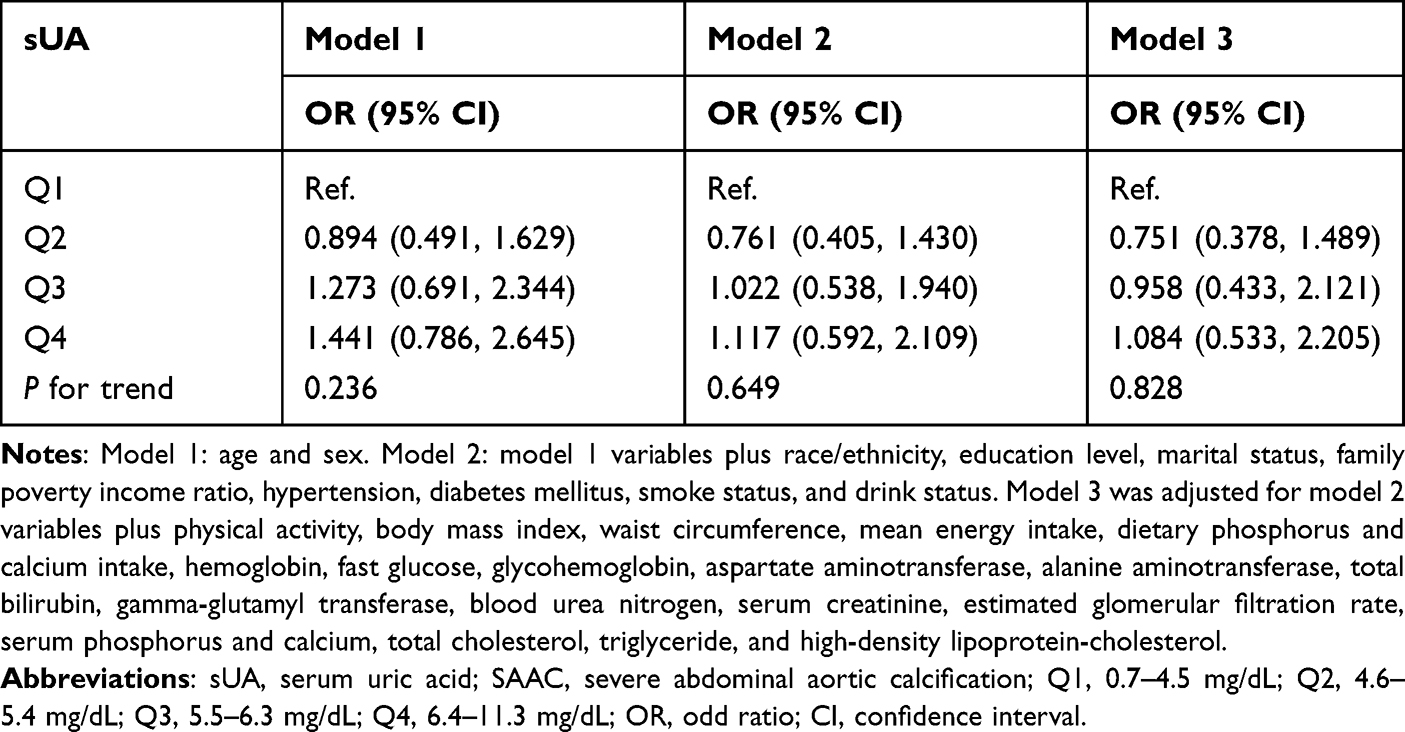 |
Table 3 Adjusted ORs for Associations Between sUA and the Incidence of SAAC |
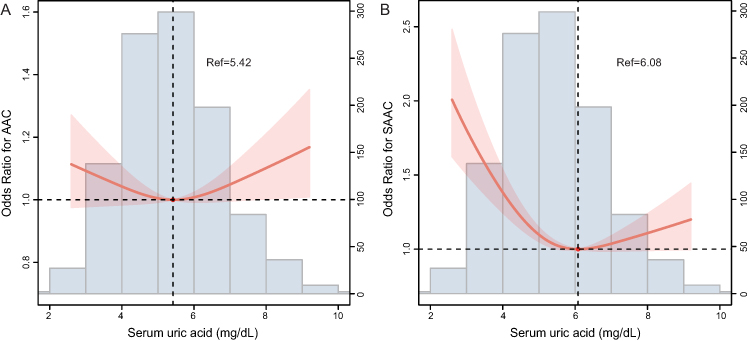 |
Figure 1 RCS curve of the association between sUA and the risk of AAC and SAAC in the NHANES database. (A) the association between sUA and AAC; and (B) the association between sUA and SAAC. Abbreviations: RCS, restricted cubic spline; sUA, serum uric acid; AAC, abdominal aortic calcification; SAAC, severe abdominal aortic calcification. |
Subgroup Analyses
Using subgroup analyses stratified by age, sex, hypertension, DM, and BMI, associations between sUA and incident AAC and SAAC were estimated. The results demonstrated a U-shaped linkage between sUA and the risk of AAC in individuals with BMI < 30 kg/m2 (Figure 2). In subgroup analysis, a significant interaction was found between age and hypertension with sUA and AAC (P for interaction <0.05, Table 4). In addition, the U-shaped relationship of serum 25(OH)D with SAAC was observed among female participants without hypertension but having DM and BMI ≥ 30 kg/m2 (Figure 3). Table 5 illustrates that the association between sUA and SAAC was significantly different in the hypertension population compared to other groups (P for interaction <0.05).
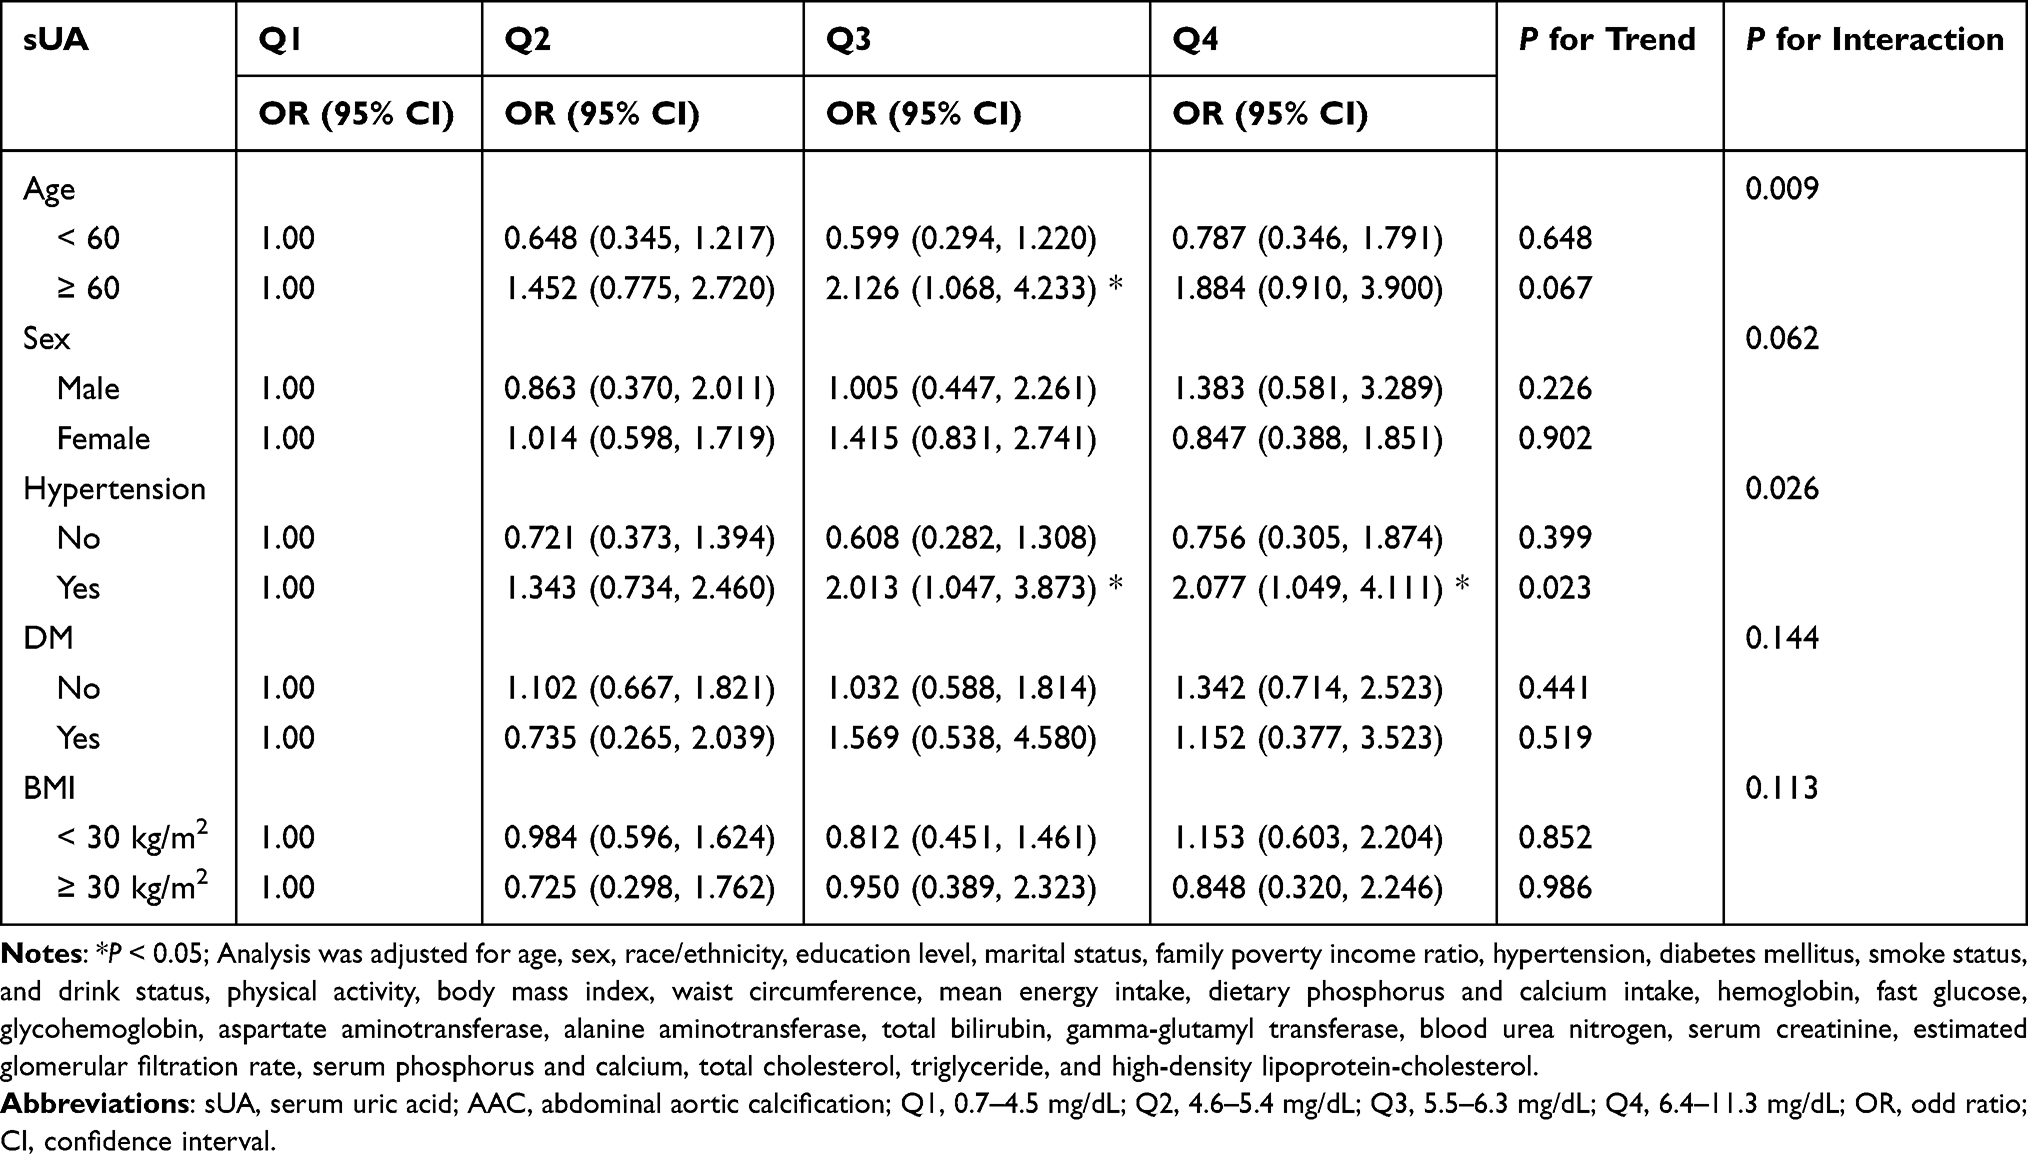 |
Table 4 Subgroups Analysis for the Associations of sUA with the Risk of AAC |
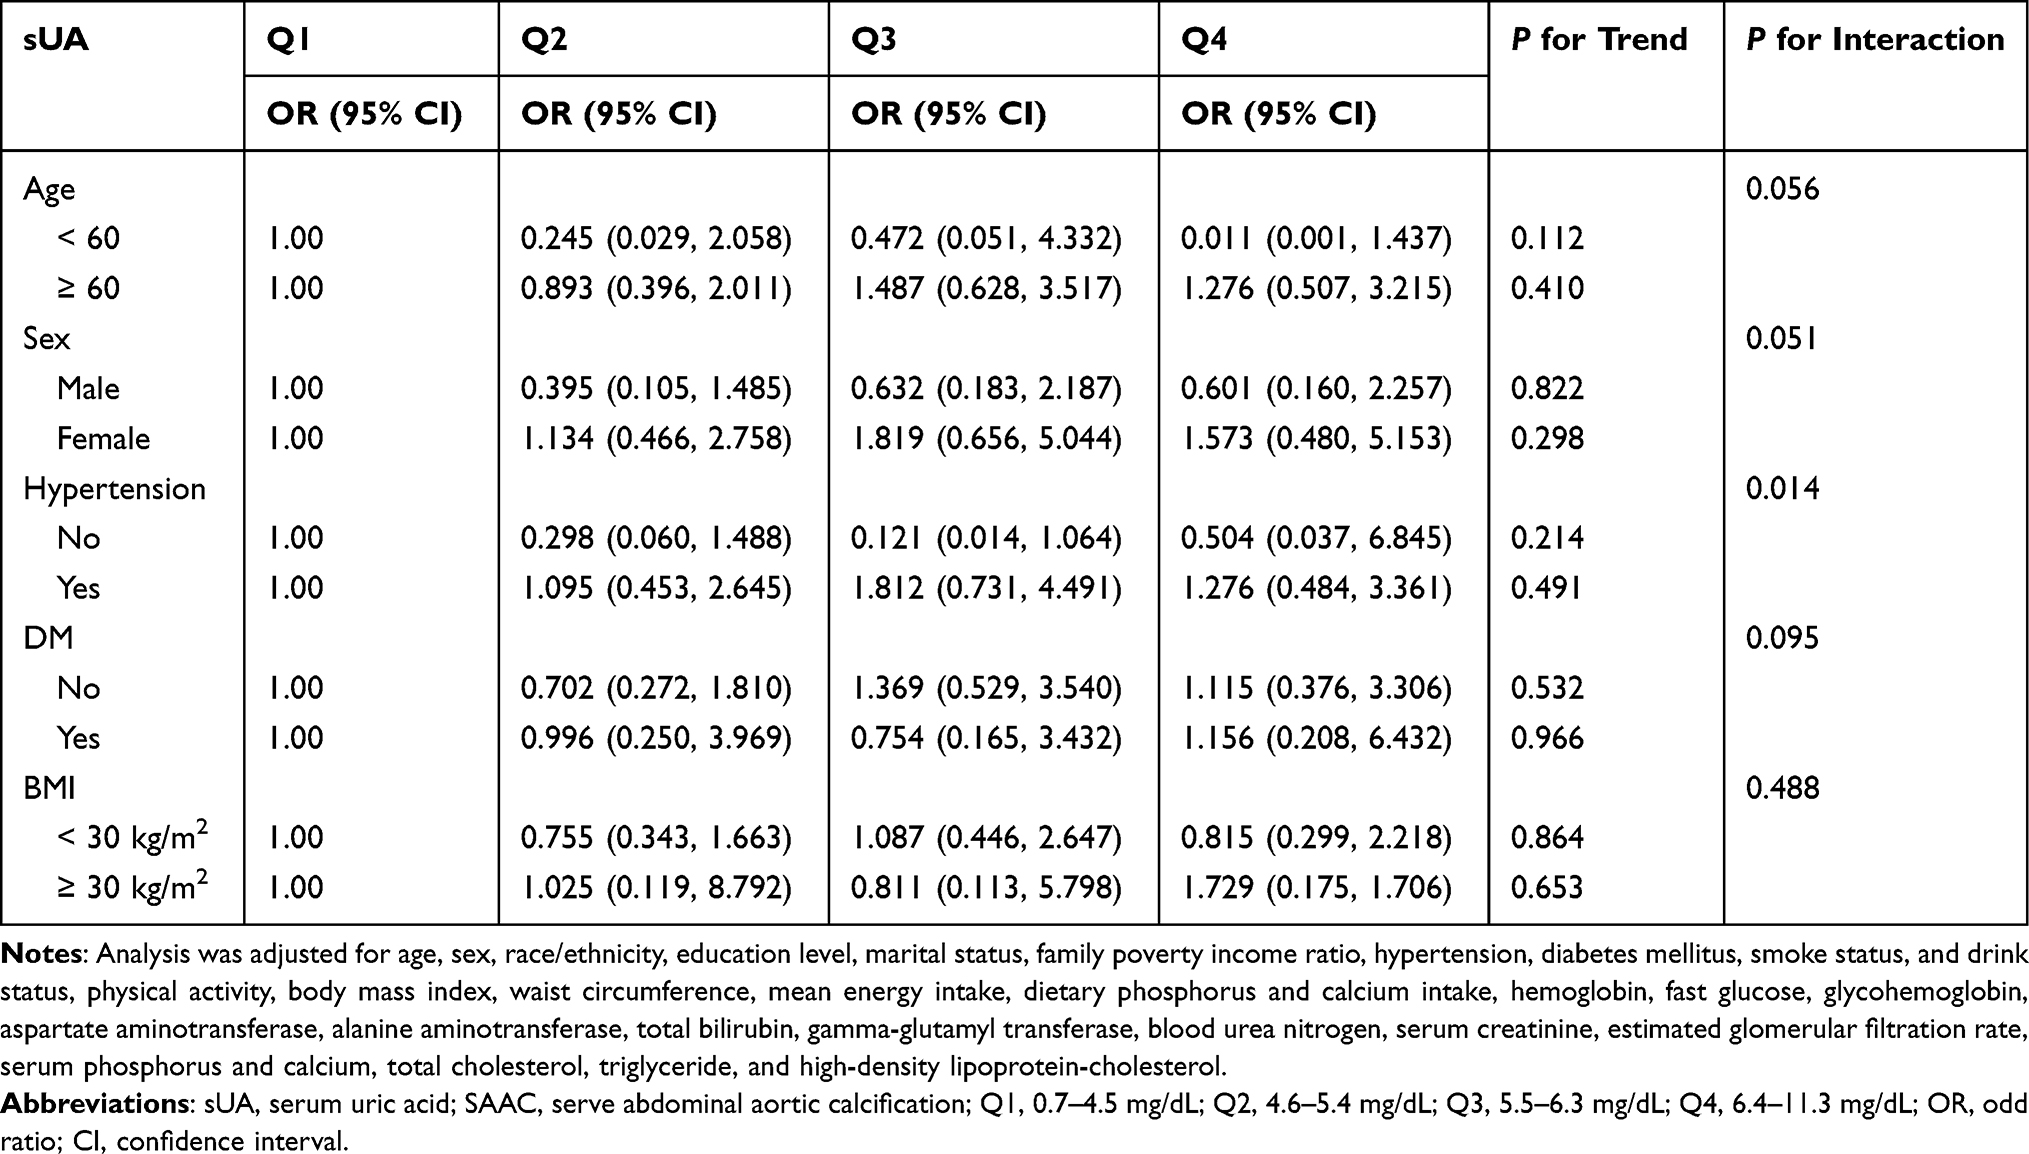 |
Table 5 Subgroups Analysis for the Associations of sUA with the Risk of SAAC |
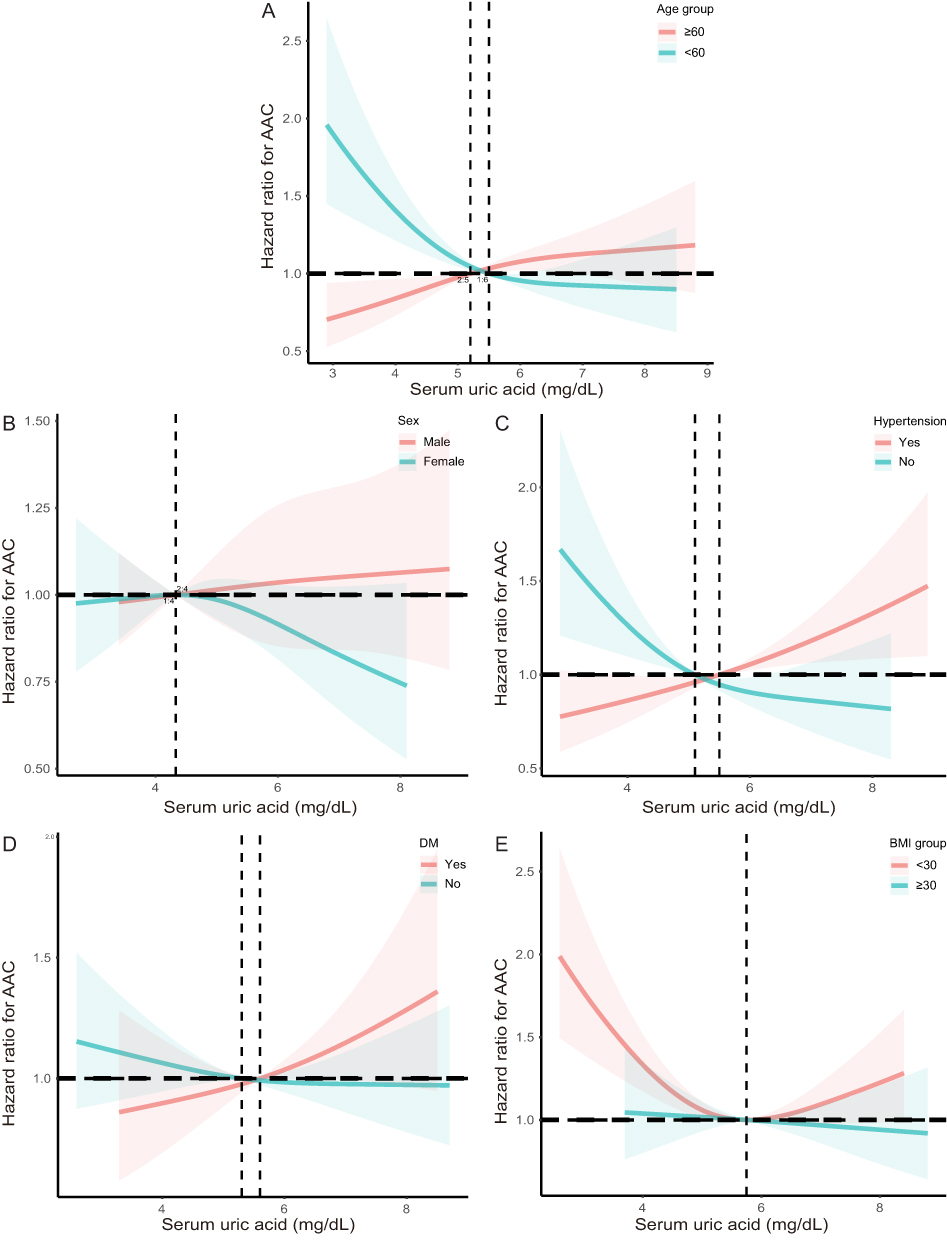 |
Figure 2 RCS curve for the association between sUA with the risk of AAC. (A) the association between sUA and AAC stratified by age; (B) the association between sUA and AAC stratified by sex; (C) the association between sUA and AAC stratified by hypertension; (D) the association between sUA and AAC stratified by DM; and (E) the association between SUA and AAC stratified by BMI. Abbreviations: RCS, restricted cubic spline; sUA, serum uric acid; AAC, abdominal aortic calcification; BMI, body mass index. |
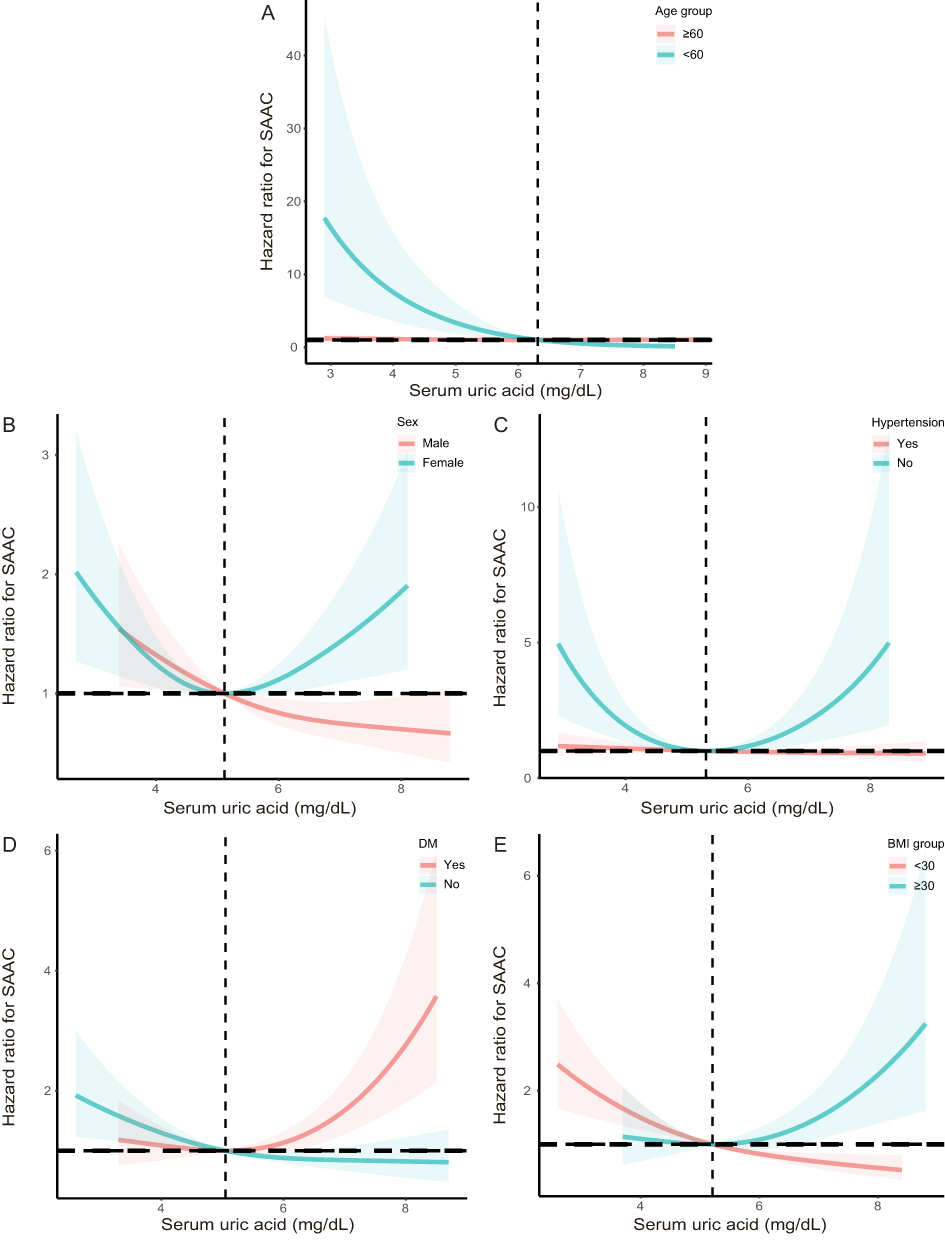 |
Figure 3 RCS curve for the association between sUA with the risk of SAAC. (A) the association between sUA and SAAC stratified by age; (B) the association between sUA and SAAC stratified by sex; (C) the association between SUA and SAAC stratified by hypertension; (D) the association between SUA and SAAC stratified by DM; and (E) the association between SUA and SAAC stratified by BMI. Abbreviations: RCS, restricted cubic spline; sUA, serum uric acid; SAAC, severe abdominal aortic calcification; BMI, body mass index. |
Associations of sUA with the Degree of AAC
Generalized additive models with smooth functions showed a U-shaped relationship between sUA and the degree of AAC in the US general population. With the increase in the sUA levels, the degree of calcification first decreased and then increased (Figure 4).
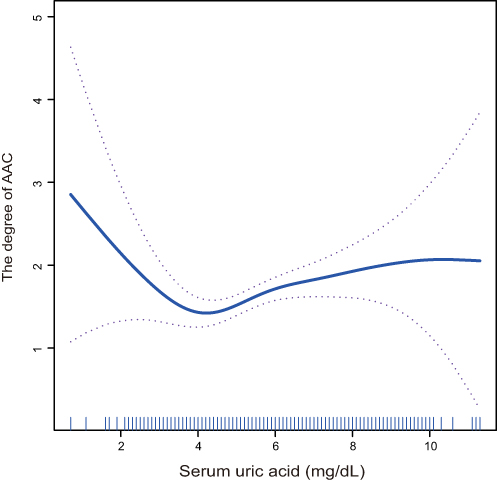 |
Figure 4 The association between sUA and the degree of AAC. Abbreviations: sUA, serum uric acid; AAC, abdominal aortic calcification. |
Discussion
Epidemiological data revealed a connection between sUA and calcification. However, the association between sUA levels and VC is controversial due to complex factors such as AAC. According to our knowledge, this is the first study to investigate the association between sUA levels and AAC and SAAC risk in the general US population.
We discovered a U-shaped relationship between the sUA level and the risk of AAC and SAAC in the study. A diet rich in precursors of uric acid results in an increase in sUA. The chief reason is alcohol consumption, especially beer, leading to a sharp increase in sUA levels; at the same time, seafood and soy products can also increase sUA.26 Furthermore, high sUA is associated with hypertension, DM, metabolic syndrome, and renal failure.27–29 Numerous studies demonstrated the close relationship between sUA levels with CVD.30,31 A rise in sUA levels is intimately associated with substantial atherosclerosis risk factors, such as hypertension, abdominal obesity, DM, metabolic syndrome, hypertriglyceridemia, endothelial dysfunction, and renal failure.32–36 A recent meta-analysis indicated that individuals with SUA levels of more than 357 umol/L had a 1.8-fold increased risk of CAC compared with normal sUA levels, and the risk of calcification rose 31% with each 88.4 umol/L increase.37 As the final product of purine metabolism, sUA may promote the proliferation of vascular smooth muscle cells, resulting in premature arterial calcification, and the longer the duration of hyperuricemia exposure, the greater the calcium deposition in the middle layer of blood arteries.38 Santos et al discovered an independent association between high sUA levels and CAC among asymptomatic men at moderate risk with metabolic syndrome.39 In addition, Atar et al found that sUA is an independent risk factor for CAC.40 However, Malik et al demonstrated that in healthy octogenarians, higher sUA levels were associated with vascular inflammation (hs-CRP) but not coronary atherosclerosis.41 Furthermore, Neogi and Coutinho and their collaborators did not find an independent relationship between sUA and CAC but identified a connection between sUA and carotid atherosclerosis, suggesting that sUA might play a role in subclinical atherosclerosis.42,43
In addition, we also found the U-shaped relationships between sUA and the risk of AAC in individuals with BMI < 30 kg/m2. Moreover, the U-shaped associations of sUA with SAAC were observed among female participants without hypertension having DM and BMI ≥ 30 kg/m2. The SAAC occurrence was found to be associated with DM. This may be related to the increase of endothelin activity, the activation of the renin-angiotensin system, and the significant impairment of vasomotor function. In addition, hyperglycemia and glycoglycation end products, hyperinsulinism, oxidative stress, lipid metabolism disorder, inflammation, apoptosis, abnormal expression of bone regulatory proteins, and local autocrine and paracrine disorders of blood vessels are important inducing factors for the VC occurrence.44 Concludingly, a U-shaped relationship existed between sUA and the degree of AAC in the US general population. Previous research has established that the risk of mild-to-moderate calcification to severe calcification is four times higher in patients with hyperuricemia than those with normal sUA.
Limitations
This study included representative samples of the multiracial population for generalization to the entire US populace. Due to the large sample size, we were able to adjust for numerous potential confounding factors. Despite this, limitations must also be recognized. First, this was a cross-sectional study; hence, determining how sUA, AAC, and SAAC are causally related was impossible. Second, the self-reports of individuals were used to diagnose diseases, including hypertension, and DM, which could have introduced the potential bias. Third, this study did not eliminate the bias introduced by other potentially confounding variables that were not adjusted.
Conclusion
In conclusion, the relationship between sUA levels and the risk of AAC and SACC presented a U-shaped curve in the US general population. Therefore, close monitoring and controlling sUA levels can reduce the risk of AAC and SAAC.
Data Sharing Statement
The datasets for this study can be found at www.cdc.gov/nchs/nhanes/.
Acknowledgments
The authors thank the staff and the participants of NHANES study for their valuable contributions.
Funding
This work was supported by the Shanghai Jinshan District Health Commission Project Fund (grant number: JSKJ-KTQN-2022-11), Shanghai University of Medical & Health Sciences Research Fund Project (grant number: SSF-23-25-002), and the Shanghai Jinshan District Medical and Health Science and Technology Innovation Fund Project (grant number: 2022-WS-61).
Disclosure
The authors have declared no conflicts of interest.
References
1. Cox AJ, Hsu FC, Agarwal S, et al. Prediction of mortality using a multi-bed vascular calcification score in the Diabetes Heart Study. Cardiovasc Diabetol. 2014;13:160. doi:10.1186/s12933-014-0160-5
2. Rennenberg RJ, Kessels AG, Schurgers LJ, van Engelshoven JM, de Leeuw PW, Kroon AA. Vascular calcifications as a marker of increased cardiovascular risk: a meta-analysis. Vasc Health Risk Manag. 2009;5(1):185–197. doi:10.2147/VHRM.S4822
3. Bastos Gonçalves F, Voûte MT, Hoeks SE, et al. Calcification of the abdominal aorta as an independent predictor of cardiovascular events: a meta-analysis. Heart. 2012;98(13):988–994. doi:10.1136/heartjnl-2011-301464
4. Lewis JR, Schousboe JT, Lim WH, et al. Abdominal aortic calcification identified on lateral spine images from bone densitometers are a marker of generalized atherosclerosis in elderly women. Arterioscler Thromb Vasc Biol. 2016;36(1):166–173. doi:10.1161/ATVBAHA.115.306383
5. Schousboe JT, Taylor BC, Kiel DP, Ensrud KE, Wilson KE, McCloskey EV. Abdominal aortic calcification detected on lateral spine images from a bone densitometer predicts incident myocardial infarction or stroke in older women. J Bone Miner Res. 2008;23(3):409–416. doi:10.1359/jbmr.071024
6. Schousboe JT, Claflin D, Barrett-Connor E. Association of coronary aortic calcium with abdominal aortic calcium detected on lateral dual energy x-ray absorptiometry spine images. Am J Cardiol. 2009;104(3):299–304. doi:10.1016/j.amjcard.2009.03.041
7. Alexopoulos D, Toulgaridis T, Davlouros P, et al. Prognostic significance of coronary artery calcium in asymptomatic subjects with usual cardiovascular risk. Am Heart J. 2003;145(3):542–548. doi:10.1067/mhj.2003.169
8. Arad Y, Goodman KJ, Roth M, Newstein D, Guerci AD. Coronary calcification, coronary disease risk factors, C-reactive protein, and atherosclerotic cardiovascular disease events: the St. Francis Heart Study. J Am Coll Cardiol. 2005;46(1):158–165. doi:10.1016/j.jacc.2005.02.088
9. Allison MA, Hsi S, Wassel CL, et al. Calcified atherosclerosis in different vascular beds and the risk of mortality. Arterioscler Thromb Vasc Biol. 2012;32(1):140–146. doi:10.1161/ATVBAHA.111.235234
10. Wilson PW, Kauppila LI, O’Donnell CJ, et al. Abdominal aortic calcific deposits are an important predictor of vascular morbidity and mortality. Circulation. 2001;103(11):1529–1534. doi:10.1161/01.CIR.103.11.1529
11. Levitzky YS, Cupples LA, Murabito JM, et al. Prediction of intermittent claudication, ischemic stroke, and other cardiovascular disease by detection of abdominal aortic calcific deposits by plain lumbar radiographs. Am J Cardiol. 2008;101(3):326–331. doi:10.1016/j.amjcard.2007.08.032
12. Chow JT, Khosla S, Melton LJ, Atkinson EJ, Camp JJ, Kearns AE. Abdominal aortic calcification, BMD, and bone microstructure: a population-based study. J Bone Miner Res. 2008;23(10):1601–1612. doi:10.1359/jbmr.080504
13. Jayalath RW, Mangan SH, Golledge J. Aortic calcification. Eur J Vasc Endovasc Surg. 2005;30(5):476–488. doi:10.1016/j.ejvs.2005.04.030
14. Sung KT, Lo CI, Lai YH, et al. Associations of serum uric acid level and gout with cardiac structure, function and sex differences from large scale asymptomatic Asians. PLoS One. 2020;15(7):e0236173. doi:10.1371/journal.pone.0236173
15. Shi Y, Tao M, Ma X, et al. Delayed treatment with an autophagy inhibitor 3-MA alleviates the progression of hyperuricemic nephropathy. Cell Death Dis. 2020;11(6):467. doi:10.1038/s41419-020-2673-z
16. Oki Y, Kawai M, Minai K, et al. High Serum Uric Acid is Highly Associated with a Reduced Left Ventricular Ejection Fraction Rather than Increased Plasma B-type Natriuretic Peptide in Patients with Cardiovascular Diseases. Sci Rep. 2019;9(1):682. doi:10.1038/s41598-018-37053-0
17. Kim Y, Choi JH, Kang J, Kim GT, Lee SG. Associations of serum retinol and α-tocopherol levels with uric acid concentrations: analysis of a population-based, nationally representative sample. Nutrients. 2020;12(6):1797.
18. Ustaoğlu G, Erdal E. Relationship between risk markers for cardiovascular disease and peri-implant diseases. Int J Implant Dent. 2020;6(1):73. doi:10.1186/s40729-020-00273-z
19. Guo LF, Chen X, Lei SS, et al. Effects and mechanisms of dendrobium officinalis six nostrum for treatment of hyperuricemia with hyperlipidemia. Evid Based Complement Alternat Med. 2020;2020:2914019. doi:10.1155/2020/2914019
20. Zipf G, Chiappa M, Porter KS, Ostchega Y, Lewis BG, Dostal J. National health and nutrition examination survey: plan and operations, 1999–2010. Vital Health Stat. 2013;56:1–37.
21. Kauppila LI, Polak JF, Cupples LA, Hannan MT, Kiel DP, Wilson PW. New indices to classify location, severity and progression of calcific lesions in the abdominal aorta: a 25-year follow-up study. Atherosclerosis. 1997;132(2):245–250. doi:10.1016/S0021-9150(97)00106-8
22. Schousboe JT, Wilson KE, Hangartner TN, Shea B. Detection of aortic calcification during vertebral fracture assessment (VFA) compared to digital radiography. PLoS One. 2007;2(8):e715. doi:10.1371/journal.pone.0000715
23. Chen W, Eisenberg R, Mowrey WB, et al. Association between dietary zinc intake and abdominal aortic calcification in US adults. Nephrol Dial Transplant. 2020;35(7):1171–1178. doi:10.1093/ndt/gfz134
24. Qin Z, Chang K, Liao R, Jiang L, Yang Q, Su B. Greater dietary inflammatory potential is associated with higher likelihood of abdominal aortic calcification. Front Cardiovasc Med. 2021;8:720834. doi:10.3389/fcvm.2021.720834
25. Górriz JL, Molina P, Cerverón MJ, et al. Vascular calcification in patients with nondialysis CKD over 3 years. Clin J Am Soc Nephrol. 2015;10(4):654–666. doi:10.2215/CJN.07450714
26. Bainbridge SA, Roberts JM. Uric acid as a pathogenic factor in preeclampsia. Placenta. 2008;29(Suppl A):S67–S72. doi:10.1016/j.placenta.2007.11.001
27. Molęda P, Fronczyk A, Safranow K, Majkowska L, Luo Z-C. Is uric acid a missing link between previous gestational diabetes mellitus and the development of type 2 diabetes at a later time of life? PLoS One. 2016;11(5):e0154921. doi:10.1371/journal.pone.0154921
28. Hsu WL, Li SY, Liu JS, et al. High uric acid ameliorates indoxyl sulfate-induced endothelial dysfunction and is associated with lower mortality among hemodialysis patients. Toxins. 2017;9(1):20. doi:10.3390/toxins9010020
29. Testa A, Mallamaci F, Spoto B, et al. Association of a polymorphism in a gene encoding a urate transporter with CKD progression. Clin J Am Soc Nephrol. 2014;9(6):1059–1065. doi:10.2215/CJN.11041013
30. Kaya EB, Yorgun H, Canpolat U, et al. Serum uric acid levels predict the severity and morphology of coronary atherosclerosis detected by multidetector computed tomography. Atherosclerosis. 2010;213(1):178–183. doi:10.1016/j.atherosclerosis.2010.08.077
31. Rodrigues TC, Maahs DM, Johnson RJ, et al. Serum uric acid predicts progression of subclinical coronary atherosclerosis in individuals without renal disease. Diabetes Care. 2010;33(11):2471–2473. doi:10.2337/dc10-1007
32. Perlstein TS, Gumieniak O, Williams GH, et al. Uric acid and the development of hypertension: the normative aging study. Hypertension. 2006;48(6):1031–1036. doi:10.1161/01.HYP.0000248752.08807.4c
33. Masuo K, Kawaguchi H, Mikami H, Ogihara T, Tuck ML. Serum uric acid and plasma norepinephrine concentrations predict subsequent weight gain and blood pressure elevation. Hypertension. 2003;42(4):474–480. doi:10.1161/01.HYP.0000091371.53502.D3
34. Dehghan A, van Hoek M, Sijbrands EJ, Hofman A, Witteman JC. High serum uric acid as a novel risk factor for type 2 diabetes. Diabetes Care. 2008;31(2):361–362. doi:10.2337/dc07-1276
35. Khosla UM, Zharikov S, Finch JL, et al. Hyperuricemia induces endothelial dysfunction. Kidney Int. 2005;67(5):1739–1742. doi:10.1111/j.1523-1755.2005.00273.x
36. Iseki K, Ikemiya Y, Inoue T, Iseki C, Kinjo K, Takishita S. Significance of hyperuricemia as a risk factor for developing ESRD in a screened cohort. Am J Kidney Dis. 2004;44(4):642–650. doi:10.1016/S0272-6386(04)00934-5
37. Liang L, Hou X, Bainey KR, et al. The association between hyperuricemia and coronary artery calcification development: a systematic review and meta-analysis. Clin Cardiol. 2019;42(11):1079–1086. doi:10.1002/clc.23266
38. Liu Z, Chen T, Niu H, et al. The establishment and characteristics of rat model of atherosclerosis induced by hyperuricemia. Stem Cells Int. 2016;2016:1365257. doi:10.1155/2016/1365257
39. Santos RD, Nasir K, Orakzai R, Meneghelo RS, Carvalho JA, Blumenthal RS. Relation of uric acid levels to presence of coronary artery calcium detected by electron beam tomography in men free of symptomatic myocardial ischemia with versus without the metabolic syndrome. Am J Cardiol. 2007;99(1):42–45. doi:10.1016/j.amjcard.2006.07.057
40. Atar AI, Yılmaz OC, Akın K, Selçoki Y, Er O, Eryonucu B. Serum uric acid level is an independent risk factor for presence of calcium in coronary arteries: an observational case-controlled study. Anadolu kardiyoloji dergisi. 2013;13(2):139–145. doi:10.5152/akd.2013.039
41. Malik R, Aneni EC, Shahrayar S, et al. Elevated serum uric acid is associated with vascular inflammation but not coronary artery calcification in the healthy octogenarians: the Brazilian study on healthy aging. Aging Clin Exp Res. 2016;28(2):359–362. doi:10.1007/s40520-015-0395-3
42. Neogi T, Terkeltaub R, Ellison RC, Hunt S, Zhang Y. Serum urate is not associated with coronary artery calcification: the NHLBI Family Heart Study. J Rheumatol. 2011;38(1):111–117. doi:10.3899/jrheum.100639
43. Coutinho Tde A, Turner ST, Peyser PA, Bielak LF, Sheedy PF, Kullo IJ. Associations of serum uric acid with markers of inflammation, metabolic syndrome, and subclinical coronary atherosclerosis. Am J Hypertens. 2007;20(1):83–89. doi:10.1016/j.amjhyper.2006.06.015
44. Rydén L. What are the risk factors for progression of coronary artery calcification in patients with type 2 diabetes? Nat Clin Pract Cardiovasc Med. 2008;5(7):370–371. doi:10.1038/ncpcardio1208
 © 2023 The Author(s). This work is published and licensed by Dove Medical Press Limited. The full terms of this license are available at https://www.dovepress.com/terms.php and incorporate the Creative Commons Attribution - Non Commercial (unported, v3.0) License.
By accessing the work you hereby accept the Terms. Non-commercial uses of the work are permitted without any further permission from Dove Medical Press Limited, provided the work is properly attributed. For permission for commercial use of this work, please see paragraphs 4.2 and 5 of our Terms.
© 2023 The Author(s). This work is published and licensed by Dove Medical Press Limited. The full terms of this license are available at https://www.dovepress.com/terms.php and incorporate the Creative Commons Attribution - Non Commercial (unported, v3.0) License.
By accessing the work you hereby accept the Terms. Non-commercial uses of the work are permitted without any further permission from Dove Medical Press Limited, provided the work is properly attributed. For permission for commercial use of this work, please see paragraphs 4.2 and 5 of our Terms.