")
Back to Journals » Neuropsychiatric Disease and Treatment » Volume 16
Association of Serum Kynurenine Levels and Neural Networks in Patients with First-Episode, Drug-Naïve Major Depression: A Source-Based Morphometry Study
Authors Okamoto N , Watanabe K, Ngyuyen LH, Ikenouchi A , Kishi T , Iwata N , Kakeda S, Korogi Y, Yoshimura R
Received 2 September 2020
Accepted for publication 13 October 2020
Published 29 October 2020 Volume 2020:16 Pages 2569—2577
DOI https://doi.org/10.2147/NDT.S279622
Checked for plagiarism Yes
Review by Single anonymous peer review
Peer reviewer comments 3
Editor who approved publication: Dr Roger Pinder
Naomichi Okamoto,1 Keita Watanabe,2 LeHoa Ngyuyen,1,3 Atsuko Ikenouchi,1 Taro Kishi,4 Nakao Iwata,4 Shingo Kakeda,5 Yukunori Korogi,6 Reiji Yoshimura1
1Department of Psychiatry, University of Occupational and Environmental Health, Kitakyushu, Japan; 2Open Innovation Institute, Kyoto University, Kyoto, Japan; 3School of Medicine and Pharmacy, Vietnam National University, Hanoi, Vietnam; 4Department of Psychiatry, Fujita Medical University, Toyoake, Japan; 5Department of Radiology, Graduate School of Medicine, Hirosaki University, Hirosaki, Japan; 6Department of Radiology, University of Occupational and Environmental Health, Kitakyushu, Japan
Correspondence: Reiji Yoshimura
Department of Psychiatry, University of Occupational and Environmental Health, Kitakyushu, Fukuoka 8078555, Japan
Tel +81 936917253
Email [email protected]
Purpose: The kynurenine (KYN) pathway can directly or indirectly influence cerebral volume and neural integrity in patients with major depression (MD). The aim of the present study was to investigate neural network systems and the KYN pathway in patients with first-episode, drug-naïve MD.
Patients and Methods: Twenty right-handed drug-naïve patients, with MD diagnosed using the Diagnostic and Statistical Manual for Mental Disorders, Fourth Edition, Text Revision, Research Version, were included in this study. Magnetic resonance imaging scans and scores on the Hamilton Rating Scale for Depression were assessed, and serum sampling was performed prior to the start of pharmacological treatment. Image processing and data analysis were performed according to our recently published procedure. Serum metabolomes were measured in the cation and anion modes of CE-FTMS-based metabolome analysis.
Results: We found that serum KYN levels were positively correlated with the Z-scores of the salience network but not with those of the central executive network or default mode network. No associations were observed between serum glutamate levels and the Z-score of any of the three networks.
Conclusion: Our results indicate that serum KYN levels might affect the activity of the salience network in first-episode, drug-naïve patients with MD.
Keywords: kynurenine, major depression, neural network, source-based morphometry
Introduction
Major depression (MD) is one of the most common mental health disorders, incurring devastating social, personal, and medical consequences. The lifetime risk of MD is approximately 15–18%, and patients with MD often experience a reduced quality of life and are at an increased risk of suicide. The etiology of MD remains elusive. Monoamines, including serotonin, are thought to play important roles in the pathophysiology of MD.1 Inflammation is also known to be associated with MD.2,3 A consistent body of evidence from preclinical and clinical studies demonstrates that inflammation in both the peripheral and central nervous systems plays an important role in the pathophysiology of MD. Activated microglia release pro-inflammatory cytokines such as interleukin-1 (IL-1), IL-6, tumor necrosis factor-α (TNFα), and prostaglandins.4 Dysregulation of the interaction of the nervous and immune systems may lead to neuronal damage or neurodegeneration.5 In fact, proinflammatory cytokines activated in the brain can induce common symptoms of MD. For example, peripheral levels of IL-6 and TNFα are increased in patients with MD.4,6 Tryptophan (a precursor of serotonin), serotonin degradation, and the role of tryptophan in the availability of serotonin and inflammation have brought attention to the kynurenine (KYN) pathway with regard to its potential roles in MD.5–8
Activation of the KYN pathway is a potential mechanism by which inflammation can cause MD via interfering with tryptophan metabolism.9 Two major pathways metabolize tryptophan. One pathway uses tryptophan 2,3-dioxygenase, whose activity is regulated by glucocorticoids. The other pathway uses the ubiquitous indoleamine 2.3-dioxygenase (IDO), which is activated by proinflammatory cytokines. Downstream of IDO, KYN is transformed into kynurenic acid (KYNA) in astrocytes or into the neurotoxic 3-hydroxykynurenine (3-HK) and quinolinic acid (QUIN) in microglia.11,12 Moreover, inflammation-induced MD is mediated by increased brain levels of QUIN, which activates NMDA receptors.13 Increases in plasma KYN metabolites are associated with the symptoms of MD, which supports the inflammatory hypothesis of MD.14–16 KYNA has neuroprotective properties and competitively inhibits ionotropic glutamate receptors at high concentrations, but attenuates the activity of NMDA receptors.13 QUIN is an NMDA receptor agonist that can inhibit glutamate (GLU) reuptake by astrocytes, leading to neurotoxicity.17 QUIN also enhances the production of proinflammatory mediators in astrocytes.18
In short, increased inflammation and the KYN pathway affect NMDA receptors, and reductions in serotonin might be associated with the pathophysiology of MD.5,7,8,10 The association between the KYN pathway and GLU neurotransmission might be complicated. Moreover, several studies have reported associations between KYN metabolites and brain morphology or neural integrity using magnetic resonance imaging (MRI) in MD patients.8–10,19–21 Taking these findings into account, the KYN pathway may directly or indirectly influence cerebral volume and neural integrity in MD patients. The detailed associations between the KYN pathway and the pathophysiology of MD remain unclear. There has been growing interest in understanding the large structural networks of the brain as revealed using structural imaging, namely, high-resolution 3D, T1-weighted imaging. These structural networks arise from neural plasticity; regions that fire together and wire together might also be coupled together in particular volumes as a result of mutual trophic and plasticity-related changes at the synaptic and cellular levels.11,22 Recently, we reported that MD patients display intra- and inter-network abnormalities in several neural network systems.12,22,23 Therefore, in the present study, we focused on the salience network (SN), the central executive (CE) network, and the default mode (DM) network, and their relationship to the KYN pathway in MD patients. In addition, we investigated the relationship between serum GLU levels and the network findings. To the best of our knowledge, this is the first report investigating associations between these neural network systems, using the structural covariance network method,23 and serum KYN or GLU levels in first-episode, drug-naïve MD patients.
Patients and Methods
Ethics Statement
The study protocol was approved by the Ethics Committee of the University of Occupational and Environmental Health, Kitakyushu, Japan (approval number: H25-13, 8 May 2013). This study was conducted in accordance with the Declaration of Helsinki. All the participants who entered the study signed an informed consent document explaining the study protocol and potential risks.
Participants
Patients were recruited from the University Hospital of the University of Occupational and Environmental Health, Kitakyushu, Japan, from March 2009 to January 2017. All patients met the diagnostic criteria of MD according to the full-structured clinical interview from the Diagnostic and Statistical Manual for Mental Disorders, Fourth Edition, Text revision, Research Version.23,42 The 17-item HAMD24,43 was used to evaluate the severity of MD. Patients with a HAMD score of 14 points or more were enrolled in the study. Patients with a history of neurological disease, substance use, and/or the presence of any other psychiatric disorders were excluded. In total, twenty right-handed drug-naïve patients with MD were included in this study. MRI scanning, HAMD scoring, and serum sampling were performed prior to the start of pharmacological treatment. The clinical and demographic characteristics of the patients are summarized in Table 1.
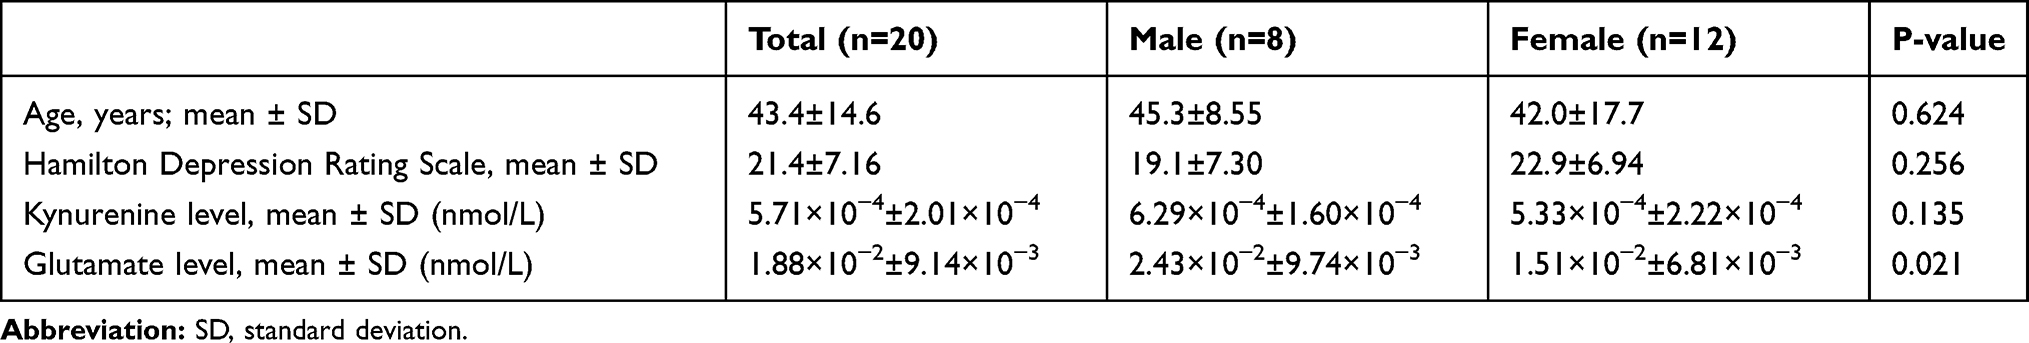 |
Table 1 Patient Clinical and Demographic Characteristics |
Sample Preparation and Measurements
Blood sampling was performed during 7–9 am, before breakfast. Participants had fasted and were resting for at least 30 min before blood withdrawal. Samples were sent from the University of Occupational and Environmental Health to Human Metabolome Technologies Inc. (HMT; Tsuruoka, Japan), where each 50 µL sample was mixed with 450 µL of methanol containing internal standards (10 µM) and vortexed. Chloroform (500 µL) and Milli-Q water (200 µL) were added, mixed thoroughly, and centrifuged (2300 × g, 4°C, 5 min). The water layer (400 µL) was filtered through a 5-kDa cutoff filter (ULTRAFREE-MC-PLHCC, HMT, Yamagata, Japan) to remove macromolecules. The filtrate was centrifugally concentrated and resuspended in 50 µL of ultrapure water immediately before measurement. The compounds were measured in the cation and anion modes of a capillary electrophoresis-Fourier transform mass spectrometry (CE-FTMS)-based metabolome analysis system under conditions 1–3. The samples were diluted for the measurements to improve the quality of the CE-MS analysis.
Metabolome measurements were carried out at HMT through CE-TOFMS (time-of-flight mass spectrometry) using an Agilent CE System equipped with the Agilent 6210 time-of-flight mass spectrometer, the Agilent 1100 isocratic HPLC pump, the Agilent G1603A CE-MS adapter kit, and the Agilent G1607A CE-ESI-MS sprayer kit (Agilent Technologies, Waldbronn, Germany). The system was controlled by Agilent G2201AA ChemStation software version B.03.01 for CE (Agilent Technologies, Waldbronn, Germany). The metabolites were analyzed using a fused silica capillary (50 μm internal diameter × 80 cm total length), with commercial electrophoresis buffers (Solution ID: H3301-1001 for cation analysis and H3302-1021 for anion analysis, HMT) as the electrolytes. The sample was injected at a pressure of 50 bar for 10 s (approximately 10 nL) in cation analysis and 25 s (approximately 25 nL) in anion analysis. The spectrometer was scanned from m/z 50 to 1000. Other conditions were as described previously.44–46 Peaks were extracted using the automatic integration software MasterHands (Keio University, Tsuruoka, Japan) to obtain peak information, including m/z, migration time for CE-TOFMS measurement (MT), and peak area.47 Signal peaks corresponding to isotopomers, adduct ions, and other product ions of known metabolites were excluded, and the remaining peaks were annotated with putative metabolites from the HMT metabolite database based on their MTs and m/z values as determined from the TOFMS. The tolerance range for the peak annotation was configured at ±0.5 min for MT and ±10 ppm for m/z. In addition, peak areas were normalized against those of the internal standards and the resultant relative areas were further normalized by sample amount.
Hierarchical cluster analysis and principal component analysis (PCA) were performed, respectively, by our proprietary programs PeakStat and SampleStat. Detected metabolites were plotted on metabolic pathway maps using the VANTED (Visualization and Analysis of Networks containing Experimental Data) software.48
MRI Acquisition
MRI scans were performed using a 3T MR system (Signa EXCITE 3T; GE Healthcare; Waukesha, WI, USA) with an eight-channel brain phased-array coil. Original T1 images were acquired by three-dimensional fast-spoiled gradient recalled acquisition with a steady state. The acquisition parameters were as follows: repetition time, 10 ms; echo time, 4.1 ms; inversion time, 700 ms; flip angle, 10; field-of-view, 24 cm; section thickness, 1.2 mm; and resolution, 0.9 × 0.9 × 1.2 mm. All images were corrected for image distortion due to gradient non-linearity using the Grad Warp software program25,49 and for intensity in homogeneity with the “N3” function.26,50
Data Analysis
SBM is a multivariate technique that takes advantage of an independent component analysis.27 SBM considers information across different voxels and identifies unpredicted, naturally occurring patterns of covariance across brain regions. This data-driven, voxel-based method, which examines the intrinsic connectivity of each voxel to every other voxel in the brain, does not require any prior knowledge to select regions or networks of interest. In our previous study,12,23 we had extracted structural covariance networks from 79 healthy subjects and 77 patients with MD, including twenty patients with MD from the current study, using SPM 12 and the GIFT toolbox (http://icatb.sourceforge.net).12,23 Based on these extracted structural covariance networks, we focused on the SN (Figure 1A), the CE network (Figure 1B), and the DM network (Figure 1C), which were considered to be the core drivers of disordered brain networks in patients with MD. The Z-scores of loading coefficients were used, reflecting the expression of the structural covariance networks.12,23
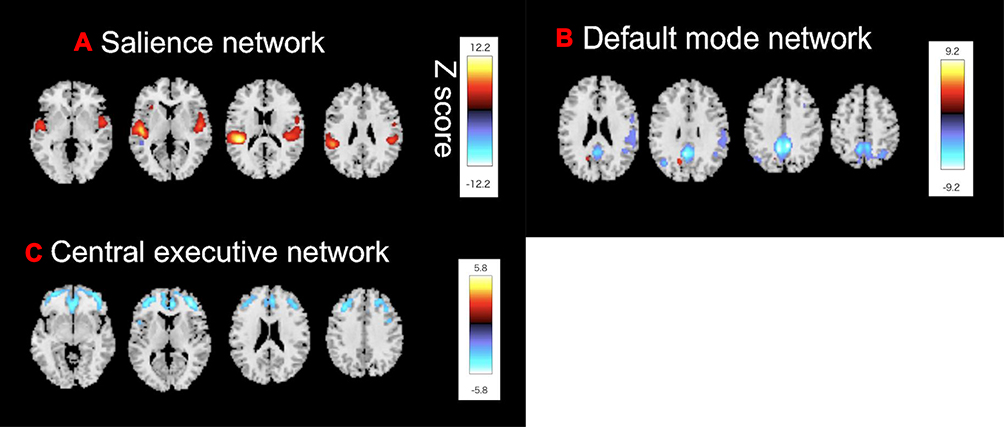 |
Figure 1 Source-based morphometry reveals (A) The SN, (B) The CE network, and (C) The DM network. Shown are the structural covariance networks with |Z| > 2.5. Red/yellow colors correspond to regions in which the voxel volumes show a positive correlation, while blue/light-blue colors correspond to regions in which the voxel volumes show a negative correlation. |
Statistical Analysis
All statistical analyses were performed using EZR software version 1.50, which was used for calculating R. More precisely, it is a modified version of R Commander designed to add statistical functions frequently used in biostatistics.28,51 The Mann–Whitney U-test was used to compare between-sex differences in serum kynurenine. The t-test was also used to compare between-sex differences in age, HAMD scores, and serum glutamine. In a multiple regression analysis controlled for age, we assessed the association between serum KYN concentrations and three brain networks (Z-scores). In a similar way, we assessed the association between serum GLU concentrations and three brain networks. Pearson’s correlation coefficient was used to evaluate the relationship between the scores of the 17 items of the HAMD and the serum KYN levels. Statistical significance was defined as p < 0.05 after Bonferroni correction.
Results
Serum Levels of KYN and GLU in MD Patients
There were no statistically significant differences in age, Hamilton Rating Scale for Depression (HAMD) scores, or serum KYN levels between males and females. Serum GLU levels were significantly lower in female MD patients than in males.
Serum Levels of KYN and Brain Networks
To identify whether plasma KYN affected these 3 brain structural networks, we correlated the Z-scores with plasma KYN levels. Serum KYN levels were significantly positively correlated with the Z-scores of the SN after Bonferroni correction (R2=0.43, p=0.04; Figure 2A) but not with those of the CE network (R2 =0.55, p=0.26; Figure 2B) or the DM network (R2=0.26, p=0.70; Figure 2C). No association was found between the serum KYN levels and HAMD scores (r=−0.17, p=0.49; Figure 3).
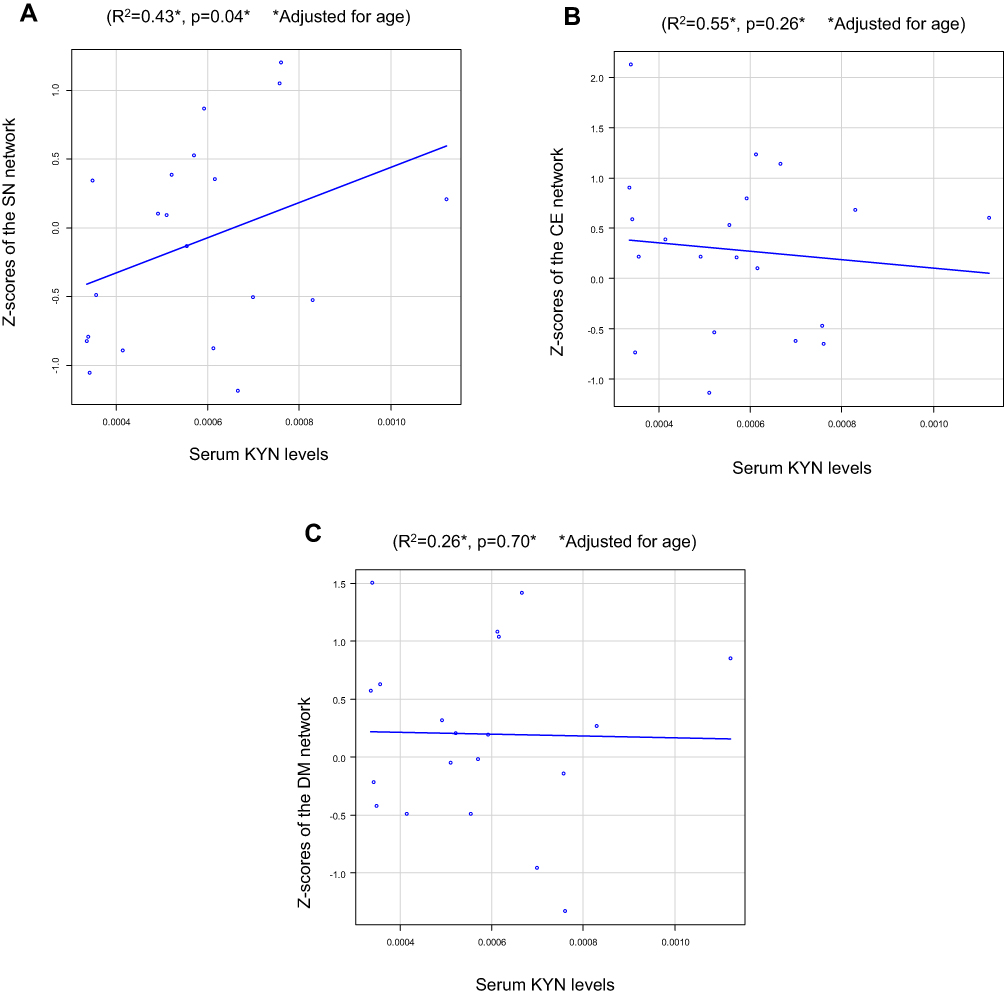 |
Figure 2 Serum kynurenine (KYN) levels vs the Z-scores of neural networks in patients with major depression (MD): (A) The salience network (SN), (B) The central executive (CE) network, and (C) The default mode (DM) network. |
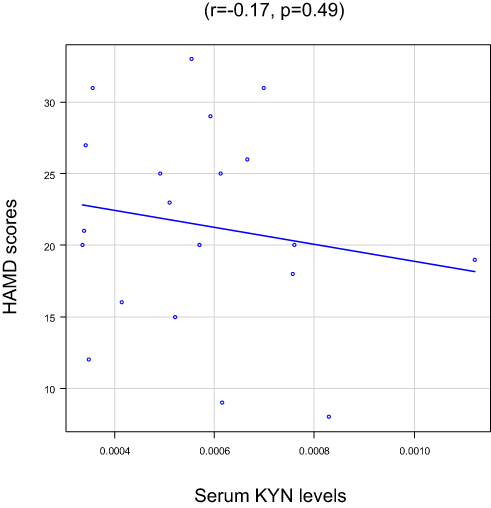 |
Figure 3 Serum KYN levels and Hamilton Rating Scale for Depression (HAMD) scores in MD patients. |
Plasma Levels of GLU and Brain Networks
No associations were observed between serum GLU levels and the Z-scores in the SN (R2=0.40, p=0.06; Figure 4A), CE network (R2=0.52, p=0.73; Figure 4B), or DM network (R2=0.25, p=0.94; Figure 4C).
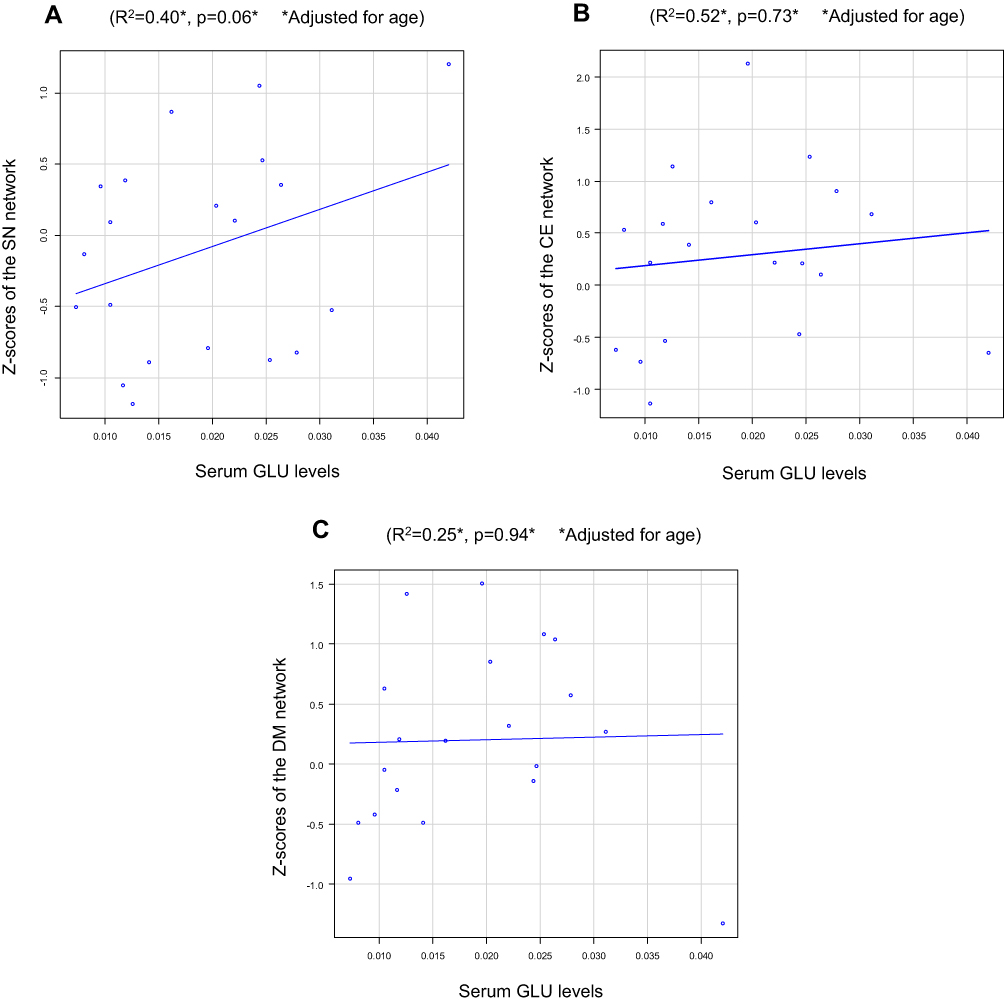 |
Figure 4 Serum GLU levels vs Z-scores of the neural networks in MD patients in (A) The SN, (B) The CE network, and (C) The DM network. |
Discussion
This is the first report investigating the associations between the three main neural networks (SN, CE, and DM) and serum KYN levels. We found a positive association between the SN and serum KYN levels in first-episode, drug-naïve patients with MD. The results were in accordance with findings that dysregulation in the kynurenine pathway is evident in depression, which has been reported in both animal and human studies. In fact, the kynurenine pathway is associated with not only the diagnosis of MD but also with the severity of depressive symptoms.24 A recent meta-analysis, however, found a reduction in serum KYN and KYNA levels, as well as an increase in QUIN levels, in MD patients compared to those in healthy control subjects.6,7 Importantly, the brain-peripheral transport system of the KYN pathway has been shown to be regulated by inflammation.11,13 Although KYN can be produced in the brain by IDO in microglia and macrophages, most of the KYN in the brain originates from the periphery.11,13,14,25 Several intermediates in the metabolic branch in which KYN is transformed into QUIN have been confirmed to be neurotoxic and comprise the neurotoxic branch of the KP. One of these is 3-HK, which can induce apoptosis.26 Furthermore, QUIN exerts a neurotoxic effect through activation of NMDA receptors. The ratio of neuroprotective factors to neurotoxic factors (KYNA/QUIN) could also be used to estimate imbalances in KP metabolism and assess the degree of nerve injury.27 The KYNA/QUIN and KYNA/KYN ratios have been suggested as potential biomarkers for diagnosing major depressive disorder.28 In response to systemic immune activation, QUIN is formed from KYN. QUIN enters the CNS from the periphery due to increased permeability of the blood-brain barrier.11,13,14,21 The enhancement of the activity of IDO by proinflammatory cytokines also plays an important role. IDO—the first enzyme in the KYN pathway—converts tryptophan to KYN. This abnormality can induce neurotoxic conditions in the brain and therefore compromise vulnerable neuronal networks, thus making the brain susceptible to MD. Another recent meta-analysis reported that serum levels of IL-1β, IL-6, and TNFα are increased in MD,4,6 which promotes the transformation of tryptophan to KYN via IDO activation. Furthermore, we recently reported that cytokines, including IL-1β and IL-6, changed the morphology and neural connections of the brains of MD patients.15,16,29,30 Upon immune activation, IDO converts tryptophan to KYN, which reduces the availability of tryptophan for serotonin synthesis. However, the mechanisms of KYN pathway dysregulation remain unclear. Taking these findings into account, we hypothesized that activated cytokines might disturb the KYN pathway and GLU neurotransmission in complicated ways, but which might influence the SN.
The SN consists of the insular cortex, dorsal anterior cingulate cortex (ACC), temporal pole, and amygdala. It is responsible for detecting and filtering stimuli as well as recruiting the relevant functional networks.13,31 It is also important for complex functions including communication, social behavior, and self-awareness. Abnormal SN connectivity is a crucial link in the pathogenesis of depression, especially in the insula and amygdala. Importantly, the SN regulates the CE and DM networks.17,32 In short, the SN switches the CE and DM networks on and off. The structural and functional abnormalities of the SN observer in patients with MD might change in association with symptomatic improvement when the patient is responding to psychotherapy and pharmacotherapy. Specifically, the connectivity among the putamen, caudate, and cingulate may be a good predictor of response to psychotherapy,18,19,33,34 whereas high ACC activity and low striatal activity may predict responses to antidepressants.20,35 Thus, different networks within the SN play unique roles in the improvement of depressive symptoms during psychotherapy or pharmacotherapy. In fact, recent findings suggest that the connectivity between the rostral anterior cingulate cortex and the rostral anterior insula, a key region of the SN, is an important prognostic indicator of improvements in depression. The authors also indicated that early changes in this connectivity can be useful predictors of remission.21,36 Another important finding in the present study was a lack of correlation between serum GLU levels and the three neuronal networks. While peripheral (serum or plasma) GLU levels are increased in MD patients,37 a meta-analysis of studies employing proton magnetic resonance spectroscopy reported reduced levels of GLU plus glutamine in MD patients.38 Thus, neurotransmission by glutaminergic neurons may play an important role in the pathophysiology of MD.39,40 However, the discrepancy between peripheral and brain GLU levels remains unexplained.
Some limitations of our study should be noted. One potential limitation is the modest sample size and absence of control subjects, which could have led to some degree of sampling bias. Moreover, although source-based morphometry (SBM), a multivariate method, considers cross-voxel information and is more robust than univariate voxel-wise approaches, this approach should be used on large datasets to increase statistical power.22,41 Additionally, the levels of other metabolites within the KYN pathway, including KYNA, QUIN, and picolinic acid, should be assessed. The lack of measurement of tryptophan levels and the consequent unavailability of metabolite ratios based on it, which could have been used as an index of IDO activity, also make it difficult to interpret the results.
In the future, we plan to perform this analysis on a larger number of patients with age- and sex-matched healthy controls and include assessment of the levels of other metabolites in the KYN pathway and calculation of adjusted ratios, to confirm our results. In conclusion, we found a positive association between serum KYN levels and the activity of the SN in first-episode, drug-naïve MD patients, which helps shed light on the etiology of MD.
Abbreviations
MD, major depression; IDO, indoleamine 2,3-dioxygenase; GLU, glutamate; 3-HK, 3-hydroxykynurenine; NMDA, N-methyl-D-aspartate; HAMD, Hamilton Rating Scale for Depression; SN, salience network; CE, central executive network; DM, default mode network; KYN, kynurenine; ACC, anterior cingulate cortex; SBM, source-based morphometry; IL-1β, interleukin-1 beta; IL-6, interleukin-6; TNF, tumor necrosis factor; KYNA, kynurenic acid; QUIN, quinolinic acid.
Ethical Approval and Informed Consent
The study protocol was approved by the Ethics Committee the University of Occupational and Environmental Health, Japan (approval number: H25-13, 8 May 2013). All the participants who entered the study signed an informed consent document explaining the study protocol and potential risks.
Acknowledgments
The authors thank Dr. Asuka Katsuki for her help with sampling data.
Funding
No author received funding to perform the present study.
Disclosure
No author has any conflicts of interest.
References
1. Malhi GS, Mann JJ. Depression. Lancet. 2018;392(10161):2299–2312. doi:10.1016/S0140-6736(18)31948-2
2. Miller AH, Raison CL. The role of inflammation in depression: from evolutionary imperative to modern treatment target. Nat Rev Immunol. 2016;16:22–34.
3. Bollen J, Trick L, Llewellyn D, Dickens C. The effects of acute inflammation on cognitive functioning and emotional processing in humans: a systematic review of experimental studies. J Psychol Res. 2017;94:47–55. doi:10.1016/j.jpsychores.2017.01.002
4. Perry VH, Nicoll JA, Holmes C. Microglia in neurodegenerative disease. Nat Rev Neurol. 2010;6(4):193–201. doi:10.1038/nrneurol.2010.17
5. Miller AH, Maletic V, Raison CL. Inflammation and its discontents: the role of cytokines in the pathophysiology of major depression. Biol Psychiatry. 2009;65(9):732–741. doi:10.1016/j.biopsych.2008.11.029
6. Goldsmith DR, Rapaport MH, Miller BJ. A meta-analysis of blood cytokine network alterations in psychiatric patients: comparisons between schizophrenia, bipolar disorder and depression. Mol Psychiatry. 2016;21(12):1696–1709. doi:10.1038/mp.2016.3
7. Ogyu K, Kubo K, Noda Y, et al. Kynurenine pathway in depression: a systematic review and meta-analysis. Neurosci Biobehav Rev. 2018;90:16–25. doi:10.1016/j.neubiorev.2018.03.023
8. Bay-Richter C, Linderholm KR, Lim CK, et al. A role for inflammatory metabolites as modulators of the glutamate N-methyl-D-aspartate receptor in depression and suicidality. Brain Behav Immun. 2015;43:110–117. doi:10.1016/j.bbi.2014.07.012
9. Dantzer R, O’Connor JC, Lawson MA, Kelley KW. Inflammation-associated depression: from serotonin to kynurenine. Psychoneuroendocrinology. 2011;36(3):426–436. doi:10.1016/j.psyneuen.2010.09.012
10. Oxenkrug GF. Metabolic syndrome, age-associated neuroendocrine disorders, and dysregulation of tryptophan—kynurenine metabolism. Ann N Y Acad Sci. 2010;1199:1–14. doi:10.1111/j.1749-6632.2009.05356.x
11. Müller N, Schwarz MJ. COX-2 inhibition in schizophrenia and major depression. Curr Pharm Des. 2008;14(14):1452–1465. doi:10.2174/138161208784480243
12. Schwarcz R, Bruno JP, Muchowski PJ, Wu HQ. Kynurenines in the mammalian brain: when physiology meets pathology. Nat Rev Neurosci. 2012;13(7):465–477.
13. Walker AK, Budac DP, Bisulco S, et al. NMDA receptor blockade by ketamine abrogates lipopolysaccharide-induced depressive-like behavior in C57BL/6J mice. Neuropsychopharmacology. 2013;38(9):1609–1616. doi:10.1038/npp.2013.71
14. Baranyi A, Meinitzer A, Breitenecker RJ, Amouzadeh-Ghadikolai O, Stauber R, Rothenhäusler HB. Quinolinic acid responses during interferon-α-induced depressive symptomatology in patients with chronic hepatitis c infection - a novel aspect for depression and inflammatory hypothesis. PLoS One. 2015;10(9):e0137022. doi:10.1371/journal.pone.0137022
15. Bonaccorso S, Marino V, Puzella A, et al. Increased depressive ratings in patients with hepatitis C receiving interferon-α-based immunotherapy are related to interferon-α -induced changes in the serotonergic system. J Clin Psychopharmacol. 2002;22(1):86–90. doi:10.1097/00004714-200202000-00014
16. Capuron L, Neurauter G, Musselman DL, et al. Interferon-alpha-induced changes in tryptophan metabolism: relationship to depression and paroxetine treatment. Biol Psychiatry. 2003;54(9):906–914. doi:10.1016/S0006-3223(03)00173-2
17. Stone TW, Perkins MN. Quinolinic acid: a potent endogenous excitant at amino acid receptors in CNS. Eur J Pharmacol. 1981;72(4):411–412. doi:10.1016/0014-2999(81)90587-2
18. Guillemin GJ, Croitoru-Lamoury J, Dormont D, Armati PJ, Brew BJ. Quinolinic acid upregulates chemokine production and chemokine receptor expression in astrocytes. Glia. 2003;41(4):371–381. doi:10.1002/glia.10175
19. Savitz J, Drevets WC, Smith CM, et al. Putative neuroprotective and neurotoxic kynurenine pathway metabolites are associated with hippocampal and amygdala volumes in subjects with major depressive disorder. Neuropsychopharmacology. 2015;40(2):463–471. doi:10.1038/npp.2014.194
20. Doolin K, Allers KA, Pleiner S, et al. Altered tryptophan catabolite concentrations in major depressive disorder and associated changes in hippocampal subfield volumes. Psychoneuroendocrinology. 2018;95:8–17. doi:10.1016/j.psyneuen.2018.05.019
21. DeWitt SJ, Bradley KA, Lin N, Yu C, Gabbay V. A pilot resting-state functional connectivity study of the kynurenine pathway in adolescents with depression and healthy controls. J Affect Disord. 2018;227:752–758. doi:10.1016/j.jad.2017.11.040
22. Dai L, Zhou H, Xu X, Zuo Z. Brain structural and functional changes in patients with major depressive disorder: a literature review. PeerJ. 2019;7:e8170. doi:10.7717/peerj.8170
23. Watanabe K, Kakeda S, Katsuki A, et al. Whole-brain structural covariance network abnormality in first-episode and drug-naïve major depressive disorder. Psychiatry Res Neuroimaging. 2020;300:111083. doi:10.1016/j.pscychresns.2020.111083
24. Okusaga O, Duncan E, Langenberg P, et al. Combined toxoplasma gondii seropositivity and high blood kynurenine—linked with nonfatal suicidal self-directed violence in patients with schizophrenia. J Psychiatr Res. 2016;72:74–81. doi:10.1016/j.jpsychires.2015.10.002
25. Kita T, Morrison PF, Heyes MP, Markey SP. Effects of systemic and central nervous system localized inflammation on the contributions of metabolic precursors to the L-kynurenine and quinolinic acid pools in brain. J Neurochem. 2002;82(2):258–268. doi:10.1046/j.1471-4159.2002.00955.x
26. Colín-González AL, Maldonado PD, Santamaría A. 3-hydroxykynurenine: an intriguing molecule exerting dual actions in the central nervous system. Neurotoxicology. 2013;34:189–204. doi:10.1016/j.neuro.2012.11.007
27. Johansson AS, Owe-Larsson B, Asp L, et al. Activation of kynurenine pathway in ex vivo fibroblasts from patients with bipolar disorder or schizophrenia: cytokine challenge increases production of 3-hydroxykynurenine. J Psychiatr Res. 2013;47(11):1815–1823. doi:10.1016/j.jpsychires.2013.08.008
28. Liu H, Ding L, Zhang H, et al. The metabolic factor kynurenic acid of kynurenine pathway predicts major depressive disorder. Front Psychiatry. 2018;9:552. doi:10.3389/fpsyt.2018.00552
29. Kakeda S, Watanabe K, Katsuki A, et al. Relationship between interleukin (IL)-6 and brain morphology in drug-naïve, first-episode major depressive disorder using surface-based morphometry. Sci Rep. 2018;8:10054. doi:10.1038/s41598-018-28300-5
30. Sugimoto K, Kakeda S, Watanabe K, et al. Relationship between white matter integrity and serum inflammatory cytokine levels in drug-naive patients with major depressive disorder: diffusion tensor imaging study using tract-based spatial statistics. Transl Psychiatry. 2018;8(1):1–8. doi:10.1038/s41398-018-0174-y
31. Menon V, Uddin LQ. Saliency, switching, attention and control: a network model of insula function. Brain Struct Funct. 2010;214(5–6):655–667. doi:10.1007/s00429-010-0262-0
32. Goulden N, Khusnulina A, Davis NJ, et al. The salience network is responsible for switching between the default mode network and the central executive network: replication from DCM. Neuroimage. 2014;99:180–190. doi:10.1016/j.neuroimage.2014.05.052
33. Admon R, Holsen LM, Aizley H, et al. Striatal hypersensitivity during stress in remitted individuals with recurrent depression. Biol Psychiatry. 2015;78(1):67–76. doi:10.1016/j.biopsych.2014.09.019
34. Admon R, Pizzagalli DA. Corticostriatal pathways contribute to the natural time course of positive mood. Nat Commun. 2015;7(6):10065. doi:10.1038/ncomms10065
35. Fu CH, Steiner H, Costafreda SG. Predictive neural biomarkers of clinical response in depression: a meta-analysis of functional and structural neuroimaging studies of pharmacological and psychological therapies. Neurobiol Dis. 2013;52:75–83. doi:10.1016/j.nbd.2012.05.008
36. Whitton AE, Webb CA, Dillon DG, et al. Pretreatment rostral anterior cingulate cortex connectivity with salience network predicts depression recovery: findings from the EMBARC randomized clinical trial. Biol Psychiatry. 2019;85(10):872–880. doi:10.1016/j.biopsych.2018.12.007
37. Inoshita M, Umehara H, Watanabe SY, et al. Elevated peripheral blood glutamate levels in major depressive disorder. Neuropsychiatr Dis Treat. 2018;14:945–953. doi:10.2147/NDT.S159855
38. Moriguchi S, Takamiya A, Noda Y, et al. Glutamatergic neurometabolite levels in major depressive disorder: a systematic review and meta-analysis of proton magnetic resonance spectroscopy studies. Mol Psychiatry. 2019;24(7):952–964. doi:10.1038/s41380-018-0252-9
39. Duman RS, Sanacora G, Krystal JH. Altered connectivity in depression: GABA and glutamate neurotransmitter deficits and reversal by novel treatments. Neuron. 2019;102(1):75–90. doi:10.1016/j.neuron.2019.03.013
40. Murrough JW, Abdallah CG, Mathew SJ. Targeting glutamate signaling in depression: progress and prospects. Nat Rev Drug Discov. 2017;16(7):472–486. doi:10.1038/nrd.2017.16
41. Xu L, Groth KM, Pearlson G, Schretlen DJ, Calhoun VD. Source-based morphometry: the use of independent component analysis to identify gray matter differences with application to schizophrenia. Hum Brain Mapp. 2009;30(3):711–724. doi:10.1002/hbm.20540
42. American Psychiatric Association. Diagnostic and Statistical Manual of Mental Disorders.
43. Hamilton M. Development of a rating scale for primary depressive illness. Br J Soc Clin Psychol. 1967;6(4):278–296. doi:10.1111/j.2044-8260.1967.tb00530.x
44. Soga T, Heiger DN. Amino acid analysis by capillary electrophoresis electrospray ionization mass spectrometry. Anal Chem. 2000;72(6):1236–1241. doi:10.1021/ac990976y
45. Soga T, Ueno Y, Naraoka H, Ohashi Y, Tomita M, Nishioka T. Simultaneous determination of anionic intermediates for Bacillus subtilis metabolic pathways by capillary electrophoresis electrospray ionization mass spectrometry. Anal Chem. 2002;74:2233–2239. doi:10.1021/ac020064n
46. Soga T, Ohashi Y, Ueno Y, Naraoka H, Tomita M, Nishioka T. Quantitative metabolome analysis using capillary electrophoresis mass spectrometry. J Proteome Res. 2003;2(5):488–494. doi:10.1021/pr034020m
47. Sugimoto M, Wong DT, Hirayama A, Soga T, Tomita M. Capillary electrophoresis mass spectrometry-based saliva metabolomics identified oral, breast and pancreatic cancer–specific profiles. Metabolomics. 2010;6(1):78–95.
48. Junker BH, Klukas C, Schreiber F. VANTED: a system for advanced data analysis and visualization in the context of biological networks. BMC Bioinform. 2006;7(1):109. doi:10.1186/1471-2105-7-109
49. Jovicich J, Czanner S, Greve D, et al. Reliability in multi-site structural MRI studies: effects of gradient non-linearity correction on phantom and human data. Neuroimage. 2006;30(2):436–443. doi:10.1016/j.neuroimage.2005.09.046
50. Sled JG, Zijdenbos AP, Evans AC. A nonparametric method for automatic correction of intensity nonuniformity in MRI data. IEEE Trans Med Imaging. 1998;17(1):87–97. doi:10.1109/42.668698
51. Kanda Y. Investigation of the freely available easy-to-use software ‘EZR’ for medical statistics. Bone Marrow Transplant. 2013;48(3):452–458.
 © 2020 The Author(s). This work is published and licensed by Dove Medical Press Limited. The full terms of this license are available at https://www.dovepress.com/terms.php and incorporate the Creative Commons Attribution - Non Commercial (unported, v3.0) License.
By accessing the work you hereby accept the Terms. Non-commercial uses of the work are permitted without any further permission from Dove Medical Press Limited, provided the work is properly attributed. For permission for commercial use of this work, please see paragraphs 4.2 and 5 of our Terms.
© 2020 The Author(s). This work is published and licensed by Dove Medical Press Limited. The full terms of this license are available at https://www.dovepress.com/terms.php and incorporate the Creative Commons Attribution - Non Commercial (unported, v3.0) License.
By accessing the work you hereby accept the Terms. Non-commercial uses of the work are permitted without any further permission from Dove Medical Press Limited, provided the work is properly attributed. For permission for commercial use of this work, please see paragraphs 4.2 and 5 of our Terms.