")
Back to Journals » Diabetes, Metabolic Syndrome and Obesity » Volume 14
Association of Serum Amylase Activity and the Copy Number Variation of AMY1/2A/2B with Metabolic Syndrome in Chinese Adults
Authors Zhan F, Chen J, Yan H, Wang S , Zhao M, Zhang S , Lan X, Maekawa M
Received 22 September 2021
Accepted for publication 16 November 2021
Published 2 December 2021 Volume 2021:14 Pages 4705—4714
DOI https://doi.org/10.2147/DMSO.S339604
Checked for plagiarism Yes
Review by Single anonymous peer review
Peer reviewer comments 5
Editor who approved publication: Professor Ming-Hui Zou
Fangjie Zhan,1 Jin Chen,1 Huihui Yan,1 Shuiliang Wang,1 Meng Zhao,1 Shenghang Zhang,1 Xiaopeng Lan,1 Masato Maekawa2
1Department of Clinical Laboratory Medicine, The 900th Hospital of Joint Logistics Support Force, Fuzhou, People’s Republic of China; 2Department of Laboratory Medicine, Hamamatsu University School of Medicine, Hamamatsu, Japan
Correspondence: Xiaopeng Lan
Department of Clinical Laboratory Medicine, The 900th Hospital of Joint Logistics Support Force, 156th, Xierhuan Road, Fuzhou, 350025, People’s Republic of China
Tel +86 591 22859482
Email [email protected]
Masato Maekawa
Department of Laboratory Medicine, Hamamatsu University School of Medicine, 1-20-1, Handayama, Higashi-ku, Hamamatsu, 431-3192, Japan
Tel +81-53-435-2721
Fax +81-53-435-2096
Email [email protected]
Purpose: Low serum amylase activity and copy number (CN) variation (CNV) of the salivary amylase gene (AMY1) are reportedly associated with obesity and abnormal glucose metabolism; however, this association remains controversial. We aimed to clarify the relationship between serum amylase activity and the CNV of AMY1/2A/2B with the occurrence of metabolic syndrome (MetS) in Chinese adults.
Patients and Methods: Anthropometry, metabolic risk factors, and serum amylase activity were assessed in 560 subjects (260 MetS patients; 300 healthy controls). AMY1/2A/2B CNs were evaluated using the highly sensitive droplet digital PCR.
Results: The serum total, pancreatic, and salivary amylase activity, but not the AMY1/2A/2B CNs, was significantly lower in MetS patients than that in the control subjects. Patients < 45 y had a lower AMY1 CN, compared to that in healthy controls. Low serum amylase activity was significantly associated with high MetS prevalence (p < 0.001). In the receiver operating characteristic curve analysis, serum amylase activity was a significant diagnostic indicator for MetS. The diagnostic value of total amylase was second only to that of γ-glutamyl transpeptidase; it was higher than that of alanine aminotransferase and uric acid.
Conclusion: Low serum amylase activity was significantly associated with increased risk of MetS in Chinese adults. Therefore, amylase could be a potential biomarker for predicting MetS.
Keywords: amylase, copy number variation, metabolic disorders, biomarker, Chinese population
Introduction
Metabolic syndrome (MetS) refers to the disorders in the metabolism of proteins, fats, carbohydrates, and other substances. It is a group of complex disorders, including obesity, hyperglycemia, hypertension, dyslipidemia, high blood viscosity, high uric acid, high incidence of fatty liver, and hyperinsulinemia.1 It is the pathological basis of cardiovascular diseases, cerebrovascular diseases, and diabetes. MetS is one of the critical global health and economic challenges.2–10
Human amylases are encoded by multiple genes; they are broadly divided into salivary (AMY1A, AMY1B, and AMY1C) and pancreatic (AMY2A and AMY2B) amylase genes.11,12 The copy number (CN) variation (CNV) is widespread in human amylase genes;11,13 the CNs of AMY1, AMY2A, and AMY2B range from 1−27,14 0−8, and 2−6,15,16 respectively. Most haplotypes contain odd numbers of AMY1 repeat units; the even number repeats of AMY1 are associated with rearrangements, resulting in CNVs in AMY2A/2B.17,18 The high sequence identity between AMY1 and AMY2 makes resolving these CNVs extremely difficult, and the relationship between AMY2 and AMY1 variation has not been clearly characterized.17
MetS has a common pathological basis; it is commonly attributed to insulin resistance caused by obesity, especially central obesity. The relationship between the CNV of amylase genes and body mass index (BMI), obesity, diabetes, and MetS have been investigated. There is a positive association between the CNVs of AMY1/AMY2A and their corresponding serum enzyme activities.19 However, there is a strong negative correlation between the CNV of AMY1 and BMI, obesity,20–24 and insulin resistance.25,26 Individuals with higher amylase levels have faster and more substantial postprandial blood glucose responses following starch ingestion, and significantly higher postprandial insulin concentrations than those with low amylase levels.26 This may be related to cephalic phase insulin release (CPIR), which is an anticipatory response to eating26,27 and occurs within the first few minutes of food ingestion.28,29 CPIR is essential for maintaining normal glucose tolerance29,30 and it helps prevent dysglycemia and dyslipidemia.31 Obesity, hyperlipidemia, and diabetes are influenced by genetic and environmental factors; obesity is a major risk factor for diabetes and hyperlipidemia.32,33 The aforementioned metabolic disorders are mutually causal; they have the same risk factors, biochemical abnormalities, and clinical complications;33 therefore, it is necessary to consider and analyze them comprehensively.
In contrast, the CNV of AMY1 plays a limited role in modulating salivary amylase expression.18 Other studies using methods such as quantitative PCR and droplet digital PCR (ddPCR) showed no association between the CNV of amylase genes and BMI.11,14,16,19,34,35 The CNVs of AMY1 are not associated with glucose metabolism in overweight or obese adults.36 There is no association between salivary amylase activity or the CNV of AMY1 and postprandial glycemic responses following the ingestion of a starch-rich meal in Asian participants.37 However, the CNV of AMY1 correlates with glucose uptake and visceral fat volume, but not with insulin resistance.38 Therefore, the relationship between amylase activity or the CNVs of amylase genes and various metabolic abnormalities remains controversial.
Considering the global health challenges owing to non-communicable diseases such as cardiovascular diseases, cerebrovascular diseases, and diabetes caused by MetS, it is necessary to explore the relationship between MetS and amylase. The potential of the CNVs of amylase genes and the serum enzyme activity as biomarkers for MetS in the Chinese population required further assessment. In cases where the pathogenesis is unclear, a more comprehensive understanding of the causes and the underlying pathology of MetS is necessary, especially in high-risk groups, where the prognosis and treatment could be improved. This study further clarified the relationship between amylase and MetS in Chinese adults.
Materials and Methods
Study Sample Set
The study participants underwent thorough medical checkups (from September 2018 to March 2021) at the 900th Hospital of the Joint Logistics Support Force in Fuzhou, China. The study included 560 participants (260 MetS and 300 healthy controls), who were 19–87 y old. The MetS diagnosis was based on the diagnostic criteria formulated by Chinese Diabetes Society (CDS) in 2004;39 it was based on the confirmation of three or more of the following four components: (a) overweight or obesity: BMI ≥ 25.0 kg/m2; (b) hyperglycemia: fasting plasma glucose (FPG) ≥ 6.1 mmol/L and/or 2h PG ≥ 7.8 mmol/L and/or were diagnosed with diabetes and treated; (c) hypertension: systolic blood pressure (SBP)/diastolic blood pressure (DBP) ≥ 140/90 mmHg and/or have been diagnosed with hypertension and treated; (d) abnormal blood lipid profile:triglycerides (TG) > 1.7 mmol/L and/or high density lipoprotein cholesterol (HDL-C) < 0.9 mmol/L in males or <1.0 mmol/L in females. Participants with COVID-19 infection, kidney dysfunction, malignant tumors, salivary gland and pancreatic disease, pneumonia, craniocerebral trauma, and dehydration were excluded. This study was performed in accordance with the Declaration of Helsinki, strictly followed all ethical guidelines and protected personal information of the participants; informed consent was obtained from all participants. The protocol was approved by the Academic Ethics Committee of the 900th Hospital of the Joint Logistics Support Force (acceptance number: SC-2018-019).
Anthropometric and Laboratory Measurements
Anthropometric measurements were performed according to the WHO recommendations. BMI was calculated as weight/height (kg/m2). Blood tests were conducted following an overnight fast, using an auto Roche/Hitachi cobas c702 (Hoffman–La Roche, Basel, Switzerland). Serum total and pancreatic amylase (U/L), FPG (mmol/L), total cholesterol (TC; mmol/L), HDL-C; (mmol/L), low-density lipoprotein cholesterol (LDL-C; mmol/L), TG (mmol/L), uric acid (μmol/L), γ-glutamyl transpeptidase (GGT; U/L), and alanine aminotransferase (ALT, U/L) levels were measured. Serum salivary amylase activity was obtained by subtracting the pancreatic amylase activity from the total amylase activity.19 The mean intra- and inter-assay CVs were 1.8% and 2.4%, respectively.
DNA Extraction and Estimation of the CNs of AMY1/2A/2B Using ddPCR
DNA was purified from whole blood using the Gentra Puregene Blood Kit (QIAGEN Sciences, Germantown, MD, USA). The DNA concentration was measured using an ultramicro-spectrophotometer SMA4000 (Merinton Instrument, Inc., Beijing, China). DNA purity was assessed based on the 260:280 nm absorbance ratio. Unfortunately, the whole blood samples were not available for all the subjects; therefore, DNA was extracted only from 311 independent individuals (122 patients and 189 healthy subjects). CN was detected using ddPCR, employing the QX200 system (Bio-Rad Laboratories, Hercules, CA, USA), according to the manufacturer’s instructions.19,22,24 The primers and probes used were specific to the target genes AMY1, AMY2A, and AMY2B and the reference gene TP53 (Supplementary Table 1). Briefly, each duplex reaction of 20 μL comprised 10 μL of ddPCR Supermix for probes (no UTP) (Bio-Rad Laboratories), 1.8 μL of each primer (10 μM), and a 0.5 μL probe (10 μM); the reaction mixture with a final concentration of 10 ng/μL DNA was added to a droplet generation cartridge. Droplet generation oil (70 μL) was added, and the gasket was covered and placed in the QX200 Droplet Generator to generate droplets. PCR amplification was performed in T100 (Bio-Rad Laboratories) under the amplification conditions of pre-denaturation at 95 °C for 10 min, 40 cycles of 94 °C for 30 s and 60 °C for 60 s, and 98 °C for 10 min.24 The amplification reactions were stored at 4 °C until the droplets were analyzed using a QX200 Droplet Reader. The samples were analyzed in triplicate. CN estimation was performed using the calibrator DNA sample NA10851 (Coriell Cell Repositories, Camden, NJ, USA), which has six copies of AMY1 and two copies of AMY2.11
Randomization of Experimental Operation Process
Throughout the study, all samples (cases and controls) received the same work processes; they were randomized in all laboratory processes to avoid systematic bias, difference error, and batch effect.11
Statistical Analyses
Statistical analyses were performed using SPSS Statistics for Windows, version 22.0 (IBM Corp., Armonk, NY, USA). The data were expressed as the mean ± standard deviation (SD) or median (range). The clinical variables expressed as mean ± SD were compared using a t-test to evaluate the differences between the cases and controls. Differences in sex were determined using the chi-squared test, and that in TG levels were determined using the Mann–Whitney U-test. Pearson’s linear correlation analysis was used to examine the correlation between serum amylase activity, CN of amylase genes, and clinical variables. Logistic regression was used to analyze the association between low amylase activity, CN of amylase genes, and MetS. The logistic regression analyses were adjusted for age, sex, and BMI in model 2, which did not include the main syndrome components, such as blood pressure, lipids, and fasting glucose, to avoid over- or underestimating the associations, as described previously.40,41 Receiver operating characteristic (ROC) curve analyses were used to evaluate the diagnostic and cut-off values of amylase for MetS. The CN estimate data of the amylase genes were rounded to the nearest integer. A two-tailed p-value < 0.05 was considered significant.
Results
Characteristics of the Study Population
The clinical characteristics of the subjects are presented in Table 1. All clinical characteristics of the healthy controls were within normal ranges. The diagnosis of MetS in patients was based on the CDS criteria. Excluding sex and the CN of AMY1/2A/2B, all other clinical variables were significantly different between the patient and control groups (p < 0.001). The SBP, DBP, BMI, FPG, TG, TC, and LDL-C levels in the healthy group were lower than that in the patient group. In contrast, the HDL-C, total (T-AMY), pancreatic (P-AMY), and salivary amylase (S-AMY) activity were higher in the healthy group, compared to that in the patient group.
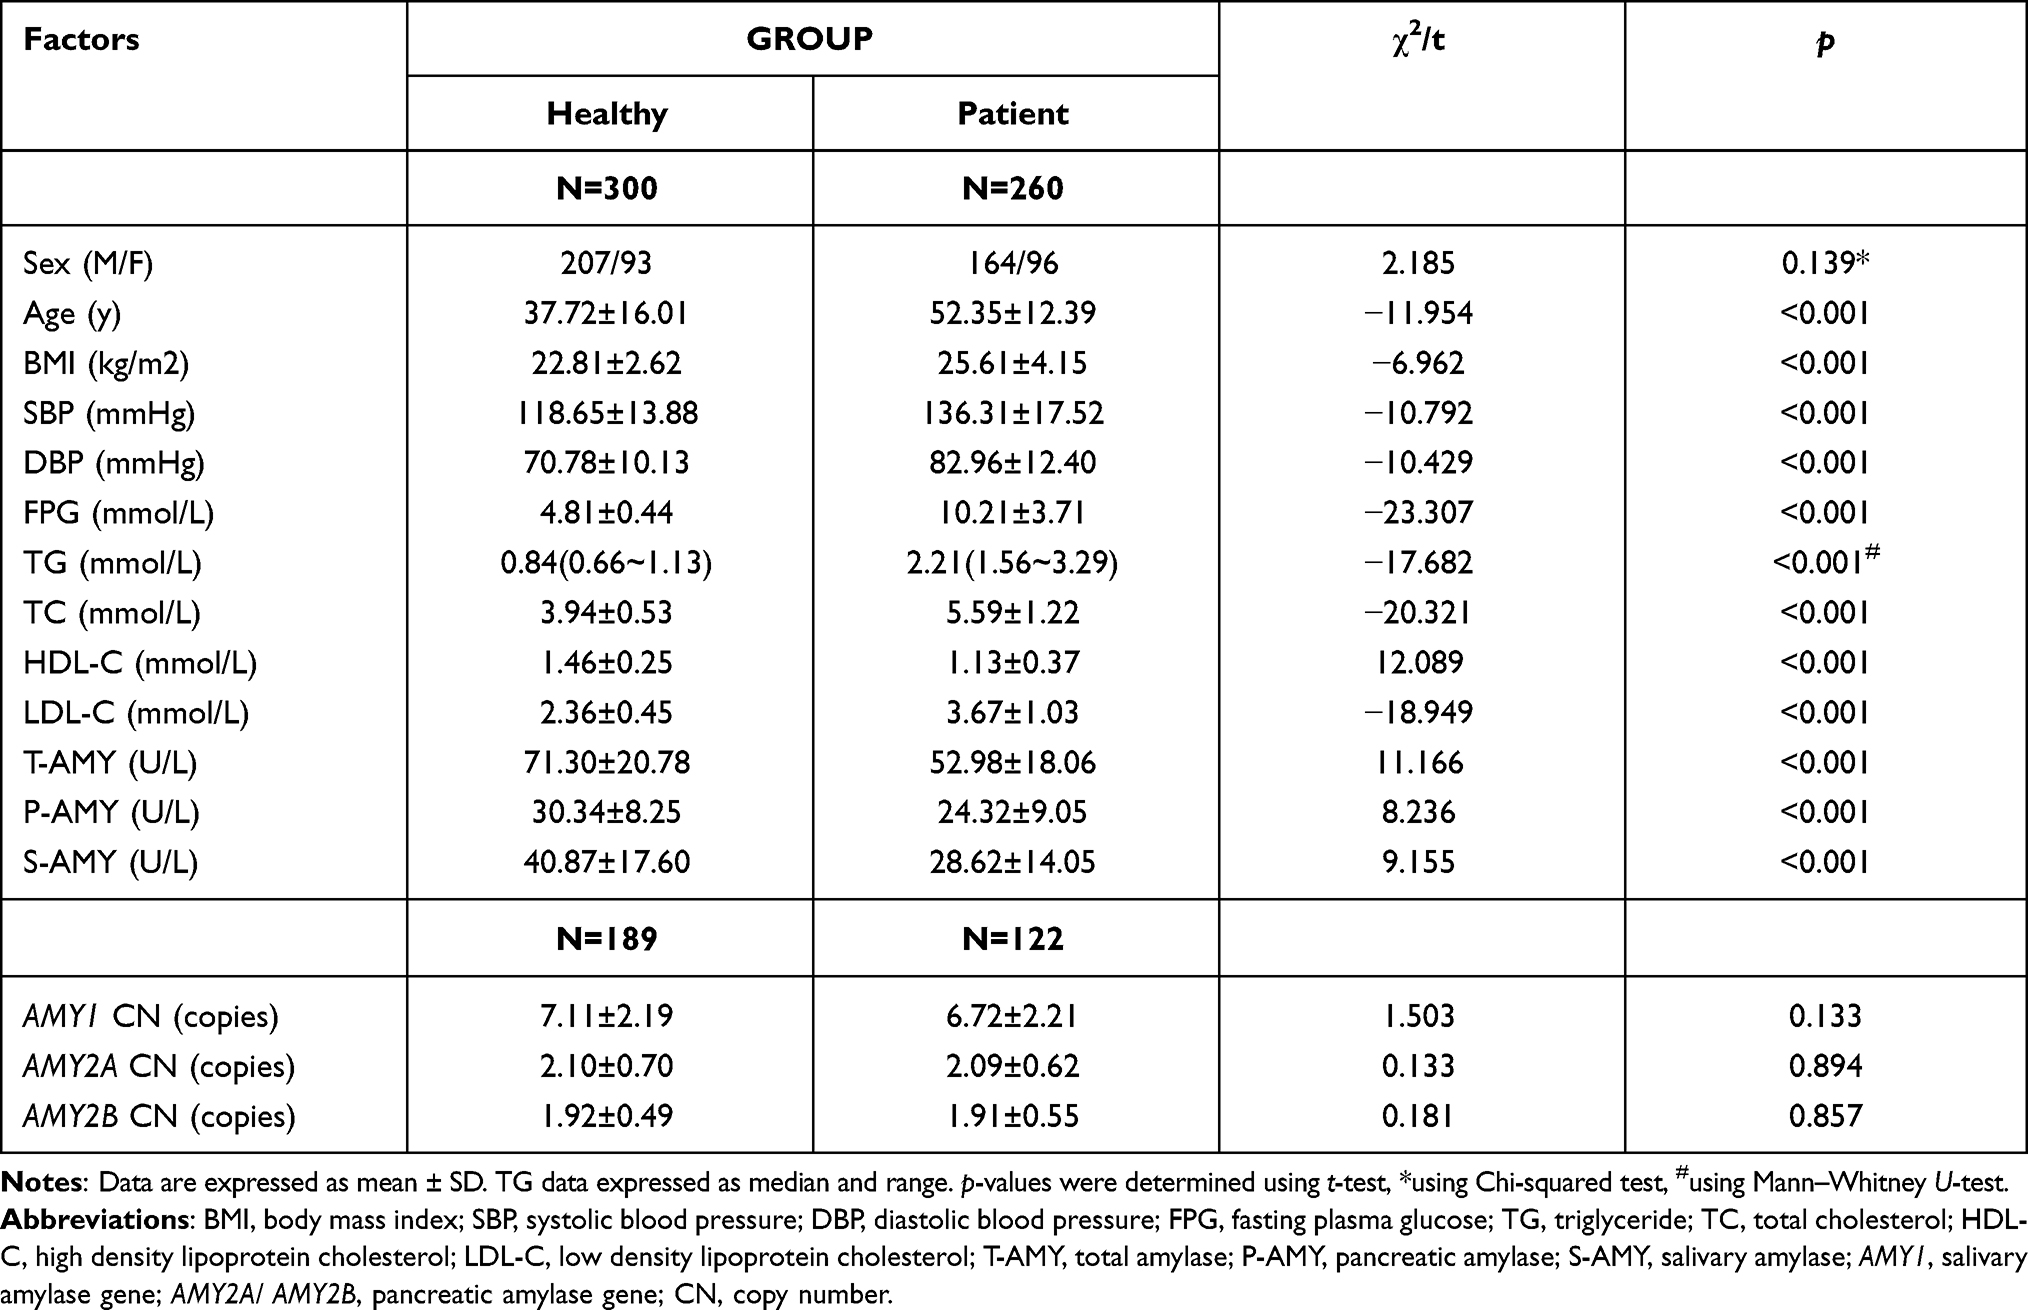 |
Table 1 Clinical Characteristics of the Study Participants |
The correlation between amylase activity and CNs of the AMY1/2A/2B genes and the different parameters are shown in Table 2. Excluding age, all other correlations between the amylase activity and the other parameters were statistically significant. However, only the CN of AMY1 correlated significantly with BMI and TG (r = −0.131 and −0.120, respectively; p < 0.05). The activity of T-AMY, P-AMY, and S-AMY were negatively correlated with BMI (r =−0.234, −0.170 and −0.200, respectively; p < 0.01), FPG (r = −0.375, −0.306 and −0.310, respectively; p < 0.01), TC (r = −0.318, −0.279 and −0.248, respectively; p < 0.01), and LDL-C (r = −0.311, −0.257 and −0.252, respectively; p < 0.01) levels. However, the HDL-C level was positively correlated with the activity of T-AMY, P-AMY, and S-AMY (r =0.287, 0.139 and 0.289, respectively; p < 0.01).
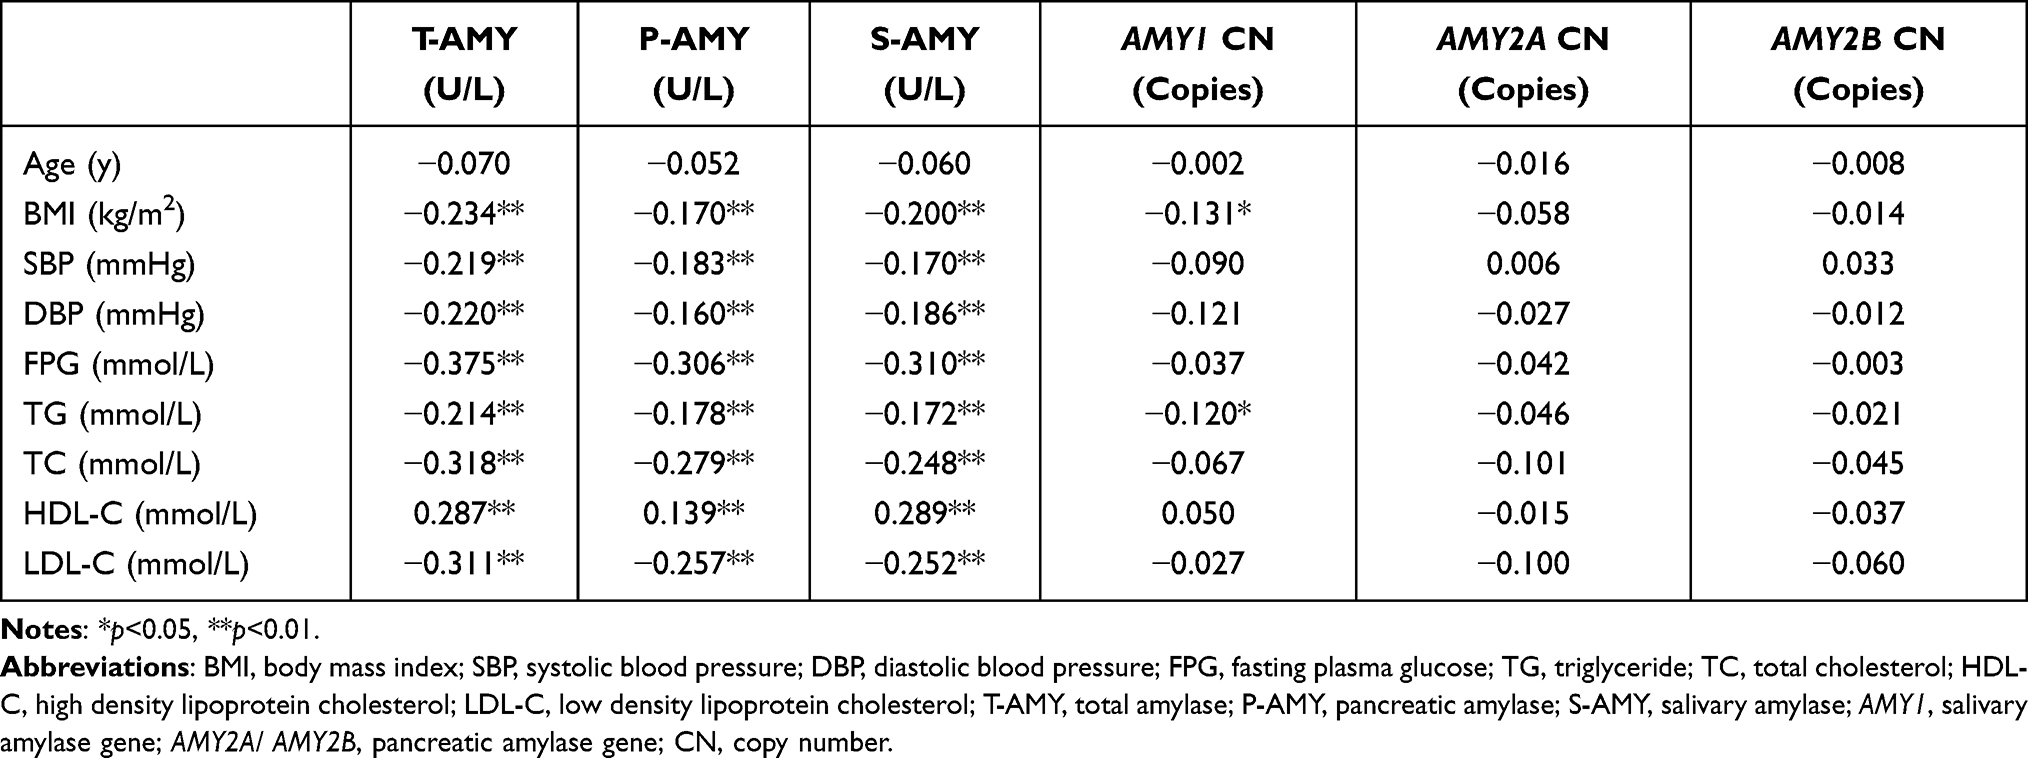 |
Table 2 Correlation Coefficients Between the Study Parameters |
Correlation Between Serum T-, S-, and P-AMY Activity and MetS
The serum T-AMY, P-AMY, and S-AMY activity were significantly lower in MetS patients, compared to that in the control subjects (52.98 ± 18.06 vs 71.30 ± 20.78, 24.32 ± 9.05 vs 30.34 ± 8.25, and 28.62 ± 14.05 vs 40.87 ± 17.60, respectively; p < 0.001). In the ROC curve analysis, the best cut-off values of the serum T-AMY, S-AMY, and P-AMY activity for identifying the prevalence of MetS were 58 U/L, 32 U/L, and 23 U/L, respectively, with a sensitivity of 71.33%, 65.10%, and 81.33%, respectively; the specificities were 68.85%, 71.92%, and 54.62%, respectively (Table 3). The areas under the ROC curves (AUC) for the T-, S-, and P-AMY activity were 0.766 (95% CI 0.726–0.805; p < 0.001), 0.725 (95% CI 0.683–0.767; p < 0.001), and 0.724 (95% CI 0.681–0.767; p < 0.001), respectively. The ROC curves of other biomarkers used for the diagnosis of MetS are shown in Figure 1. The AUCs of all the biomarkers, except for the general diagnostic value of uric acid (AUC 0.594, 95% CI 0.546–0.642; p < 0.001), were more than 0.7, indicating good diagnostic value for MetS. The diagnostic value of T-AMY for MetS was higher than that of uric acid and ALT (AUC 0.736, 95% CI 0.694–0.778; p < 0.001), but lower than that of GGT (AUC 0.843, 95% CI 0.810–0.876; p < 0.001). In the logistic regression analysis (Table 4), individuals with serum T-, P-, and S-AMY activity lower than the cut-off values (≤58, 23, and 32 U/L, respectively) were at a significantly higher risk for MetS than those with serum amylase activity higher than the cut-off value. (T-AMY: OR 5.499; 95% CI 3.826–7.903, p < 0.001; P-AMY: OR 2.773, 95% CI 1.890–4.068, p < 0.001; S-AMY: OR 3.991, 95% CI 2.753–5.783, p < 0.001; Model 1). Even after adjusting for age, sex, and BMI, low serum amylase activity were significantly associated with an increased prevalence of MetS (T-AMY: OR 6.642; 95% CI 4.350–10.143, p < 0.001; P-AMY: OR 3.598, 95% CI 2.303–5.622, p < 0.001; S-AMY: OR 4.231, 95% CI 2.756–6.494, p < 0.001; Model 2).
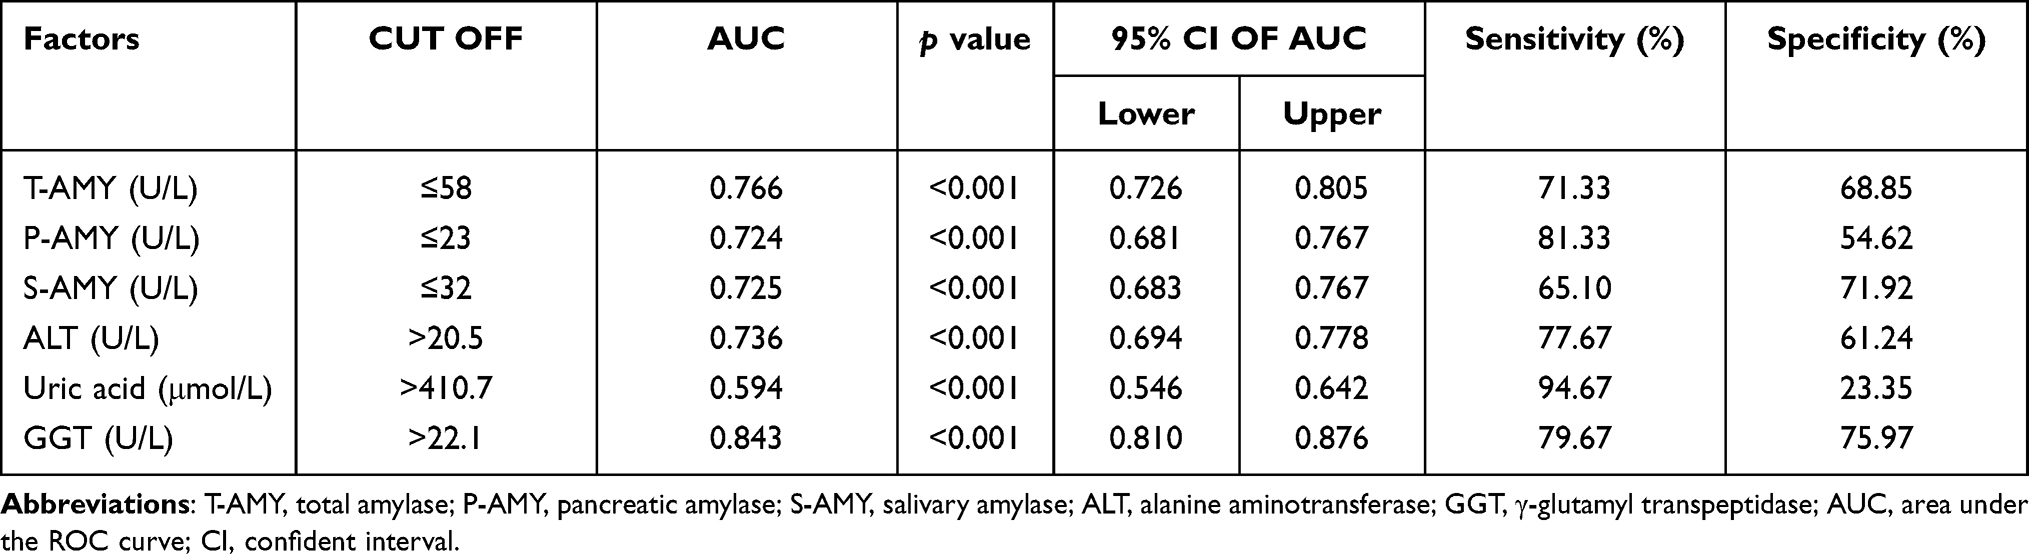 |
Table 3 Receiver Operating Characteristic (ROC) Curve Analyses to Compare the Diagnostic Value of Amylase and Other Biomarkers for MetS |
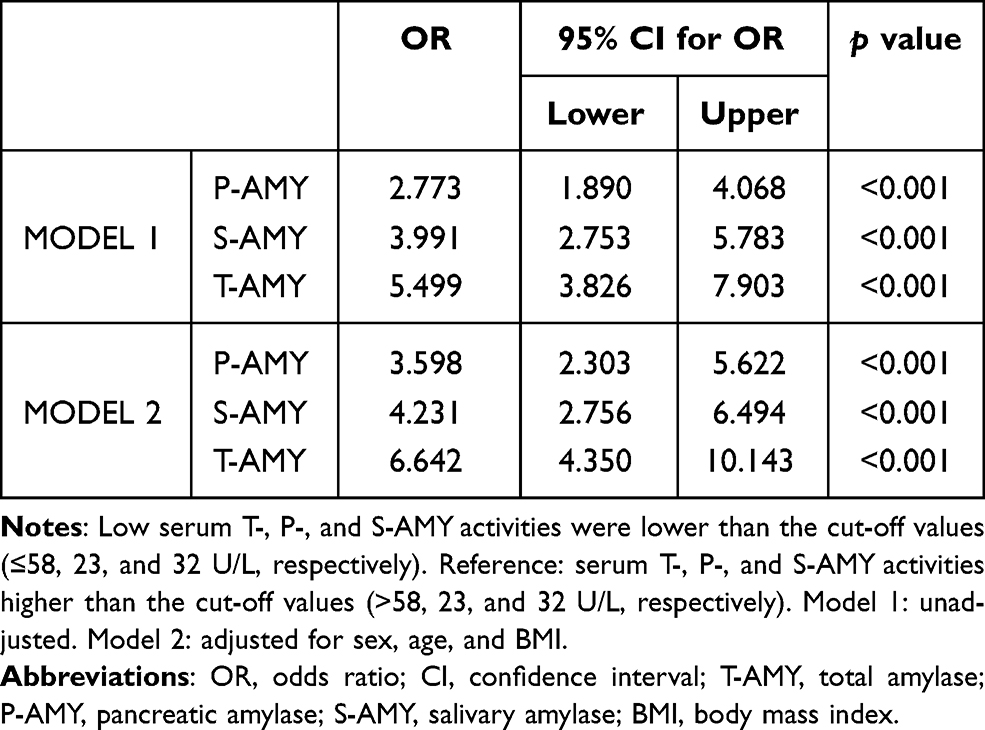 |
Table 4 Logistic Regression Analysis of MetS and Low Total, Pancreatic, and Salivary Amylase Activity |
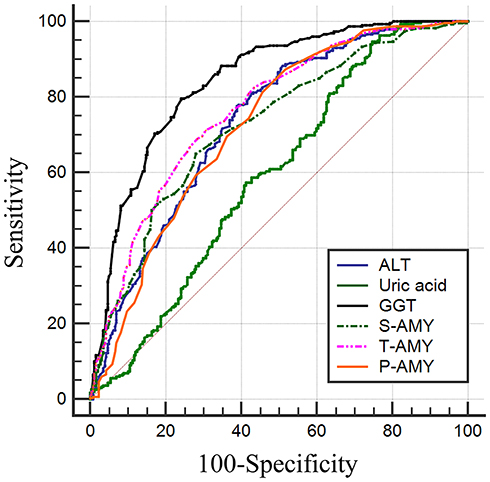 |
Figure 1 Receiver operating characteristic (ROC) curve analyses were used to evaluate the diagnostic value of amylase for MetS. ROC curve analyses the diagnostic value of serum total amylase, serum salivary amylase, and pancreatic amylase (T-, S-, P-AMY) and other markers for MetS. |
Association of the CNs of AMY1/AMY2A/AMY2B with Serum Enzyme Activity and MetS
We estimated the CNV of AMY1/2A/2B genes for 311 independent individuals (122 patients and 189 healthy subjects). The AMY1 CN ranged from 1−15, and the CN ranges of AMY2A and AMY2B were 1–5 and 1–3, respectively (Supplementary Figure 1). The CNs of AMY1/2A/2B were positively correlated with their corresponding serum amylase activity (r = 0.360, 0.232, 0.216, respectively; p < 0.001) (Supplementary Figure 2). However, the CNs of AMY1/2A/2B were not different between the patients and the healthy controls (Table 1). Although the CN of AMY1 was lower in the MetS patient group, the difference was not statistically significant (7.11 ± 2.19 vs 6.72 ± 2.21; p > 0.05). Similar non-significant results were observed in the logistic regression analysis for the association between the CNs of AMY1/2A/2B and the risk of MetS (p > 0.05) (Supplementary Table 2).
Relationship Between the CNs of AMY1/AMY2A/AMY2B and MetS in Different Age Groups
Subjects were divided into two groups according to their age: <45 y and ≥45 y. In the <45-y group, only the CN of AMY1 was significantly lower in MetS patients, compared to that in the healthy controls (p = 0.029); however, the CNs of AMY2A/AMY2B were not (p > 0.05) (Figure 2 and Supplementary Table 3). In the ≥45-y group, there was no significant difference in the CNs of the amylase genes between the patients and healthy controls; this was true even for the CN of AMY1 (p > 0.05).
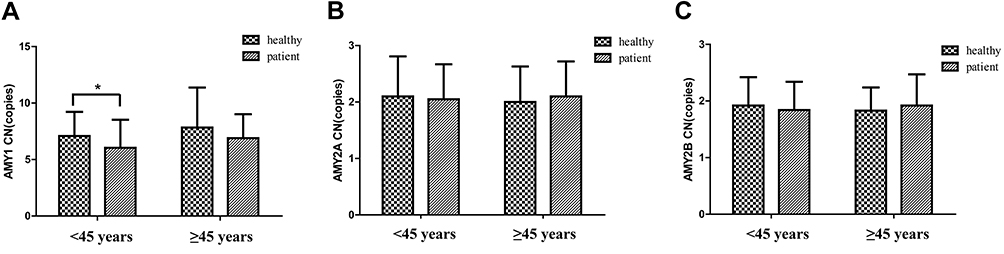 |
Figure 2 Mean AMY1/2A/2B gene copy number (CN) in different age groups. (A) The mean AMY1 gene CNs were compared between patients and healthy controls in different age groups (age <45 y and ≥45 y); (B) CNs of genes AMY2A and (C) AMY2B were compared between patients and healthy controls in different age groups (age <45 y and ≥45 y). The Asterisk indicates a significant difference (p < 0.05). |
Discussion
MetS is a disorder of energy utilization and storage. It is characterized by central obesity, dyslipidemia, elevated blood pressure, and high glucose levels. There are several additional contributing factors such as decreased physical activity, genetic predisposition, chronic inflammation, level of free fatty acids, and mitochondrial dysfunction.
In this study, the correlation between the serum T-, S-, and P-AMY activity, the CNs of AMY1, AMY2A, and AMY2B, and other metabolic risk factors were analyzed (Table 2). The amylase activity and AMY1 CN were negatively correlated with BMI, which corroborates the results from earlier studies.19,22 A lack of CPIR leads to high postprandial glucose levels and impaired glucose tolerance, which results in insulin resistance.26,42 Individuals with low salivary amylase group do not exhibit CPIR in response to starch intake; thus, it had a high glycemic response.26 In addition, low serum amylase activity is associated with low insulin secretion and serum levels, along with high insulin resistance.43 This may explain the relationship between low amylase activity and hyperglycemia in this study. Therefore, in patients with low amylase activity, may improve postprandial insulin release through targeted therapy. Furthermore, serum amylase activity were positively correlated with HDL-C levels and negatively correlated with TG, TC, and LDL-C levels; whereas the CN of AMY1 was negatively correlated with TG levels. Low HDL-C is associated with insulin resistance and high risk of MetS.44 Compared to the individuals with high amylase activity, those with low amylase activity had lower levels of long- and medium-chain fatty acids and higher levels of dicarboxylic fatty acids and 2-hydroxybutyrate,45 which is an established biomarker of glucose malabsorption and insulin resistance.46 Insulin resistance could increase the synthesis and secretion of very-low-density lipoprotein (VLDL) and TG in the liver, and reduce clearance, resulting in hyperlipidemia. Amylase could have beneficial metabolic effects in obesity, diabetes, and hyperlipidemia; it could provide a new direction for the prevention and treatment of these metabolic abnormalities (Supplementary Figure 3).
There was a positive association between the CNs of AMY1/AMY2A/AMY2B and their corresponding serum amylase activity. The serum T-, S-, and P-AMY activities were significantly lower in the MetS group than that in the healthy control group; this was not observed for the CN of amylase genes. As indicated by Carpenter,18 the CN of AMY1 does not explain most of the observed variations in the expression and activity between individuals. This could be because the serum amylase activity is dependent not only on the CNV of the genes, but also on the epigenetic background, the diet of the individual, and environmental factors, including exercise, stress, and circadian rhythms.47,48 In addition, there is considerable heterogeneity in the CNV of the amylase gene in people from different locations and from specific populations, varying with the racial and genetic backgrounds.47,49
The odds ratios of MetS were examined using logistic regression analyses. Low serum amylase activity was significantly associated with the prevalence of MetS in Chinese adults. Both the S- and P-AMY activity influenced the decrease in the serum T-AMY activity. The low T-, P-, and S-AMY activity were correlated with an increased risk of MetS; however, the correlation with the serum T-AMY activity is more significant and has comprehensive effects than that of P- and S-AMY activity. When the serum T-AMY activity was lower than the best cut-off value of 58 U/L, the risk of MetS increased six-fold. This could be attributed to the exocrine-endocrine relationship in the pancreas.50 Insulin resistance and/or diminished insulin secretion resulting in insufficient insulin function is a common etiology in obesity, diabetes, and MetS.51 In addition, insulin plays an important role in the production of pancreatic amylase;52 patients with very low serum insulin levels have reduced serum amylase activity, and insulin resistance prevents the enhancement of amylase synthesis by insulin, resulting in lower amylase activity.53 The amylase-insulin axis affects each other’s secretion; however, the causal relationships need to be elucidated. In addition to the MetS diagnostic criteria, there are other biomarkers, such as GGT, ALT, and uric acid.41 In the ROC curve analysis, the diagnostic value of amylase and other biomarkers for MetS were compared, and the serum T-AMY activity was a significant diagnostic indicator for MetS. Recent research shows that salivary amylase increases significantly after dietary treatment (very low-calorie ketogenic diet), which has a positive effect on salivary amylase.54 Therefore, according to the serum T-AMY activity, personalized carbohydrate diets could help prevent MetS.
The CN of AMY1 was significantly lower in the <45 y group, but not in the ≥45 y group, compared to that in the healthy control group. However, there were no differences in the CNs of AMY2A and AMY2B between both groups, which corroborate earlier results;22 perhaps because the CNV range of AMY1 was wider than the other two genes. The genetic influence on amylase expression was more pronounced in the younger population than that in the older population, because the interaction between the genes and the environment varies with age.12,22 Genetically determined salivary and pancreatic amylase activities could influence the occurrence of MetS; however, this effect could be diluted by environmental factors and the epigenetic background during the course of life. Furthermore, low AMY1/2A/2B CN and amylase activity were also present in young people of the healthy control group; however, the possibility of MetS development in this group, with increasing age or based on the diet, environment, or other factors, is unknown. We will continue to monitor these individuals for potential MetS development; the risk of various other metabolic abnormalities could increase with age in these individuals. Therefore, it is suggested that such individuals should control their starch intake, manage their body weight, and develop a healthy lifestyle for preventing MetS.
This study has its limitations. Dietary habits, environmental factors, and socio-economic status may influence the CNs of amylase genes; however, these factors were not considered. The subjects’ drug use was not considered; this could be a potential factor influencing amylase activity. In addition, the small sample size could have influenced the results. Therefore, caution should be exercised when interpreting the results.
Conclusions
High serum T-, P-, and S- amylase activities, but not the CNs of AMY1/AMY2A/AMY2B, had potential positive benefits against MetS. In young individuals with low amylase activity and AMY1 CNs, the risk of various metabolic abnormalities could increase; amylase activity could be a biomarker for predicting and monitoring the occurrence of MetS. Moreover, amylase may provide a new direction for the prevention and treatment of obesity, diabetes, and MetS.
Further studies with larger sample sizes, with more clinical information on hyperlipidemia and diabetes, and those including patients with other metabolic disorders, are required to validate the results from this study.
Acknowledgments
We would like to thank Xiaomin Feng, Shaoling Huang, and other colleagues of the Clinical Laboratory Department of the 900th Hospital of the Joint Logistics Support Force for their assistance and support to this study. We thank Shaokai Lin for the assistance in data analysis. We are also grateful to all the participants in the study.
Funding
This work was supported by a postdoctoral grant from the 900th Hospital of the Joint Logistics Support Force [Grant number 45793].
Disclosure
The authors declare no conflict of interest.
References
1. Wang HH, Lee DK, Liu M, Portincasa P, Wang DQ. Novel insights into the pathogenesis and management of the metabolic syndrome. Pediatr Gastroenterol Hepatol Nutr. 2020;23(3):189–230. doi:10.5223/pghn.2020.23.3.189
2. Beltran-Sanchez H, Harhay MO, Harhay MM, McElligott S. Prevalence and trends of metabolic syndrome in the adult U.S. population, 1999–2010. J Am Coll Cardiol. 2013;62(8):697–703. doi:10.1016/j.jacc.2013.05.064
3. Shin D, Kongpakpaisarn K, Bohra C. Trends in the prevalence of metabolic syndrome and its components in the United States 2007–2014. Int J Cardiol. 2018;259:216–219. doi:10.1016/j.ijcard.2018.01.139
4. Kastorini CM, Panagiotakos DB, Georgousopoulou EN, et al. Metabolic syndrome and 10-year cardiovascular disease incidence: the ATTICA study. Nutr Metab Cardiovasc Dis. 2016;26(3):223–231. doi:10.1016/j.numecd.2015.12.010
5. Pucci G, Alcidi R, Tap L, Battista F, Mattace-Raso F, Schillaci G. Sex- and gender-related prevalence, cardiovascular risk and therapeutic approach in metabolic syndrome: a review of the literature. Pharmacol Res. 2017;120:34–42. doi:10.1016/j.phrs.2017.03.008
6. He Y, Li Y, Bai G, et al. Prevalence of metabolic syndrome and individual metabolic abnormalities in China, 2002–2012. Asia Pac J Clin Nutr. 2019;28(3):621–633. doi:10.6133/apjcn.201909_28(3).0023
7. Prasad DS, Kabir Z, Dash AK, Das BC. Prevalence and risk factors for metabolic syndrome in Asian Indians: a community study from urban Eastern India. J Cardiovasc Dis Res. 2012;3(3):204–211. doi:10.4103/0975-3583.98895
8. Katulanda P, Ranasinghe P, Jayawardana R, Sheriff R, Matthews DR. Metabolic syndrome among Sri Lankan adults: prevalence, patterns and correlates. Diabetol Metab Syndr. 2012;4(1):24. doi:10.1186/1758-5996-4-24
9. Huh JH, Kang DR, Jang JY, et al. Metabolic syndrome epidemic among Korean adults: korean survey of Cardiometabolic Syndrome (2018). Atherosclerosis. 2018;277:47–52. doi:10.1016/j.atherosclerosis.2018.08.003
10. Vishram JK, Borglykke A, Andreasen AH, et al. Impact of age and gender on the prevalence and prognostic importance of the metabolic syndrome and its components in Europeans. The MORGAM Prospective Cohort Project. PLoS One. 2014;9(9):e107294. doi:10.1371/journal.pone.0107294
11. Yong RY, Mustaffa SB, Wasan PS, et al. Complex Copy Number Variation of AMY1 does not Associate with Obesity in two East Asian Cohorts. Hum Mutat. 2016;37(7):669–678. doi:10.1002/humu.22996
12. Elder PJD, Ramsden DB, Burnett D, Weickert MO, Barber TM. Human amylase gene copy number variation as a determinant of metabolic state. Expert Rev Endocrinol Metab. 2018;13(4):193–205. doi:10.1080/17446651.2018.1499466
13. Perry GH, Dominy NJ, Claw KG, et al. Diet and the evolution of human amylase gene copy number variation. Nat Genet. 2007;39(10):1256–1260. doi:10.1038/ng2123
14. Fernandez CI, Wiley AS. Rethinking the starch digestion hypothesis for AMY1 copy number variation in humans. Am J Phys Anthropol. 2017;163(4):645–657. doi:10.1002/ajpa.23237
15. Groot PC, Mager WH, Frants RR. Interpretation of polymorphic DNA patterns in the human alpha-amylase multigene family. Genomics. 1991;10(3):779–785. doi:10.1016/0888-7543(91)90463-O
16. Usher CL, Handsaker RE, Esko T, et al. Structural forms of the human amylase locus and their relationships to SNPs, haplotypes and obesity. Nat Genet. 2015;47(8):921–925. doi:10.1038/ng.3340
17. Carpenter D, Dhar S, Mitchell LM, et al. Obesity, starch digestion and amylase: association between copy number variants at human salivary (AMY1) and pancreatic (AMY2) amylase genes. Hum Mol Genet. 2015;24(12):3472–3480. doi:10.1093/hmg/ddv098
18. Carpenter D, Mitchell LM, Armour JA. Copy number variation of human AMY1 is a minor contributor to variation in salivary amylase expression and activity. Hum Genomics. 2017;11(1):2. doi:10.1186/s40246-017-0097-3
19. Vazquez-Moreno M, Mejia-Benitez A, Sharma T, et al. Association of AMY1A/AMY2A copy numbers and AMY1/AMY2 serum enzymatic activity with obesity in Mexican children. Pediatr Obes. 2020;15(8):e12641. doi:10.1111/ijpo.12641
20. Falchi M, El-Sayed Moustafa JS, Takousis P, et al. Low copy number of the salivary amylase gene predisposes to obesity. Nat Genet. 2014;46(5):492–497. doi:10.1038/ng.2939
21. Marcovecchio ML, Florio R, Verginelli F, et al. Low AMY1 Gene Copy Number Is Associated with Increased Body Mass Index in Prepubertal Boys. PLoS One. 2016;11(5):e0154961. doi:10.1371/journal.pone.0154961
22. Bonnefond A, Yengo L, Dechaume A, et al. Relationship between salivary/pancreatic amylase and body mass index: a systems biology approach. BMC Med. 2017;15(1):37. doi:10.1186/s12916-017-0784-x
23. Mejia-Benitez MA, Bonnefond A, Yengo L, et al. Beneficial effect of a high number of copies of salivary amylase AMY1 gene on obesity risk in Mexican children. Diabetologia. 2015;58(2):290–294. doi:10.1007/s00125-014-3441-3
24. Viljakainen H, Andersson-Assarsson JC, Armenio M, et al. Low Copy Number of the AMY1 Locus Is Associated with Early-Onset Female Obesity in Finland. PLoS One. 2015;10(7):e0131883. doi:10.1371/journal.pone.0131883
25. Choi YJ, Nam YS, Yun JM, et al. Association between salivary amylase (AMY1) gene copy numbers and insulin resistance in asymptomatic Korean men. Diabet Med. 2015;32(12):1588–1595. doi:10.1111/dme.12808
26. Mandel AL, Breslin PA. High endogenous salivary amylase activity is associated with improved glycemic homeostasis following starch ingestion in adults. J Nutr. 2012;142(5):853–858. doi:10.3945/jn.111.156984
27. Powley TL. The ventromedial hypothalamic syndrome, satiety, and a cephalic phase hypothesis. Psychol Rev. 1977;84(1):89–126. doi:10.1037/0033-295X.84.1.89
28. Teff KL, Townsend RR. Early phase insulin infusion and muscarinic blockade in obese and lean subjects. Am J Physiol. 1999;277(1):R198–208. doi:10.1152/ajpregu.1999.277.1.R198
29. Suzuki H, Fukushima M, Okamoto S, et al. Effects of thorough mastication on postprandial plasma glucose concentrations in nonobese Japanese subjects. Metabolism. 2005;54(12):1593–1599. doi:10.1016/j.metabol.2005.06.006
30. Ahren B, Holst JJ. The cephalic insulin response to meal ingestion in humans is dependent on both cholinergic and noncholinergic mechanisms and is important for postprandial glycemia. Diabetes. 2001;50(5):1030–1038. doi:10.2337/diabetes.50.5.1030
31. Peyrot Des Gachons C, Breslin PA. Salivary Amylase: digestion and Metabolic Syndrome. Curr Diab Rep. 2016;16(10):102. doi:10.1007/s11892-016-0794-7
32. Shamseddeen H, Getty JZ, Hamdallah IN, Ali MR. Epidemiology and economic impact of obesity and type 2 diabetes. Surg Clin North Am. 2011;91(6):1163–1172, vii. doi:10.1016/j.suc.2011.08.001
33. Liu S, Li D, Huang B, Chen Y, Lu X, Wang Y. Inhibition of pancreatic lipase, alpha-glucosidase, alpha-amylase, and hypolipidemic effects of the total flavonoids from Nelumbo nucifera leaves. J Ethnopharmacol. 2013;149(1):263–269. doi:10.1016/j.jep.2013.06.034
34. Rukh G, Ericson U, Andersson-Assarsson J, Orho-Melander M, Sonestedt E. Dietary starch intake modifies the relation between copy number variation in the salivary amylase gene and BMI. Am J Clin Nutr. 2017;106(1):256–262. doi:10.3945/ajcn.116.149831
35. White S. Counting copy number and calories. Nat Genet. 2015;47(8):852–853. doi:10.1038/ng.3365
36. Marquina C, Mousa A, Belski R, Banaharis H, Naderpoor N, de Courten B. Increased Inflammation and Cardiometabolic Risk in Individuals with Low AMY1 Copy Numbers. J Clin Med. 2019;8(3):382. doi:10.3390/jcm8030382
37. Tan VM, Ooi DS, Kapur J, et al. The role of digestive factors in determining glycemic response in a multiethnic Asian population. Eur J Nutr. 2016;55(4):1573–1581. doi:10.1007/s00394-015-0976-0
38. Barber TM, Bhatti AA, Elder PJD, et al. AMY1 gene copy number correlates with glucose absorption and visceral fat volume, but not with insulin resistance. J Clin Endocrinol Metab. 2020;105:10. doi:10.1210/clinem/dgaa473
39. Chinese Diabetes Society-metabolic syndrome program. Suggestions for metabolic syndrome by Chinese Diabetes Society. Chin J Diabetes. 2004;12:156–161.
40. Zhao Y, Zhang J, Zhang J, Wu J, Chen Y. Metabolic syndrome and diabetes are associated with low serum amylase in a Chinese asymptomatic population. Scand J Clin Lab Invest. 2014;74(3):235–239. doi:10.3109/00365513.2013.878469
41. Lee JG, Park SW, Cho BM, et al. Serum amylase and risk of the metabolic syndrome in Korean adults. Clin Chim Acta. 2011;412(19–20):1848–1853. doi:10.1016/j.cca.2011.06.023
42. Teff KL, Engelman K. Oral sensory stimulation improves glucose tolerance in humans: effects on insulin, C-peptide, and glucagon. Am J Physiol. 1996;270(6 Pt 2):R1371–1379. doi:10.1152/ajpregu.1996.270.6.R1371
43. Muneyuki T, Nakajima K, Aoki A, et al. Latent associations of low serum amylase with decreased plasma insulin levels and insulin resistance in asymptomatic middle-aged adults. Cardiovasc Diabetol. 2012;11:80. doi:10.1186/1475-2840-11-80
44. Guo H, Jiang W, Zhao B, Xiong Y, Lu Z. A predictive model of metabolic syndrome by medical examination: evidence from an 8-year chinese cohort. Diabetes Metab Syndr Obes. 2021;14:4459–4467. doi:10.2147/DMSO.S314550
45. Arredouani A, Stocchero M, Culeddu N, et al. Erratum. metabolomic profile of low-copy number carriers at the salivary alpha-amylase gene suggests a metabolic shift toward lipid-based energy production. Diabetes. 2016;65:3362–3368. doi:10.2337/db16-0315
46. Ferrannini E, Natali A, Camastra S, et al. Early metabolic markers of the development of dysglycemia and type 2 diabetes and their physiological significance. Diabetes. 2013;62(5):1730–1737. doi:10.2337/db12-0707
47. Venkatapoorna CMK, Ayine P, Parra EP, et al. Association of Salivary Amylase (AMY1) Gene Copy Number with Obesity in Alabama Elementary School Children. Nutrients. 2019;11(6):1379. doi:10.3390/nu11061379
48. Al-Akl N, Thompson RI, Arredouani A. High plasma salivary alpha-amylase, but not high AMY1 copy number, associated with low obesity rate in Qatari adults: cross-sectional study. Sci Rep. 2020;10(1):17918. doi:10.1038/s41598-020-74864-6
49. Higuchi R, Iwane T, Iida A, Nakajima K. Copy number variation of the salivary amylase gene and glucose metabolism in healthy young japanese women. J Clin Med Res. 2020;12(3):184–189. doi:10.14740/jocmr4082
50. Nakajima K, Nemoto T, Muneyuki T, Kakei M, Fuchigami H, Munakata H. Low serum amylase in association with metabolic syndrome and diabetes: a community-based study. Cardiovasc Diabetol. 2011;10:34. doi:10.1186/1475-2840-10-34
51. Nakajima K. Low serum amylase and obesity, diabetes and metabolic syndrome: a novel interpretation. World J Diabetes. 2016;7(6):112–121. doi:10.4239/wjd.v7.i6.112
52. Mossner J, Logsdon CD, Williams JA, Goldfine ID. Insulin, via its own receptor, regulates growth and amylase synthesis in pancreatic acinar AR42J cells. Diabetes. 1985;34(9):891–897. doi:10.2337/diab.34.9.891
53. Schneeman BO, Inman MD, Stern JS. Pancreatic enzyme activity in obese and lean Zucker rats: a developmental study. J Nutr. 1983;113(4):921–925.39. doi:10.1093/jn/113.4.921
54. Polito R, Valenzano A, Scarinci A, et al. Very low-calorie ketogenic diet modulates the autonomic nervous system activity through salivary amylase in obese population subjects. Int J Environ Res Public Health. 2021;18(16):8475. doi:10.3390/ijerph18168475
 © 2021 The Author(s). This work is published and licensed by Dove Medical Press Limited. The full terms of this license are available at https://www.dovepress.com/terms.php and incorporate the Creative Commons Attribution - Non Commercial (unported, v3.0) License.
By accessing the work you hereby accept the Terms. Non-commercial uses of the work are permitted without any further permission from Dove Medical Press Limited, provided the work is properly attributed. For permission for commercial use of this work, please see paragraphs 4.2 and 5 of our Terms.
© 2021 The Author(s). This work is published and licensed by Dove Medical Press Limited. The full terms of this license are available at https://www.dovepress.com/terms.php and incorporate the Creative Commons Attribution - Non Commercial (unported, v3.0) License.
By accessing the work you hereby accept the Terms. Non-commercial uses of the work are permitted without any further permission from Dove Medical Press Limited, provided the work is properly attributed. For permission for commercial use of this work, please see paragraphs 4.2 and 5 of our Terms.