")
Back to Journals » Clinical Ophthalmology » Volume 9
Association of retinal thickness and optic disc-to-fovea angle to axial length of young healthy eyes
Authors Yamashita T, Sakamoto T, Terasaki H, Tanaka M, Kii Y, Uchino E, Hisatomi T, Nakao K
Received 27 July 2015
Accepted for publication 19 September 2015
Published 27 November 2015 Volume 2015:9 Pages 2235—2241
DOI https://doi.org/10.2147/OPTH.S93197
Checked for plagiarism Yes
Review by Single anonymous peer review
Peer reviewer comments 3
Editor who approved publication: Dr Scott Fraser
Takehiro Yamashita,1 Taiji Sakamoto,1 Hiroto Terasaki,1 Minoru Tanaka,1 Yuya Kii,1 Eisuke Uchino,1 Toshio Hisatomi,2 Kumiko Nakao1
1Department of Ophthalmology, Kagoshima University Graduate School of Medical and Dental Sciences, Kagoshima, Japan; 2Department of Ophthalmology, National Hospital Organization Kyushu Medical Center, Fukuoka, Japan
Aim: To determine the relationship between the axial length (AL) and the retinal thickness in the posterior pole and to the optic disc-to-fovea (ODF) angle of healthy eyes.
Procedures: A prospective, observational cross-sectional study (registration number, UMIN000006040) of 64 healthy right eyes (mean age 26.0±4.5 years) was performed. The thickness of the 64 areas within the central 24° area were measured in the Spectralis spectral domain–optical coherent tomographic images obtained by posterior pole scans. Each area was 3°×3°. The ODF angle was measured in each fundus photograph. The relationships between the AL and the retinal thickness of each of the 64 areas and the ODF angle were investigated by linear regression analyses.
Results: The mean AL was 25.0±1.3 mm and the mean ODF angle was 17.2°±1.0°. The average retinal thickness of the four areas around the fovea was constant and not significantly correlated with the AL. However, the retinal thicknesses of 54 of the other 60 areas were significantly and negatively correlated with the AL (R=-0.25 to -0.56, P<0.05). The ODF angle was also constant and not significantly correlated with the AL (R=-0.17, P=0.19).
Conclusion: The lack of significant correlations between the AL and the retinal thicknesses of the central 6° or the ODF angle suggests that there might be some feedback system to keep the central retinal thickness and ODF angle constant regardless of an elongation of the AL.
Keywords: retinal thickness, axial length, optic disc-to-fovea angle
Introduction
The axial length (AL) of the human eye is approximately 16.5–17.0 mm at birth,1,2 and it continues to grow until a person reaches the age of 15–18 years. Echographic measurements of the AL show that it increases by 3–4 mm from birth to 1 year, 0.5–1 mm from 1 to 3 years, and 0.5–1 mm from 8 to 13 years.3 Overall, the AL elongates approximately 7 mm during this period. The elongation of the AL is greater in myopic eyes than in emmetropic and hyperopic eyes.
During the growth of the eye, there are several important factors that affect the development of good visual acuity. Among them, the retinal structure and the position of the fovea are important. For example, if the retina in the macular area becomes excessively thin as the AL increases, good visual acuity cannot be achieved (Figure 1). Indeed, the visual acuity declines significantly following a thinning of the macula in eyes with pathologic myopia.4 The alignment of the visual axis is also important for visual acuity, and it can be misaligned from its normal position during growth, leading to strabismus. This can then inhibit the healthy development of the visual acuity.
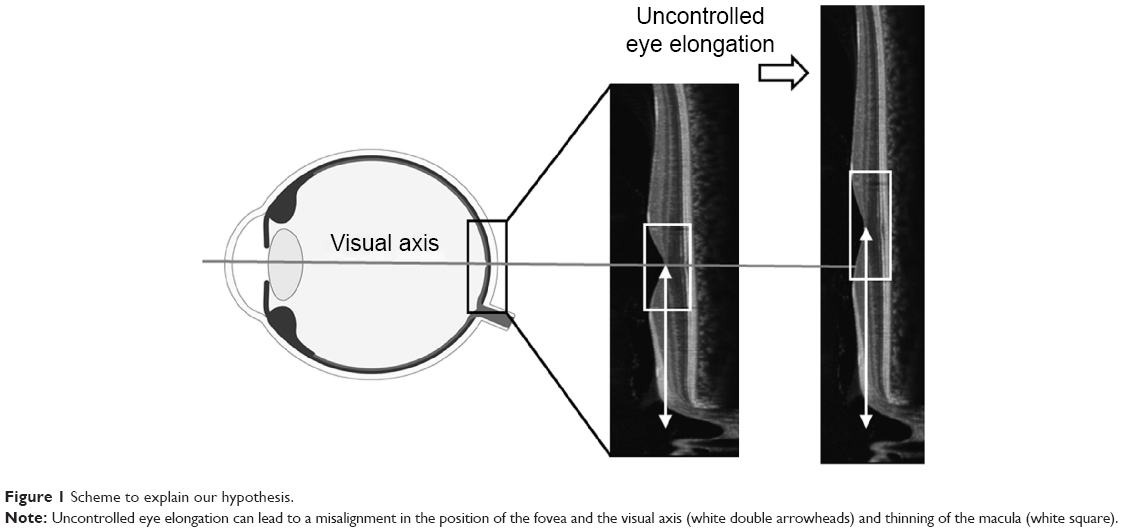 | Figure 1 Scheme to explain our hypothesis. |
In our earlier study, we showed that the retinal thickness of the most posterior polar sectors decreased significantly as the AL increased. However, the retinal thickness of the central macula region was maintained and not affected by the elongation of the AL.5 Other researchers have reported that the thickness of the macula was not significantly correlated with the AL, but the thickness of the perimacular sectors was negatively and significantly correlated with the AL.6–10
Rohrschneider11 reported that the optic disc-to-fovea (ODF) angle is constant regardless of the AL in Caucasians, but he did not determine whether this also held for the retinal thickness. The results of a recent study showed that young Japanese individuals were the most myopic population with a wide range of ALs.12 So, this population would be the most suitable to study the effects of the AL on the macular thickness and the ODF angle.
Aim
The purpose of this study was to determine whether a significant correlation existed between the AL and the retinal thickness of the 64 areas measured in the spectral domain–optical coherent tomographic (SD-OCT) images or the ODF angle in young Japanese individuals.
Methods
All the procedures used conformed to the tenets of the Declaration of Helsinki. A written informed consent was obtained from all the subjects after an explanation of the procedures to be used. This study was approved by the Ethics Committee of Kagoshima University Hospital, and it was registered with the University Hospital Medical Network (UMIN)-clinical trials registry (CTR). The registration title was, “Morphological analysis of the optic disc and the retinal nerve fiber in myopic eyes” and the registration number was UMIN000006040. A detailed protocol is available at https://upload.umin.ac.jp/cgi-open-bin/ctr/ctr.cgi?function=brows&action=brows&type=summary&recptno=R000007154&language=J. The participants were the same ones who participated in our previous study.5 However, we obtained new additional data, the ODF angle, from the subjects and they were analyzed by a different method.
Subjects
This was a cross-sectional, prospective observational study. We examined 72 eyes of 72 volunteers who were studied between June 6, 2011 and February 23, 2012. The volunteers had no eye disease as determined by examining their medical history and comprehensive ophthalmological examinations. Only the data from the right eyes were analyzed. The eligibility criteria were age ≥20 years but ≤40 years, eyes normal by slit-lamp biomicroscopy, ophthalmoscopy, and OCT; best-corrected visual acuity ≥0.1 logarithm of the minimum angle of resolution units; and the intraocular pressure (IOP) ≤21 mmHg. The exclusion criteria were eyes with known ocular diseases such as glaucoma, staphyloma, and optic disc anomaly; known systemic diseases such as hypertension and diabetes; presence of visual field defects; and history of refractive or intraocular surgery; measurement error or segmentation error.
Seventy-two Japanese volunteers were screened. One eye was excluded due to a superior segmental optic disc hypoplasia, and two eyes were excluded because of prior refractive surgery. Five other eyes were excluded because of segmentation errors in the retinal thickness measurements. In the end, the right eyes of 64 individuals (42 men and 22 women) were used for the analyses.
Measurements of AL and refractive error
All the eyes had a standard ocular examination, including slit-lamp biomicroscopy of the anterior segment, ophthalmoscopy of the ocular fundus, IOP measurements with the CT-80 pneumotonometer (Topcon, Tokyo, Japan), and AL measurements with the AL-2000 ultrasound instrument (TOMEY, Nagoya, Japan). The refractive error (spherical equivalent) was measured using the Topcon KR8800 autorefractometer/keratometer (Topcon).
Measurement of retinal thickness of posterior pole consisting of 64 areas
All eyes were examined by a single examiner (TY). The retinal thickness was measured using the Spectralis SD-OCT (Heidelberg Engineering, Heidelberg, Germany) using posterior polar scans. In this protocol, the OCT instrument automatically identified a line connecting the center of the fovea to the center of the optic disc as a reference line. Then, 61 line scans (1,024 A scans/line) parallel to the reference line within the central 25° by 30° area with five overlapping B-scan/image were collected. Then, the OCT instruments automatically constructed a three-dimensional (3D) retinal thickness map. The OCT software (Santec, Komaki, Japan) measured the distance between the internal limiting membrane and Bruch’s membrane as the retinal thickness.13,14 To exclude measurement and segmentation errors, one examiner (YK) checked the segmentation of the B-scans. The area was divided into equal 8×8 areas for a total of 64 areas, and the average retinal thickness of each 3° by 3° area was determined. The interobserver and the intervisit reproducibility of the posterior pole asymmetry scan were excellent.5 Therefore, one scan was sufficient to measure the mean retinal thickness of 64 areas in the posterior pole asymmetrical scan.
Measurement of ODF angle
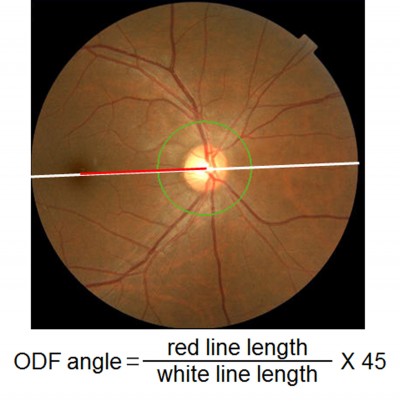
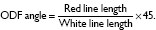
The 45° fundus images were taken using the TOPCON 3D OCT-1000 MARK II fundus camera (Topcon). During the recordings, the examinee was asked to fixate a reference light. Great care was taken to maintain the facial frontal plane vertical to the reference light axis and to position the camera on the central axis because the alignment of the eye can affect the ODF angle. We determined the ODF angle on the fundus images using ImageJ software (National Institutes of Health, Bethesda, MD, USA). First, the distance between the center of the optic disc and the fovea was measured. Then, the ODF angle was determined by dividing the length of the ODF distance by the diameter of the fundus image, ie, 45° (Figure 2). This method was used and described in detail in a previous publication.11
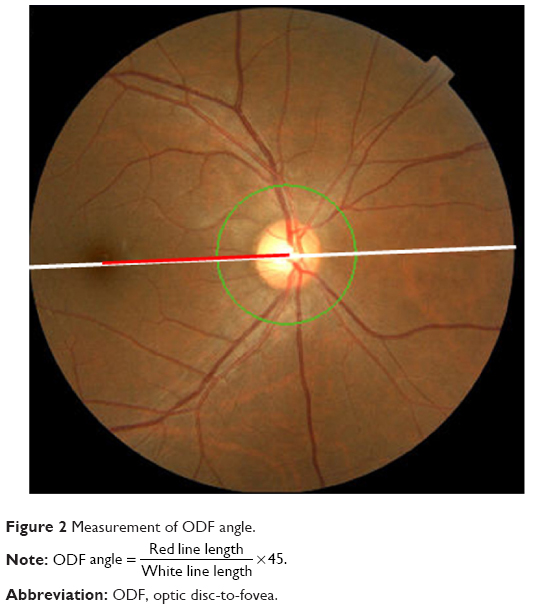 | Figure 2 Measurement of ODF angle. |
Statistical analyses
All statistical analyses were performed using the SPSS statistics 21 for Windows (SPSS Inc., IBM, Somers, NY, USA). The relationships between the AL and the refractive error (spherical equivalent) were investigated by linear regression analysis. The relationship between the AL and the retinal thicknesses of each of the 64 areas or the ODF angle was determined by Pearson’s correlation analysis.
Results
Demographics
The mean ± standard deviation of the age was 26.0±4.5 years with a range of 22–39 years, and the mean refractive error (spherical equivalent) was −4.14±3.10 diopters (D) with a range of −14.25 to 0.00 D. The mean AL was 25.0±1.3 mm with a range of 22.4–28.2 mm, and the mean ODF angle was 17.2°±1.0° with a range of 15.2°–19.2°. The refractive error and AL were significantly and negatively correlated (R=−0.79, P<0.001).
Pearson’s correlation coefficients between thickness of each 64 area and AL
The average retinal thickness of the four central areas around the fovea was not significantly correlated with the AL (r=−0.07 to 0.01; P>0.05). The retinal thickness of each of the 54 of the other 60 areas was significantly and negatively correlated with the AL (r=−0.25 to −0.56, P<0.05; Figure 3). The six nonsignificant areas were the four lateral inferior areas and two nasal areas in addition to the four foveal areas. These results are consistent with our earlier study.5
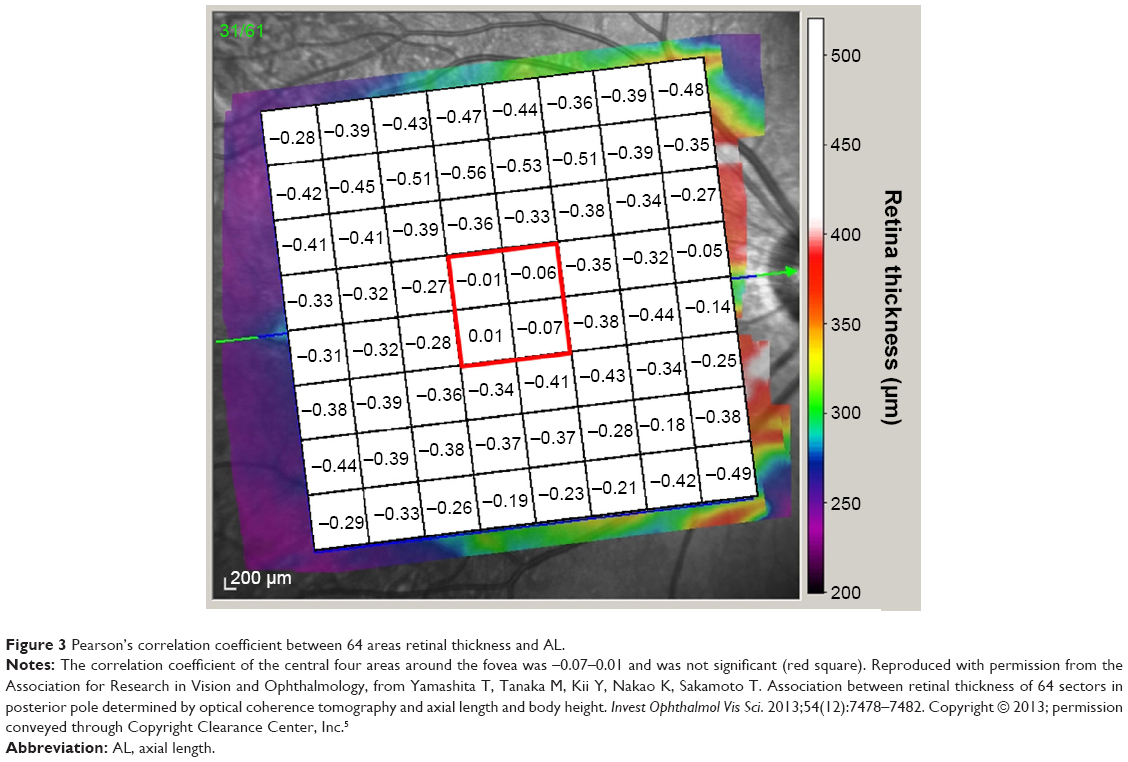 | Figure 3 Pearson’s correlation coefficient between 64 areas retinal thickness and AL. |
Pearson’s correlation coefficient between ODF angle and AL
The ODF angle was not significantly correlated with the AL (R=−0.17; P=0.19; Figure 4).
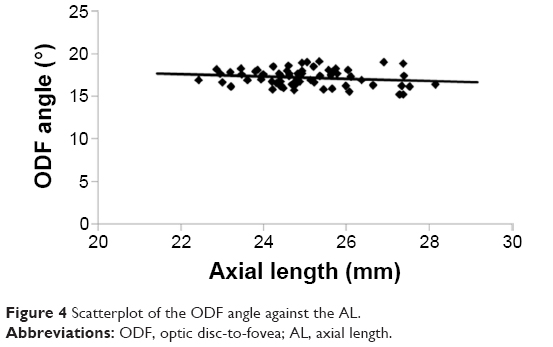 | Figure 4 Scatterplot of the ODF angle against the AL. |
Discussion
Our results showed that the retinal thickness of the four foveal areas covering the central 6° was not significantly correlated with the AL. On the other hand, the thicknesses of 54 of the other 60 areas were significantly correlated with the AL. Additionally, the ODF angle was not significantly correlated with the AL.
These results indicate that there may be a physiological mechanism that maintains the retinal thickness of the fovea and the ODF angle stable in spite of the elongation of the AL. The maintenance of a relatively constant retinal thickness and ODF angle is important for the development of good visual function. Without this mechanism, the posterior eye would be deformed like a balloon as the AL elongates resulting in a thinner foveal retina and a larger ODF angle (Figure 1). To maintain good vision, the fovea must be located on the visual axis. In the normal development of the human body, each tissue gets larger with a fine balance between growth and antagonizing forces that leads to the optimal development of function. For example, the normal growth of bone tissue is the result of a balance between osteoblastic system and osteoclastic system.15
In human eyes, there is a muscarinic system in the sclera that influences the elongation of the AL,16 and a nonvascular smooth muscle cell (NVSMC) system that antagonizes the muscarinic system. May17 described this interaction as follows. First, a plaque-like arrangement of NVSMCs is present in the temporal quadrant of the foveal region that spreads to the temporal rim of the optic nerve (Figure 5). Second, in the posterior pole of the eye between the entry of the short posterior ciliary arteries and the equator, the arteries are accompanied by NVSMCs. The NVSMCs are not present in the peripheral choroid near the ciliary body. Third, numerous NVSMCs follow the course of the larger veins that form the vortex veins at the level of the equator bulbi. Hypothetically, the system to maintain the foveal thickness and ODF angle might be related to the NVSMCs beneath the fovea and between the foveal and the optic nerve. The NVSMCs beneath the fovea might counteract the elongation of the AL. NVSMCs present in the fovea to the optic nerve might counteract the power to move away the fovea from the optic nerve. The abnormality of NVSMC may be caused by a deformation of the eye by a posterior staphyloma, pathologic myopia, or dome-shaped macula.18–21 Histological studies are needed to test this hypothesis. In addition, refinements of OCT systems might enable us to observe these conditions directly without histology in a longitudinal study.
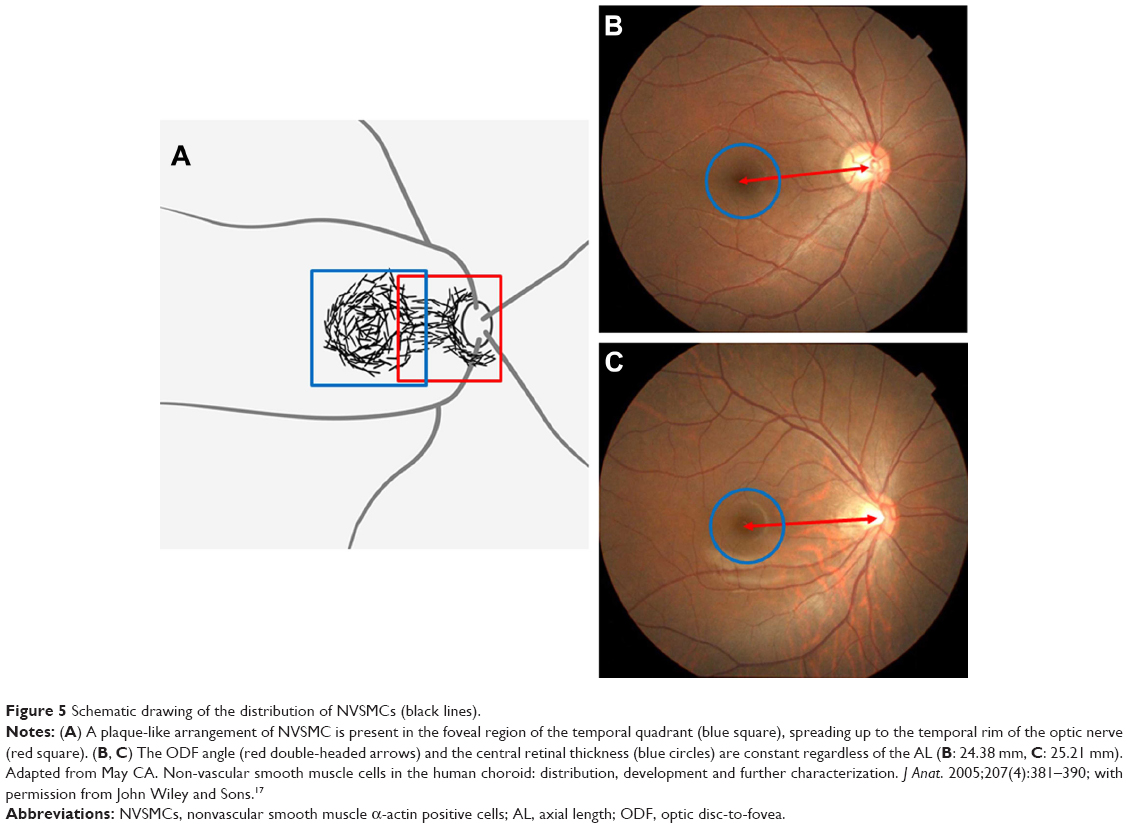 | Figure 5 Schematic drawing of the distribution of NVSMCs (black lines). |
To evaluate the spatial relationship between the optic disc and fovea, we measured the ODF angle in the fundus photographs, but not the distance of the ODF. Because the distance of the ODF is the same, the location of fovea against the optic axis varies depending on the size of eye.18 If the ODF angle is the same, the foveal location would be constant against the optic disc. Bennett’s formula is often used to determine the length of the ODF in fundus photographs.22,23 However, Bennett’s formula is based on a model eye in which the eye has the same shape. The posterior sclera is sometimes deformed, especially in eyes with longer ALs. Furthermore, Bennett’s formula contains a factor for the AL which makes it difficult to use this formula to evaluate the correlation of the ODF and the AL. Therefore, we adopted the present method.
The present study has several limitations. First, the 64-area analysis has a limitation. The correlations found may be explained by the angular (3° by 3°) and not the linear size of the 64 areas. The more the AL increases, the more the linear distance also increases from the fovea. But, the retina is thinner in the distant parts except the nasal area. This may explain why most of the correlations over 0.4 are in the third and fourth rows from the fovea. This possibility should be remembered in interpreting the data. Second, the biomechanical properties of different retinal layers could be different. The fovea in its center consists mainly of the outer nuclear layer. Therefore, this layer is more compressed than other layers and could be more resistant to myopic extension of the eye. This may need a further study on the relationship between different retinal layers and AL. Third, this was a cross-sectional study, and therefore the process of the elongation of the AL was not evaluated in a strict sense. To answer this criticism, a longitudinal study from childhood to adulthood is necessary. Fourth, we studied young Japanese who are the most myopic group in the world.12 Thus, our results might not necessarily hold for nonmyopic populations. A large epidemiological study should help generalize the present results to all populations.
Conclusion
The retinal thickness of the fovea within the central 6° and the ODF angle are independent of the AL in healthy young Japanese. We suggest that there may be a physiological system to keep these structures stable and that the system may be related to the NVSMCs beneath the fovea and between the foveal and the optic nerve.
Acknowledgment
The authors thank Professor Duco Hamasaki of Bascom Palmer Eye Institute, University of Miami, FL, for providing critical discussions and suggestions to our study and editing of the final manuscript.
Disclosure
The authors report no conflicts of interest in this work.
References
Axer-Siegel R, Herscovici Z, Davidson S, Linder N, Sherf I, Snir M. Early structural status of the eyes of healthy term neonates conceived by in vitro fertilization or conceived naturally. Invest Ophthalmol Vis Sci. 2007;48(12):5454–5458. | ||
Gordon RA, Donzis PB. Refractive development of the human eye. Arch Ophthalmol. 1985;103(6):785–789. | ||
Larsen JS. The sagittal growth of the eye. IV. Ultrasonic measurement of the axial length of the eye from birth to puberty. Acta Ophthalmol (Copenh). 1971;49(6):873–886. | ||
Spaide RF, Ohno-Matsui K, Yannuzzi LA. Pathologic Myopia. New York, NY: Springer; 2014:187–209. | ||
Yamashita T, Tanaka M, Kii Y, Nakao K, Sakamoto T. Association between retinal thickness of 64 sectors in posterior pole determined by optical coherence tomography and axial length and body height. Invest Ophthalmol Vis Sci. 2013;54(12):7478–7482. | ||
Huynh SC, Wang XY, Rocthchina E, et al. Distribution of macular thickness by optical coherence tomography: findings from a population-based study of 6-year-old children. Invest Ophthalmol Vis Sci. 2006;47(6):2351–2357. | ||
Lam DS, Leung KS, Mohamed S, et al. Regional variations in the relationship between macular thickness measurements and myopia. Invest Ophthalmol Vis Sci. 2007;48(1):376–382. | ||
Song WK, Lee SC, Lee ES, et al. Macular thickness variations with sex, age, and axial length in healthy subjects: a spectral domain-optical coherence tomography study. Invest Ophthalmol Vis Sci. 2010;51(8):3913–3918. | ||
Ooto S, Hangai M, Sakamoto A, et al. Three-dimensional profile of macular retinal thickness in normal Japanese eyes. Invest Ophthalmol Vis Sci. 2010;51(1):465–473. | ||
Ooto S, Hangai M, Tomidokoro A, et al. Effects of age, sex, and axial length on the three-dimensional profile of normal macular layer structures. Invest Ophthalmol Vis Sci. 2011;52(12):8769–8779. | ||
Rohrschneider K. Determination of the location of the fovea on the fundus. Invest Ophthalmol Vis Sci. 2004;45(9):3257–3258. | ||
Sawada A, Tomidokoro A, Araie M, et al. Refractive errors in an elderly Japanese population: the Tajimi study. Ophthalmology. 2008;115(2):363–370. | ||
Asrani S, Rosdahl JA, Allingham RR. Novel software strategy for glaucoma diagnosis: asymmetry analysis of retinal thickness. Arch Ophthalmol. 2011;129(9):1205–1211. | ||
Seo JH, Kim TW, Weinreb RN, Park KH, Kim SH, Kim DM. Detection of localized retinal nerve fiber layer defects with posterior pole asymmetry analysis of spectral domain optical coherence tomography. Invest Ophthalmol Vis Sci. 2012;53(8):4347–4353. | ||
Cappariello A, Maurizi A, Veeriah V, Teti A. The Great Beauty of the osteoclast. Arch Biochem Biophys. 2014;558:70–78. | ||
McBrien NA, Arumugam B, Gentle A, Chow A, Sahebjada S. The M4 muscarinic antagonist MT-3 inhibits myopia in chick: evidence for site of action. Ophthalmic Physiol Opt. 2011;31(5):529–539. | ||
May CA. Non-vascular smooth muscle cells in the human choroid: distribution, development and further characterization. J Anat. 2005;207(4):381–390. | ||
Ohno-Matsui K, Akiba M, Modegi T, et al. Association between shape of sclera and myopic retinochoroidal lesions in patients with pathologic myopia. Invest Ophthalmol Vis Sci. 2012;53(10):6046–6061. | ||
Moriyama M, Ohno-Matsui K, Modegi T, et al. Quantitative analyses of high-resolution 3D MR images of highly myopic eyes to determine their shapes. Invest Ophthalmol Vis Sci. 2012;53(8):4510–4518. | ||
Imamura Y, Iida T, Maruko I, Zweifel SA, Spaide RF. Enhanced depth imaging optical coherence tomography of the sclera in dome-shaped macula. Am J Ophthalmol. 2011;151(2):297–302. | ||
Gaucher D, Erginay A, Lecleire-Collet A, et al. Dome-shaped macula in eyes with myopic posterior staphyloma. Am J Ophthalmol. 2008;145(5):909–914. | ||
Garway-Heath DF, Rudnicka AR, Lowe T, Foster PJ, Fitzke FW, Hitchings RA. Measurement of optic disc size: equivalence of methods to correct for ocular magnification. Br J Ophthalmol. 1998;82(6):643–649. | ||
Bennett AG, Rudnicka AR, Edgar DF. Improvements on Littmann’s method of determining the size of retinal features by fundus photography. Graefes Arch Clin Exp Ophthalmol. 1994;232(6):361–367. |
 © 2015 The Author(s). This work is published and licensed by Dove Medical Press Limited. The full terms of this license are available at https://www.dovepress.com/terms.php and incorporate the Creative Commons Attribution - Non Commercial (unported, v3.0) License.
By accessing the work you hereby accept the Terms. Non-commercial uses of the work are permitted without any further permission from Dove Medical Press Limited, provided the work is properly attributed. For permission for commercial use of this work, please see paragraphs 4.2 and 5 of our Terms.
© 2015 The Author(s). This work is published and licensed by Dove Medical Press Limited. The full terms of this license are available at https://www.dovepress.com/terms.php and incorporate the Creative Commons Attribution - Non Commercial (unported, v3.0) License.
By accessing the work you hereby accept the Terms. Non-commercial uses of the work are permitted without any further permission from Dove Medical Press Limited, provided the work is properly attributed. For permission for commercial use of this work, please see paragraphs 4.2 and 5 of our Terms.