")
Back to Journals » International Journal of General Medicine » Volume 14
Association of Pulse Pressure Difference and Diabetes Mellitus in Chinese People: A Cohort Study
Received 30 July 2021
Accepted for publication 17 September 2021
Published 11 October 2021 Volume 2021:14 Pages 6601—6608
DOI https://doi.org/10.2147/IJGM.S327841
Checked for plagiarism Yes
Review by Single anonymous peer review
Peer reviewer comments 2
Editor who approved publication: Dr Scott Fraser
Chunlei Wu, Denhua Ma, Yu Chen
Department of Cardiac Surgery, Taizhou Hospital of Zhejiang Province Affiliated to Wenzhou Medical University, Linhai, 317000, People’s Republic of China
Correspondence: Yu Chen People’s Republic of China
Email [email protected]
Purpose: Here, we sought to determine the association between pulse pressure difference and the incidence of type 2 diabetes mellitus (T2DM) in Chinese people.
Methods: This study involved 211,814 participants among whom 4156 had been diagnosed with T2DM. The correlation between pulse pressure difference and T2DM incidence in Chinese people was determined by multivariate analysis. A smooth curve fitting diagram was then used to explore correlation between pulse pressure difference and T2DM incidence. Finally, the inflection point in the correlation between pulse pressure difference and the T2DM incidence was located by piecewise linear regression.
Results: To understand the relationship, adjustments were made for sex, age, total serum cholesterol (TC), fasting blood glucose (FPG), triglyceride (TG), alanine aminotransferase (ALT), family history of diabetes, body mass index (BMI), blood urea nitrogen (BUN), drinking status, and smoking status. Diabetes incidence increased by 0.3% [HR 1.003 (1.001, 1.005), p = < 0.05] for every 1mmHg increase in pulse pressure difference. Smooth curve analysis showed that, when pulse pressure difference was ≤ 35mmHg, diabetes incidence negatively correlated to pulse pressure difference [HR 0.972 (0.953, 0.972) p = 0.053]. However, when pulse pressure difference was > 35mmHg, diabetes incidence increased with increasing pulse pressure difference [HR 1.044 (1.042, 1.047) p = < 0.001]. And between pulse pressure difference and fasting blood glucose in the final visit, the blood glucose level increased with the elevation of pulse pressure.
Conclusion: The risk of diabetes was lowest at about 35mmHg pulse pressure difference.
Keywords: pulse pressure difference, diabetes mellitus incidence, Chinese population, cohort study
Introduction
Hypertension and T2DM often occur together. Both are considered risk factors for coronary artery disease, which significantly increases heart disease risk.1 It is projected that, by the end of 2045, at least 700 million people worldwide will become victims of T2DM. T2DM is highly prevalent and inflicts an enormous economic burden on patients and countries.2–5 Although T2DM is closely associated with genetic and environmental factors, its pathogenesis is still not fully understood. The identification of T2DM risk factors is crucial to its prevention and early treatment in high risk groups.
Clinically, pulse pressure (PP) presents with arterial stiffness.6–8 PP generally increases with ageing due to arteriosclerosis progression.Compared with those without Diabetes Mellitus, T2DM patients intend to be afflicted with higher PP and arterial stiffness. And T2DM patients have a greater risk of suffering from cardiovascular disease.9–11
Despite rising numbers of patients with hypertension, the reasons underlying this increase are unclear.12–14 Elevated blood pressure is a risk factor for T2DM.15,16 However, evidence of association between pulse pressure difference and T2DM is lacking. Here, we investigated the association of pulse pressure with T2DM incidence.
Materials and Methods
Patient Enrolment
Previously published data17 were analyzed in the present study, thus consent to participate was waived. The Chinese Rich Healthcare Group Review Board approved this study. All procedures conformed to the guidelines of the Declaration of Helsinki and Strengthening the Reporting of Observational Studies in Epidemiology (STROBE).
Data Acquisition
Data were retrieved from DATADRYAD (www.datadryad.org), a publicly available database, and had been submitted by Chen.17 The data related to age, body mass index (BMI), triglyceride (TG), diabetes family history, blood urea nitrogen (BUN), sex, smoking status, drinking status, fasting plasma glucose (FPG), total cholesterol (TC), alanine aminotransferase (ALT), and family history of diabetes. All medical data of individuals who underwent health checks at 32 sites in 11 Chinese cities from 2010 to 2016 were collected. Each individual was asked to fill in a questionnaire at the medical center at each visit. In addition, trained investigators collected participants' laboratory parameters. Follow up was initiated in 2010 after health examinations had been completed and ended at diabetes occurrence or on 31 December 2016. Follow-up interval was >2 years. Data was collected between 2010 and 2016. The following parameters were measured: height, weight, and blood pressure. BMI was given by weight (kg), divided by height (m2). Weight and height measurements were accurate to 0.1 kg and 0.1 cm, respectively. Pulse pressure was given by systolic pressure minus diastolic pressure. ALT, TG, BUN, TC, AST, HDL, and LDL levels were evaluated using an autoanalyzer (Beckman 5800) based on the American Heart Association/American College of Cardiology guidelines. Blood pressure was measured using standard mercury sphygmomanometers. Participants were quiet and rested for 5–10 minutes before blood pressure measurement. The cuff width of the blood pressure gauge covered two-thirds of the length of the upper arm and the length of the sleeve was two-thirds of the length of the upper arm.
Study Population
The study involved 685,277 participants who underwent at least 2 visits for a physical assessment between 2010 and 2016 at 32 sites in 11 Chinese cities. Follow up began after health examinations had been completed in 2010 and stopped upon detection of diabetes or on 31 December 2016. In this retrospective cohort study, 211,833 participants (95,710 females and 116,123 males) met the eligibility criteria. Exclusion criteria were: (1) incomplete data, including FPG, sex, height, and weight, (2) BMI >55kg/m2 or <15 kg/m2, (3) <2-year follow-up, and (4) diabetes status unknown or presence of diabetes at baseline. Due to a lack of baseline SBP or DBP values, 19 participants were excluded, leaving 211,814 participants for final data analysis.
Diagnostic Criteria for Diabetes Mellitus Based on IDF
FPG ≥7.0mmol/L or −75g anhydrous glucose in oral glucose tolerance test (OGTT) 2 hours later two-hour blood glucose concentration ≥11.1mmol/l and/ or 75g OGTT with FPG ≥7.0 mmol/L.
-HbA1c ≥6.5%/48 mmol/L/mol.
Statistical Analysis
If missing values were continuous variables, they were supplemented with the median or mean. Many smoking and drinking records were missing and were treated as categorical variables. Data are shown as mean±SD or median (interquartile) for continuous variables. For categorical variables, they are shown as frequencies or percentages. Multiple logistic regression models were used to evaluate associations between pulse pressure difference and diabetes mellitus incidence. Non-adjusted as well as multivariate adjusted models were applied. Non-linear relationships were identified by generalized additive models (GAM) because PP was a continuous variable. In case there was a non-linear correlation, the threshold effect of PP on DM incidence in terms of the smoothing plot was calculated by a two-piecewise linear regression model. If the incidence of DM and PP ratios was evident in a smoothed curve, the recursive method was used to automatically calculate the inflection point, where the maximum model likelihood was used.
R 3.3.2 (http://www.R-project.org) and Free Statistics software versions were used for data analyses. P ≤0.05 denoted statistical significance.
Results
Baseline Characteristics of Study Participants
This study involved 211,814 participants (mean age: 42.1 years; male: 54.82%) who were considered nondiabetic at baseline assessment. Average follow up was 3.12 years, during which 4155 participants were diagnosed with T2DM. Basic indices, laboratory examinations, and other parameters are shown in Table 1. The participants were assigned to subgroups based on PP quartiles. With the lowest-level pulse pressure difference, the other three groups had higher BMI, fasting blood glucose, triglyceride, ALT, Aspartate transaminase, and BUN (Table 1).
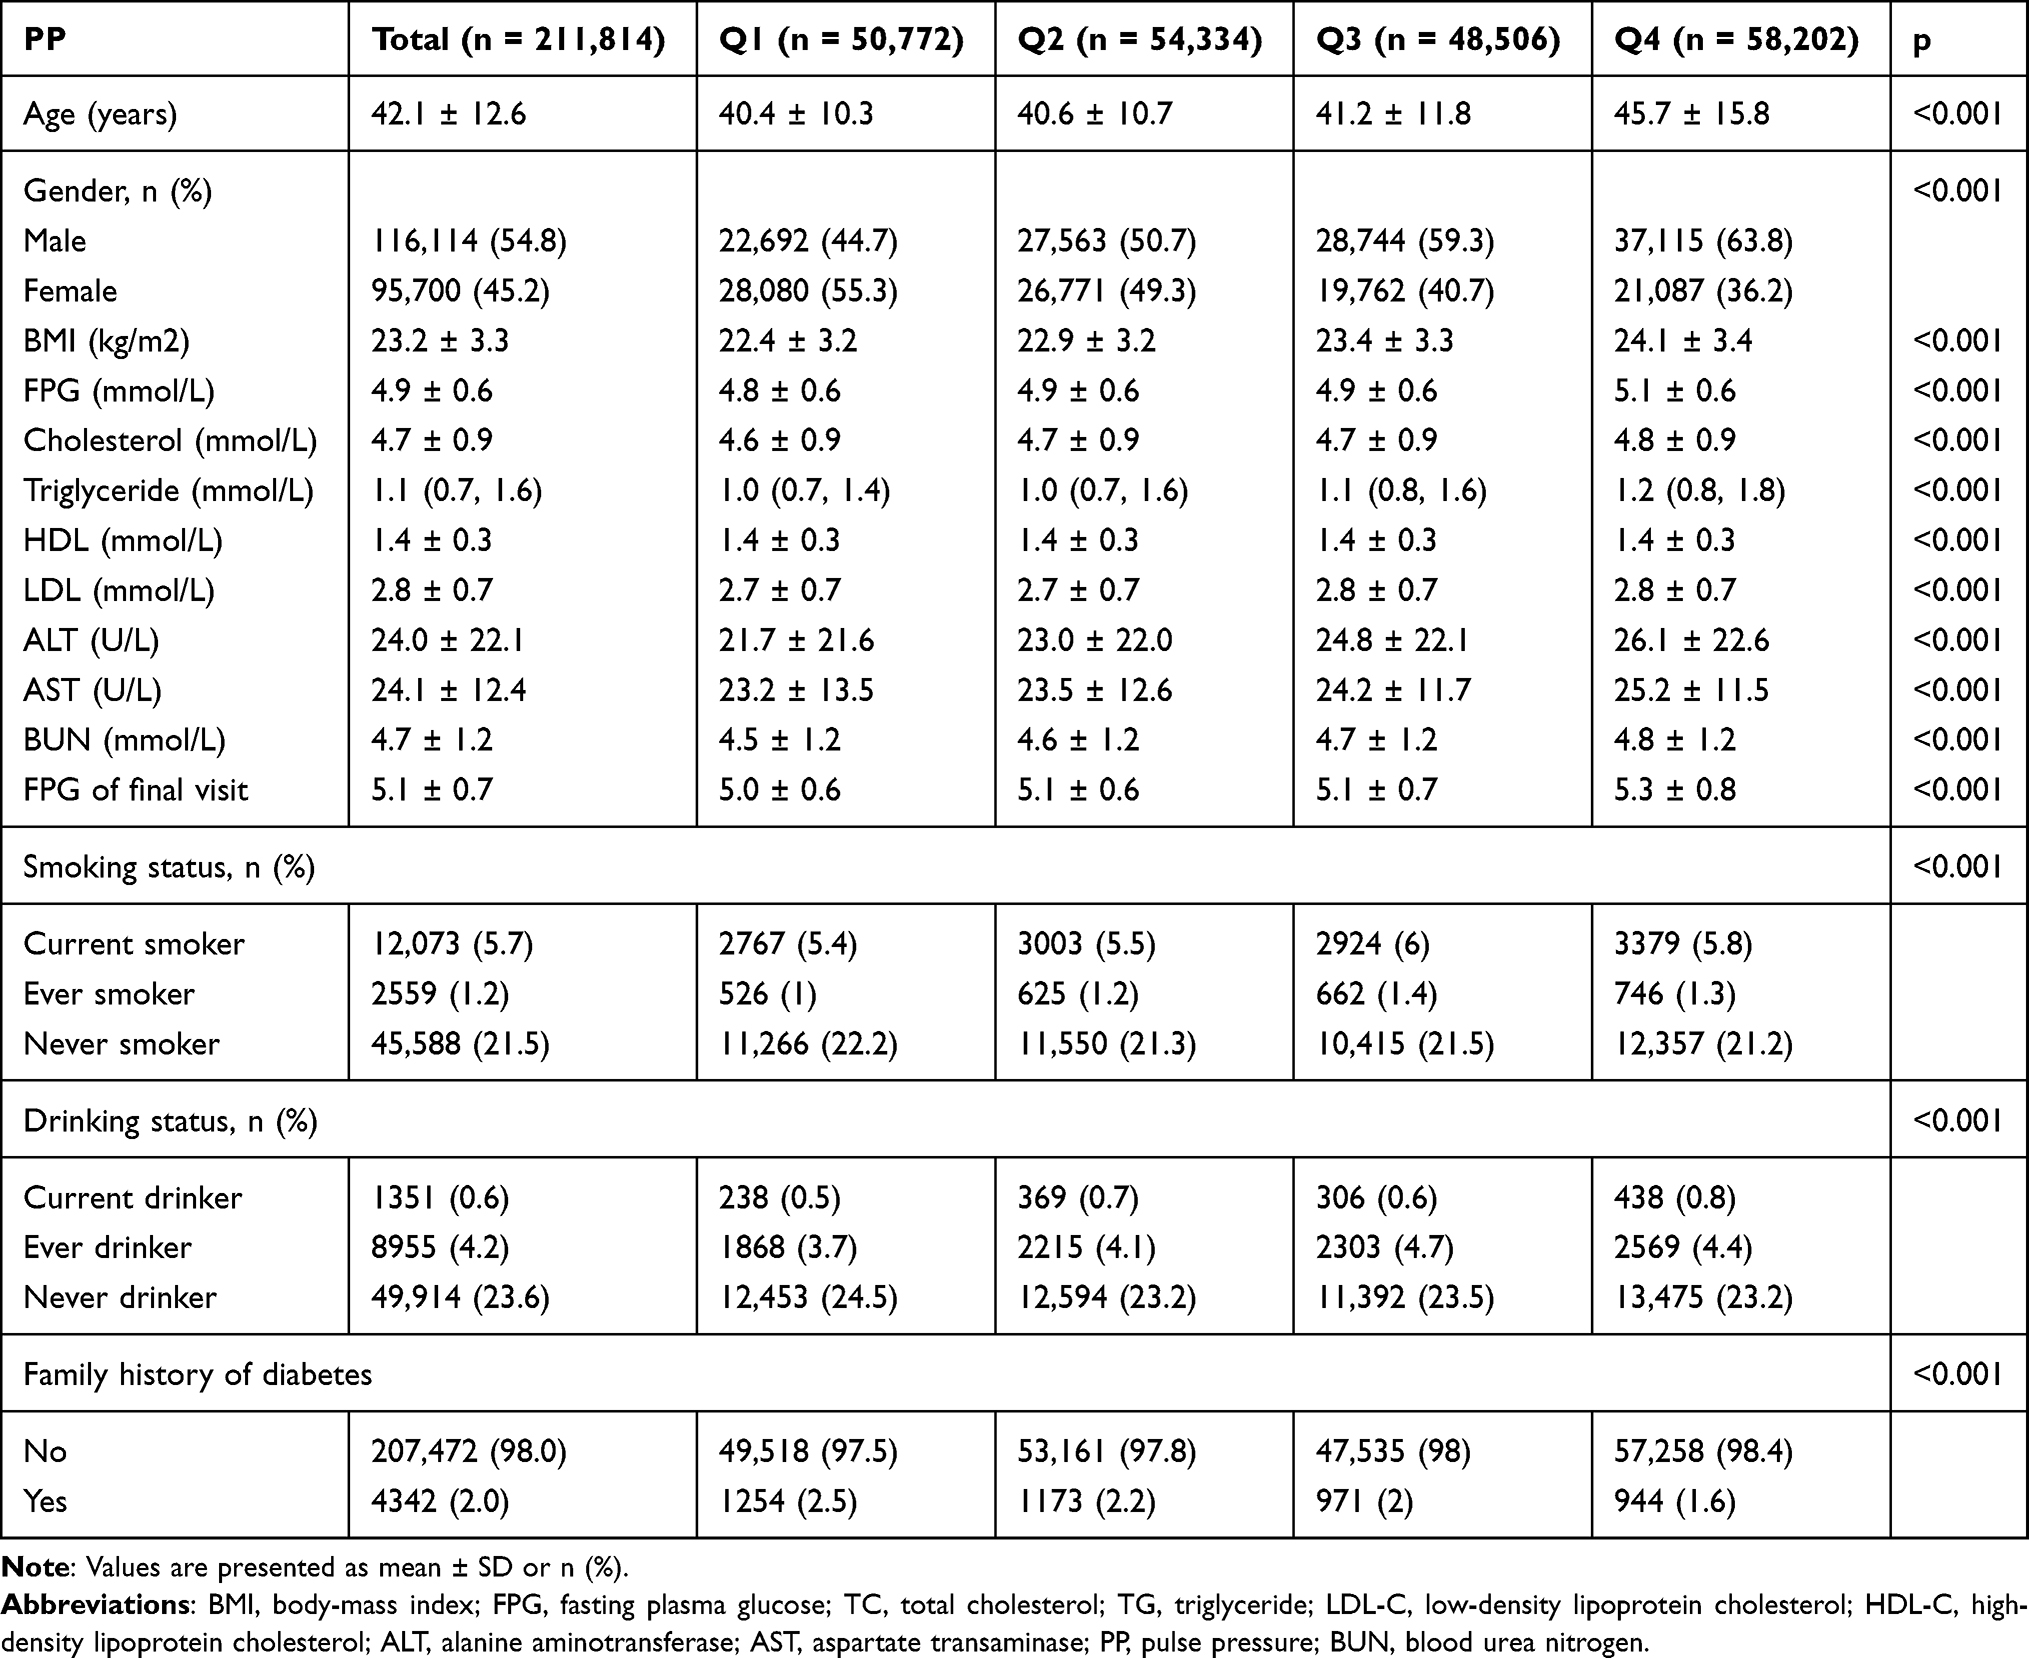 |
Table 1 Baseline Characteristics of the Study Participants |
Multivariate Cox Regression Analysis of the Relationship Between Pulse Pressure Difference and T2DM
Table 2 shows the HR and 95% CIs for diabetes correlation with pulse pressure difference. In the crude model, the HR (95% CI) for diabetes correlation with pulse pressure difference was 1.040 (1.037–1.042), the HR (95% CI) after age and sex adjustments was 1.015 (1.013–1.017), and HR (95% CI), after adjustment for age, BMI, TC, TG, FPG, ALT, BUN, smoking and drinking status, gender, and family history of diabetes, was 1.003 (1.001–1.005), p = <0.05. This indicated that diabetes incidence increased by 0.3% for every 1mmHg increase in PP. In sensitivity analysis, PP processing as a categorical variable (quartiles) revealed a similar trend (p = 0.038).
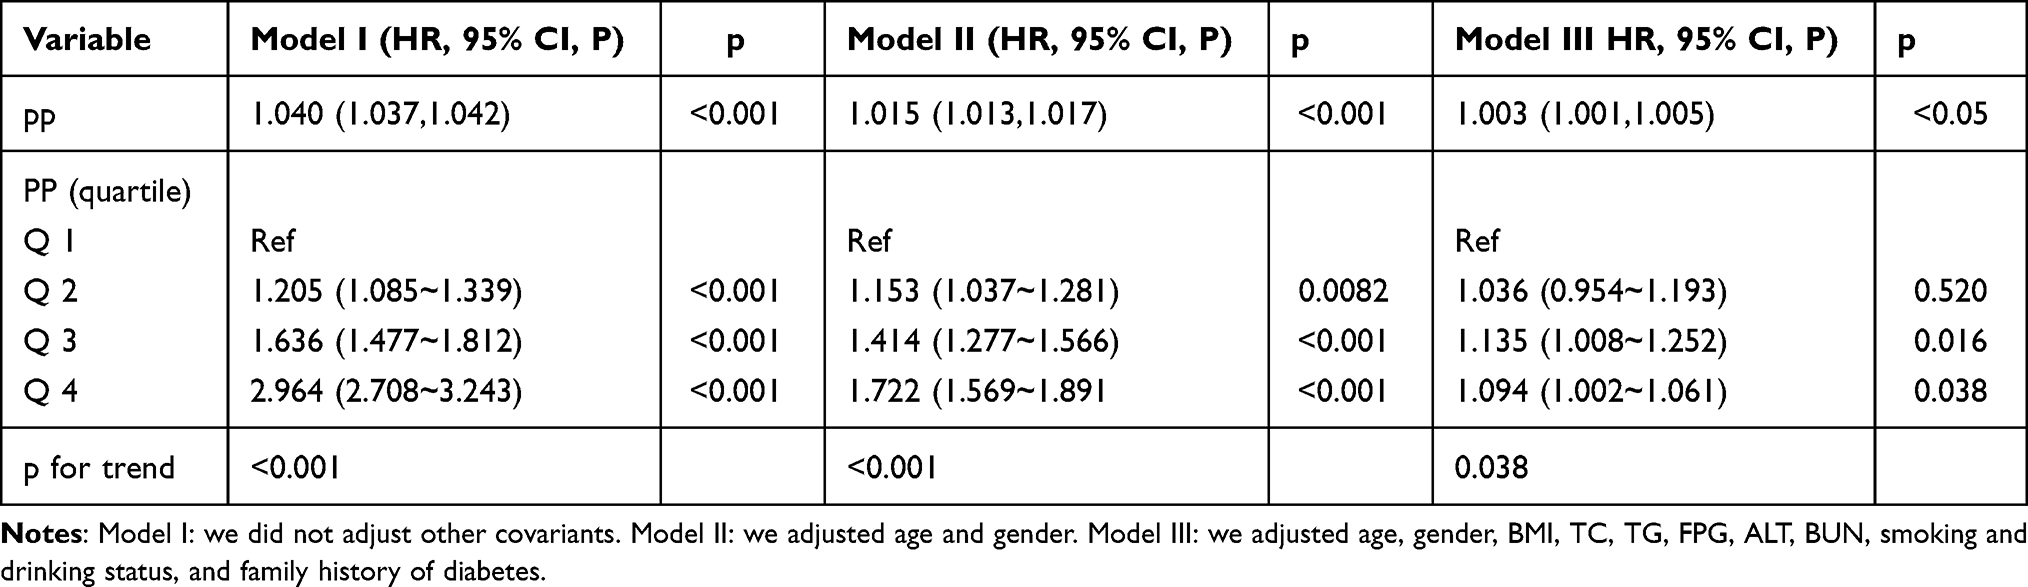 |
Table 2 Relationship Between PP and Risk of Diabetes |
Relationship Between Pulse Pressure Difference and T2DM According to the Smooth Curve Fitting Analysis
To evaluate the relationship between pulse pressure difference and DM, restricted cubic spline smoothing curve fitting was adopted in subsequent analysis (Figure 1) and revealed that PP and T2DM do not have a simple linear relationship. Threshold effect analysis using piecewise linear regression (Table 3) showed that, when PP was ≤35mmHg, the incidence of T2DM negatively correlated with PP [HR 0.972 (0.953,0.972) p = 0.053]. However, when the PP was >35mmHg, T2DM incidence increased with increasing PP [HR 1.044 (1.042, 1.047) p <0.001]. This analysis indicated that the risk of T2DM incidence was lowest when PP was about 35mmHg (Figure 1).
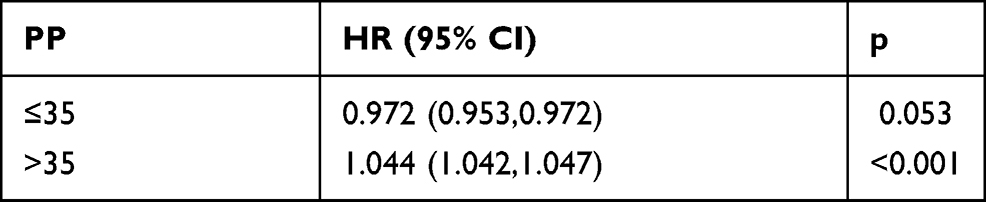 |
Table 3 Relationship Between Pulse Pressure Difference and Diabetes |
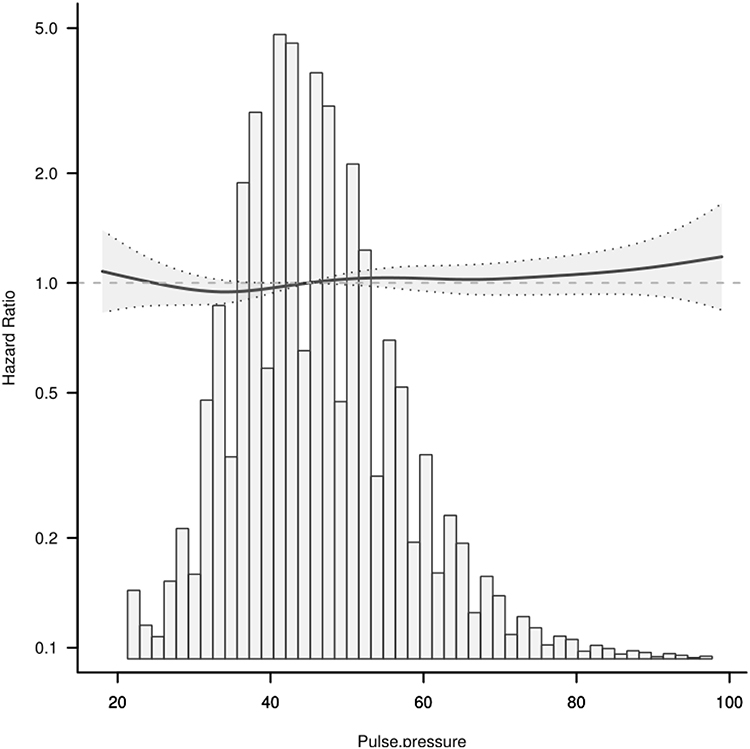 |
Figure 1 Relationship between pulse pressure difference and T2DM. |
Relationship Between Pulse Pressure Difference and Blood Glucose Level in the Final Follow-Up According to the Smooth Curve Fitting Analysis
Fasting blood glucose measured at final follow-up was used as the outcome indicator for sensitivity analysis and revealed a nonlinear relationship between pulse pressure difference and fasting blood glucose at final visit (p =<0.001). Blood glucose level at final visit increased with rising PP (Figure 2).
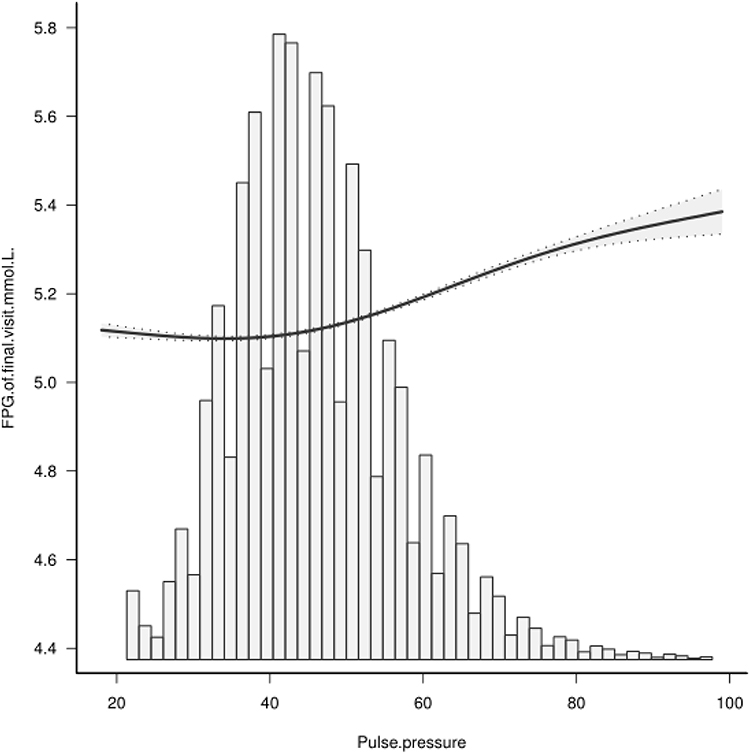 |
Figure 2 Relationship between pulse pressure difference and blood glucose level at the final visit. |
Subgroup Analysis
Subgroup analysis was used to explore other risk factors in the association between PP and T2DM incidence. Adjustment for age, BMI, TC, TG, FPG, ALT, BUN, smoking and drinking status, gender, and family history of diabetes did not reveal significant interactions between family history of diabetes and age. Additive interactions were observed in gender. PP exhibited different trends between males and females (Table 4).
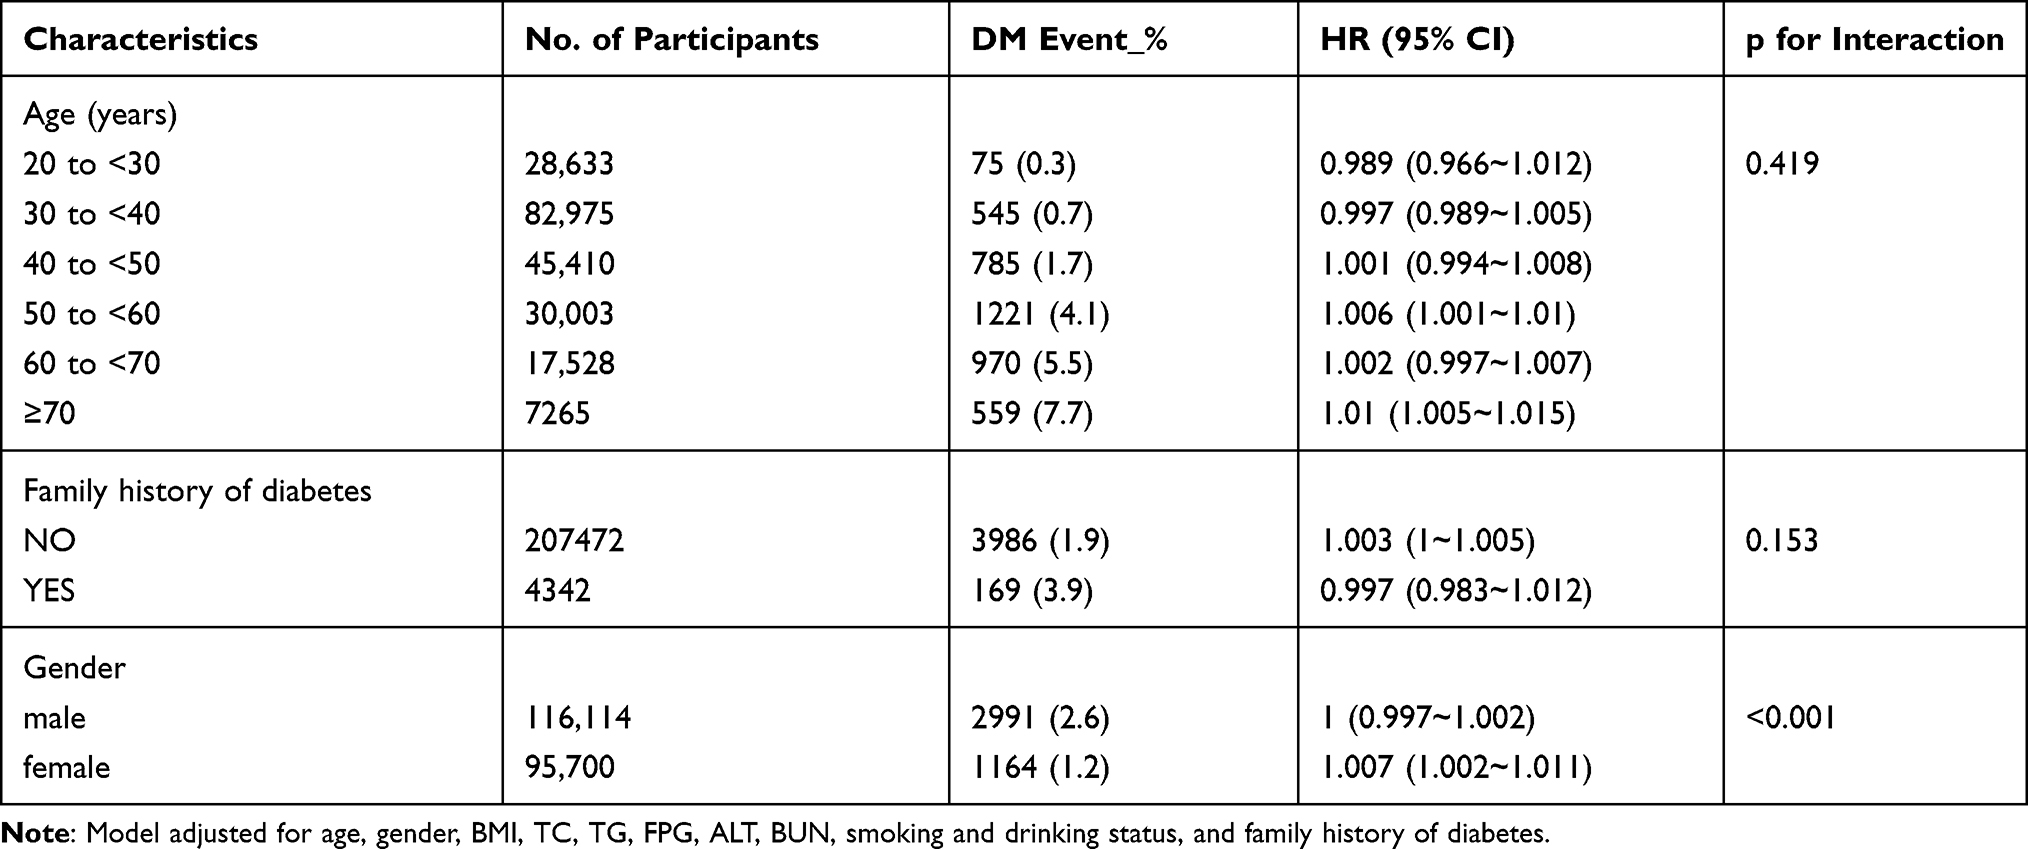 |
Table 4 Effect of PP on Diabetes Risk Stratified by Subgroups |
Discussion
In this retrospective cohort study, adjustment for age, BMI, TC, TG, FPG, ALT, BUN, smoking and drinking status, gender, and family history of diabetes identified increased PP as an independent risk factor for T2DM. Further analysis showed a non-linear association between PP and T2DM risk. When PP was ≤35mmHg, the T2DM incidence negatively correlated with PP. However, when PP was >35mmHg, T2DM incidence increased with increasing PP. The risk of T2DM incidence was lowest when PP was at about 35mmHg.
Pulse pressure (PP), the arithmetic difference between DBP and SBP, is associated with all-cause mortality, cardiovascular events, stroke, kidney injury, severe eye disease, and arterial stiffness18–23 and it is dependent on arterial wall elasticity. A previous study found that relative to BP, PP had higher predictive potential for adverse cardiovascular outcomes in diabetic patients.24,25 Age-related stiffening of large arteries increases pulse pressure. Thus, there is increasing interest in the significance of PP in cardiovascular risk and especially in diabetes.24 Recent research found that individuals with T2DM have increased PP, which may elevate the risk of adverse cardiovascular outcomes.26 The 2017 American Diabetes Association position paper “Diabetes and Hypertension”, documents that an elevated PP (>60mmHg) in older diabetics may elevate the risk of adverse cardiovascular outcomes. However, some studies reported11,27,28 that PP may play vital roles from an early age as a marker of cardiovascular risk and diseased, stiff arteries. Early rise in PP occurs at about 30–39 years of age in these diabetics.29
Pathophysiologically, PP represents the pulsatile component of blood flow and is a marker of arterial stiffness. Arterial stiffness is closely associated with progression of T2DM complications.30 With age, the large arteries stiffen, widening PP. Some studies indicate that arterial stiffness predicts T2DM incidence and that poor glycemic control and dyslipidemia are arterial stiffness determinants in T2DM.31 A longitudinal study found that arterial stiffness precedes increased FBG,32 probably because it is caused by glycation-mediated enhanced vascular aging and artery elasticity decline.33 This is a complex process.
Numerous factors may alter PP, including heart rate, obesity, arterial compliance and distensibility, asymptomatic and symptomatic atherosclerosis, aging, antihypertensive drug use, and presence or absence of hypertension. Previous studies have confirmed that PP negatively correlates with BMI. However, the relationship between BMI and PP differs across populations. Additionally, PP has a different trend in males vs females.34 Sub-analysis by gender revealed different trends in participants aged >40 years and female. Age also strongly influences PP. Some studies show that females aged ≥45 years were more likely to have higher PP values than those aged <45 years.35 Sub-analysis by age revealed that, in participants aged ≥40, diabetes incidence positively correlated with higher PP. The results obtained in this study confirm these data. Elevated PP occurs as a result of age-associated stiffening of large arteries. Previous studies have associated obesity, blood lipids, and increased abdominal circumference with increased PP, probably due to atherosclerosis.36,37 Atherosclerosis causes increased arterial stiffness. PP and arterial stiffness are strongly correlated and increased arterial stiffness can lead to increased PP.38 Patients with diabetes also have a predilection for atherosclerosis.39
We sought to determine the association between PP and T2DM to guide T2DM prognosis. The study is based on a large cohort to ensure the reliability and robustness of results. However, the study has some limitations. First, the lack of experimental OGTT may have led to diabetes underestimation. Second, data on asymptomatic and symptomatic atherosclerosis, antihypertensive drug use, and presence or absence of hypertension are not available in the database. Thus, sub-analysis based on the absence or presence of hypertension or antihypertensive drug use could not be done. Future studies should prospectively assess the relationship between these potential residual confounding factors and diabetes risk.
Conclusion
In this study of Chinese adults, we found that increased PP independently correlates with higher risks for developing T2DM. T2DM risk was lowest when PP was at about 35mmHg. At PP = >35mmHg, blood glucose level at final visit rose with increasing pulse pressure.
Abbreviations
BMI, Body mass index; FPG, Fasting plasma glucose; TG, Triglyceride; TC, Total cholesterol; HDL-C, high density lipoprotein cholesterol; LDL-C, Low density lipoprotein cholesterol; BUN, Blood urea nitrogen; ALT, Alanine aminotransferase; AST, Aspartate aminotransferase; DBP, Diastolic blood pressure; SBP, Systolic blood pressure; PP, Pulse pressure; HR, Hazard ratios; CI, Confidence interval; SD, Standardized difference; DM, Diabetes mellitus; T2DM, Type 2 diabetes mellitus.
Data Sharing Statement
Data can be downloaded from the “DATADRYAD” database (www.Datad ryad.org), shared by Chen et al. Dryad Digital Repository. http://dx.doi.org/10.1136/bmjopen-2018-021768.
Ethics Approval and Consent to Participate
This work is a secondary data analysis based on previously published data that was approved by the Rich Healthcare Group Review Board in China. Research ethics approval was obtained for the previous study and was not required for the present study. Patient consent was also not required, referencing the previous study articles.
Acknowledgments
We appreciate Dr Ying Chen et al. for sharing their scientific knowledge.
Author Contributions
All authors made a significant contribution to the work reported, whether that is in the conception, study design, execution, acquisition of data, analysis and interpretation, or in all these areas; took part in drafting, revising or critically reviewing the article; gave final approval of the version to be published; have agreed on the journal to which the article has been submitted; and agree to be accountable for all aspects of the work.
Disclosure
All authors states that there is no conflict of interest.
References
1. Yokoyama M, Watanabe T, Otaki Y, et al. Association of the aspartate aminotransferase to alanine aminotransferase ratio with BNP level and cardiovascular mortality in the general population: the Yamagata study 10-year follow-up. Dis Markers. 2016;2016:1–9. doi:10.1155/2016/4857917
2. Yoon KH, Lee JH, Kim JW, et al. Epidemic obesity and type 2 diabetes in Asia. Lancet. 2006;368(9548):1681–1688. doi:10.1016/S0140-6736(06)69703-1
3. Global Burden of Metabolic Risk Factors for Chronic Diseases Collaboration. Cardiovascular disease, chronic kidney disease, and diabetes mortality burden of cardiometabolic risk factors from 1980 to 2010: a comparative risk assessment. Lancet Diabetes Endocrinol. 2014;2(8):634–647. doi:10.1016/S2213-8587(14)70102-0
4. Seuring T, Archangelidi O, Suhrcke M. The economic costs of type 2 diabetes: a global systematic review. Pharmacoeconomics. 2015;33(8):811–831. doi:10.1007/s40273-015-0268-9
5. Shaw JE, Sicree RA, Zimmet PZ. Global estimates of the prevalence of diabetes for 2010 and 2030. Diabetes Res Clin Pract. 2010;87(1):4–14. doi:10.1016/j.diabres.2009.10.007
6. Safar ME, Nilsson PM, Blacher J, et al. Pulse pressure, arterial stiffness, and end-organ damage. Curr Hypertens Rep. 2012;14(4):339–344. doi:10.1007/s11906-012-0272-9
7. Assmann G, Schulte H. The Prospective Cardiovascular Munster (PRO-CAM) study: prevalence of hyperlipidemia in persons with hypertension and/or diabetes mellitus and the relationship to coronary heart disease. Am Heart J. 1988;116(6 Pt 2):1713–1724. doi:10.1016/0002-8703(88)90220-7
8. Somaratne JB, Whalley GA, Poppe KK, et al. Screening for left ventricular hypertrophy in patients with type 2 diabetes mellitus in the community. Cardiovasc Diabetol. 2011;10:29. doi:10.1186/1475-2840-10-29
9. Govind S, Saha S, Brodin LA, Ramesh SS, Arvind SR, Quintana M. Impaired myocardial functional reserve in hypertension and diabetes mellitus without coronary artery disease: searching for the possible link with congestive heart failure in the myocardial Doppler in diabetes (MYDID) study II. Am J Hypertens. 2006;19(8):
10. Schram MT, Kostense PJ, van Dijk RAJM, et al. Diabetes, pulse pressure and cardiovascular mortality: the Hoorn Study. J Hypertens. 2002;20(9):1743–1751. doi:10.1097/00004872-200209000-00017
11. Schram MT, Chaturvedi N, Fuller JH, Stehouwer CD; EURODIAB Prospective Complications Study Group. Pulse pressure is associated with age and cardiovascular disease in type 1 diabetes: the Eurodiab Prospective Complications Study. J Hypertens. 2003;21:2035–2044. doi:10.1097/00004872-200311000-00012
12. Huo X, Gao L, Guo L, et al. Risk of non-fatal cardiovascular diseases in early-onset versus late-onset type 2 diabetes in China: a cross-sectional study. Lancet Diabetes Endocrinol. 2016;4(2):115–124. doi:10.1016/S2213-8587(15)00508-2
13. Li L, Ji L, Guo X, et al. Prevalence of microvascular diseases among tertiary care Chinese with early versus late onset of type 2 diabetes. J Diabetes Complications. 2015;29(1):32–37. doi:10.1016/j.jdiacomp.2014.08.010
14. Song SH. Emerging type 2 diabetes in young adults. Adv Exp Med Biol. 2012;771:51–61.
15. Hypertension in Diabetes Study (HDS). Prevalence of hypertension in newly presenting type 2 diabetic patients and the association with risk factors for cardiovascular and diabetic complications. J Hypertens. 1993;11(3):309–317. doi:10.1097/00004872-199303000-00012
16. Pechère-Bertschi A, Greminger P, Hess L, Philippe J, Ferrari P. Swiss Hypertension and Risk Factor Program (SHARP): cardiovascular risk factors management in patients with type 2 diabetes in Switzerland. Blood Press. 2005;14(6):337–344. doi:10.1080/08037050500340018
17. Chen Y, Zhang X, Yuan J, et al. Association of body mass index and age with incident diabetes in Chinese adults: a population-based cohort study. BMJ Open. 2018;8(9):e21768. doi:10.1136/bmjopen-2018-021768
18. Yamamoto M, Fujihara K, Ishizawa M, et al. Pulse pressure is a stronger predictor than systolic blood pressure for severe eye diseases in diabetes mellitus. J Am Heart Assoc. 2019;8(8):e010627. doi:10.1161/JAHA.118.010627
19. Al-Qamari A, Adeleke I, Kretzer A, Hogue CW. Pulse pressure and perioperative stroke. Curr Opin Anaesthesiol. 2019;32(1):57–63. doi:10.1097/ACO.0000000000000673
20. Li J, Huang JY, Lo K, Zhang B, Huang YQ, Feng YQ. Association of pulse pressure with all-cause mortality in young adults. Postgrad Med J. 2020;96(1138):461–466. doi:10.1136/postgradmedj-2019-137070
21. St-Louis E, Sudarshan M, Al-Habboubi M, et al. The outcomes of the elderly in acute care general surgery. Eur J Trauma Emerg Surg. 2016;42:107–13.A. doi:10.1007/s00068-015-0517-9
22. Brown C, Neuman MD. Optimizing perioperative care for older adults. Anesthesiol Clin. 2015;33(3):xv–xvi. doi:10.1016/j.anclin.2015.06.001
23. Gavish B, Bursztyn M. Ambulatory pulse pressure components: concept, determination and clinical relevance. J Hypertens. 2019;37(4):765–774. doi:10.1097/HJH.0000000000001920
24. Kodama S, Horikawa C, Fujihara K, et al. Meta-analysis of the quantitative relation between pulse pressure and mean arterial pressure and cardiovascu- lar risk in patients with diabetes mellitus. Am J Cardiol. 2014;113:1058–1065. doi:10.1016/j.amjcard.2013.12.005
25. Payne RA, Wilkinson IB, Webb DJ. Arterial stiffness and hypertension: emerging concepts. Hypertension. 2010;55(1):9–14. doi:10.1161/HYPERTENSIONAHA.107.090464
26. De Boer IH, Bangalore S, Benetos A, et al. Diabetes and hypertension: a position statement by the American diabetes association. Diabetes Care. 2017;40(9):1273–1284. doi:10.2337/dci17-0026
27. Guo J, Muldoon MF, Brooks MM, Orchard TJ, Costacou T. Prognostic significance of pulse pressure and other blood pressure components for coronary artery disease in type 1 diabetes. Am J Hypertens. 2019;32(11):1075–1081. doi:10.1093/ajh/hpz099
28. Gordin D, Wadén J, Forsblom C, et al.; FinnDiane Study Group. Pulse pressure predicts incident cardiovascular disease but not diabetic nephropathy in patients with type 1 diabetes (The FinnDiane Study). Diabetes Care. 2011;34:886–891. doi:10.2337/dc10-2013
29. Franklin SS, Gustin W
30. Prenner SB, Chirinos JA. Arterial stiffness in diabetes mellitus. Atherosclerosis. 2015;238(2):370–379. doi:10.1016/j.atherosclerosis.2014.12.023
31. Monteiro CI, Simões RP, Goulart CL, Silva CDD, Borghi-Silva A, Mendes RG. Arterial stiffness in type 2 diabetes: determinants and indication of a discriminative value. Clinics. 2021;76:e2172. doi:10.6061/clinics/2021/e2172
32. Zheng M, Zhang X, Chen S, et al. Arterial stiffness preceding diabetes: a Longitudinal Study. Circ Res. 2020;127(12):1491–1498. doi:10.1161/CIRCRESAHA.120.317950
33. Guo J, Fujiyoshi A, Willcox B, et al; ERA JUMP Study Group. Increased aortic calcification is associated with arterial stiffness progression in multiethnic middle-aged men. Hypertension. 2017;69(1):102–108. doi:10.1161/HYPERTENSIONAHA.116.08459
34. Kang MG, Kim K-H, Koh J-S, et al. Association between pulse pressure and body mass index in hypertensive and normotensive populations in the Korea National Health and Nutrition Examination Survey V, 2010–2012. J Clin Hypertens. 2017;19(4):395–401. doi:10.1111/jch.12935
35. Lieber A, Millasseau S, Bourhis L, et al. Aortic wave reflection in women and men. Am J Physiol Heart C. 2010;299(1):H236–H242. doi:10.1152/ajpheart.00985.2009
36. De Pergola G, Nardecchia A, Ammirati A, Caccavo D, Bavaro S, Silvestris F. Abdominal obesity is characterized by higher pulse pressure: possible role of free triiodothyronine. J Obes. 2012;2012:656303. doi:10.1155/2012/656303
37. Agoşton-Coldea L, Mocan T, Bobar C. Arterial stiffness and left ventricular diastolic function in the patients with hypertension. Rom J Intern Med. 2008;46(4):313–321.
38. Said MA, Eppinga RN, Lipsic E, Verweij N, van der Harst P. Relationship of arterial stiffness index and pulse pressure with cardiovascular disease and mortality. J Am Heart Assoc. 2018;7:2. doi:10.1161/JAHA.117.007621
39. Guaricci AI, De Santis D, Carbone M, et al. Coronary atherosclerosis assessment by coronary CT angiography in asymptomatic diabetic population: a critical systematic review of the literature and future perspective. BioMed Res Int. 2018;2018:8927281. doi:10.1155/2018/8927281
 © 2021 The Author(s). This work is published and licensed by Dove Medical Press Limited. The full terms of this license are available at https://www.dovepress.com/terms.php and incorporate the Creative Commons Attribution - Non Commercial (unported, v3.0) License.
By accessing the work you hereby accept the Terms. Non-commercial uses of the work are permitted without any further permission from Dove Medical Press Limited, provided the work is properly attributed. For permission for commercial use of this work, please see paragraphs 4.2 and 5 of our Terms.
© 2021 The Author(s). This work is published and licensed by Dove Medical Press Limited. The full terms of this license are available at https://www.dovepress.com/terms.php and incorporate the Creative Commons Attribution - Non Commercial (unported, v3.0) License.
By accessing the work you hereby accept the Terms. Non-commercial uses of the work are permitted without any further permission from Dove Medical Press Limited, provided the work is properly attributed. For permission for commercial use of this work, please see paragraphs 4.2 and 5 of our Terms.