")
Back to Journals » International Journal of Women's Health » Volume 14
Association of Premenstrual Syndrome with Adiposity and Nutrient Intake Among Young Indian Women
Authors Thakur H , Pareek P, Sayyad MG, Otiv S
Received 1 February 2022
Accepted for publication 12 April 2022
Published 4 May 2022 Volume 2022:14 Pages 665—675
DOI https://doi.org/10.2147/IJWH.S359458
Checked for plagiarism Yes
Review by Single anonymous peer review
Peer reviewer comments 3
Editor who approved publication: Professor Elie Al-Chaer
Harshada Thakur,1 Priyanka Pareek,2 Mehmood G Sayyad,3 Suhas Otiv4
1Department of Nutrition and Dietetics, Symbiosis School of Biological Sciences, Symbiosis International (Deemed University), Pune, India; 2Department of Clinical Nutrition, MGM School of Biomedical Sciences, MGMIHS, Navi Mumbai, India; 3Department of Statistics, Abeda Inamdar Senior College, Pune, India; 4Department of Obstetrics and Gynecology, KEM Hospital and Research Centre, Pune, India
Correspondence: Harshada Thakur, Department of Nutrition and Dietetics, Symbiosis School of Biological Sciences, Symbiosis International (Deemed University), Lavale, Pune, 412115, India, Tel +91 9881502792, Email [email protected]
Abstract: Premenstrual syndrome (PMS) refers to a heterogenous group of symptoms occurring in luteal phase of the menstrual cycle. Women of childbearing age are affected by PMS, and it may impact their quality of life. Various factors related to the biology of menstruation, hormones, and lifestyle are associated with PMS.
Purpose: To explore the incidence and severity of PMS among students in India and its correlation with nutrient intake, adiposity, and lifestyle factors.
Methods: A semi-structured questionnaire was used to collect data on menstrual pattern, nutrient intake, dietary habits, and physical activity. Moose’s Menstrual Distress Questionnaire and Premenstrual Symptoms Screening Tool were employed for the identification and classification of PMS. Anthropometric indices included height, weight, body mass index, waist circumference, hip circumference, waist-to-hip ratio, and four-site skinfold thickness—tricep, bicep, subscapular, and suprailiac.
Results: Of the 330 participants, 71.3% reported to have experienced at least one symptom of PMS. Furthermore, 46.9% had mild PMS, 31.5% had moderate PMS, 8.3% had strong PMS, and 13.3% had no symptoms. Anxiety and irritability were the most observed symptoms. The mean body mass index (BMI) of the participants was within the normal range (21.76 ± 4.81 kg/m2); however, body fat percentage was above the normal range (33.95% ± 4.89%). PMS severity was significantly correlated with body fat percentage and BMI. Nutrient intake was significantly lower than the recommended dietary allowance (RDA), but dietary fat consumption was higher than the RDA. Protein intake was higher in participants with mild PMS than those with moderate and severe PMS (p< 0.05). An inverse association between oilseed consumption and PMS was observed.
Conclusion: PMS was associated with anthropometric parameters, nutrient intake, and dietary preference. PMS showed correlation with the intake of calorie-rich foods, sweets, and fried salted snacks, whereas consumption of oilseeds alleviated its incidence.
Keywords: premenstrual syndrome, adiposity, dietary habits, nutrient intake, lifestyle factors
Introduction
Premenstrual syndrome (PMS) is a condition in which certain symptoms arise during the late luteal phase of menstruation and disappear when menstruation commences. The World Health Organization (WHO) has classified PMS under the 10th revision of the International Classification of Diseases (ICD-10).1 This condition can be experienced by any woman of childbearing age. The most experienced symptoms include irritability, anxiety, breast pain, and body aches. The symptoms are well defined and have been studied widely.2 The American College of Obstetrics and Gynecology has defined PMS as the cyclic occurrence of symptoms that are sufficiently severe to interfere with some aspects of life, and that appear with a consistent and predictable relationship to the menses.3 Approximately 80–95% of women of childbearing age experience some form of PMS. However, 3–8% of women may experience a severe form of PMS, known as premenstrual dysphoric disorder (PMDD).4–6 PMDD is an intense form of PMS with predominantly psychological symptoms. The symptoms of PMS and PMDD have been well described by many researchers. The interaction of ovarian hormones with brain neurotransmitters could be one of the pathophysiologies.7 Many experts have opined that PMS is caused by a combination of genetic, hormonal, psychological, dietary, and behavioral factors.8 Irritability, nervousness or anxiety, mood changes, reduced concentration, and sleep problems are the common psychological signs of PMS. The common physiological symptoms include abdominal bloating, breast pain or tenderness, weight gain, tiredness, appetite changes, and food cravings.3,4,9 Nutraceutical therapy and other natural approaches have been documented to alleviate the symptoms.10,11 The inclusion of probiotic sources has been researched for its role in other gynecological diseases, such as polycystic ovarian syndrome (PCOS).12 Researchers have surveyed the impacts of dietary habits, nutritional supplementation, and lifestyle modifications on PMS.5,13 Although menstruation is a natural biological phenomenon, it is considered as “unclean” or as a “problem,” and several taboos associated with it prevail in many parts of India. Health issues related to the menstrual cycle, such as irregular menses, painful menses, and premenstrual syndrome, cannot be discussed openly under these circumstances. Nutritional status, diverse anthropometric indices indicating adiposity, and several lifestyle factors impact the overall health of women. Moreover, issues linked to the menstrual cycle, including PMS, affect women’s health. Most research on PMS has been conducted in the West or Far East, and very few studies have been performed in India. Cultural variations influence the disease phenomena and lifestyle. Therefore, this observational study was aimed at understanding PMS in the context of body composition, adiposity, nutrient intake, and lifestyle.
Materials and Methods
This observational study was conducted among women in the age group of 18–24 years who were studying at the Symbiosis International (Deemed) University. The sample size was determined based on the prevalence from a similar study.9 For the power of the study to be 0.9 with a 5% level of significance, the sample size calculated was 330 women aged 18–24 years, unmarried, and apparently healthy. Women who were diagnosed with hypertension, diabetes mellitus, PCOS, or any disorder related to systems and glands were excluded. Moreover, women students who were on medications or hormonal therapy, as advised by a medical practitioner, were excluded.
The study was conducted in agreement with the principles indicated in the Declaration of Helsinki. The research proposal and protocol were approval by the Research Advisory Committee and the Independent Ethics Committee of the Symbiosis International (Deemed) University (SIU/IEC/02122015). Written informed consent was obtained from the willing participants prior to their enrolment in the study. The participants were enrolled from July 2018 to August 2019.
A pilot study was performed to assess the reliability and validity of the data collection instruments and semi-structured questionnaires. The pilot study also aided in ensuring the standardization of the adopted techniques. The questionnaire consisted of the following categories:
Sociodemographic Information
This questionnaire was based on the Kuppuswamy’s Scale for Socioeconomic Status (SES) in India and included information on age, educational status, place of residence, type of accommodation, and family income.14 These variables were scored as per the scale, and the participants were grouped into SES categories.
Menstrual History and PMS Assessment
Age at menarche, days of bleeding during the menstrual cycle, interval between two cycles, and problems related to the length of the menstrual cycle were included in the menstrual history. PMS was assessed as per the diagnostic criteria recommended by ICD-10. Rudolf Moose’s Menstrual Distress Questionnaire (MDQ) comprising 46 PMS symptoms grouped under eight subscales—pain, water retention, autonomic reaction, negative effect, impaired concentration, behavioral changes, arousal, and control—was used.15 The symptoms were rated according to their severity in the luteal phase of the menstrual cycle, and the total raw score was calculated. The scores were compared with the intermenstrual symptom scores to confirm PMS. Steiner’s Premenstrual Symptoms Screening Tool (PSST) was utilized to categorize the participants based on the severity of PMS symptoms.16
Anthropometric Measurements
The participants were instructed to wear light and comfortable clothing for measuring the anthropometric parameters.
Height – A stature meter was used for measuring the height. The participants were made to stand on the footboard of the stature meter without shoes, with their heels, back of knees, buttocks, shoulder blades, and back of head touching the back of the board and the head held in the Frankfurt plane. The height was documented to the closest 0.1 cm.
Weight – Weight was measured using a digital weighing scale. It was ensured that the participants wore light clothing and that the footwear was removed while measuring the weight.
Body mass index (BMI) – BMI was calculated using the Quetlet’s formula: BMI = Weight (kg)/Height (m)2, and the participants were classified into BMI categories for Asians.17
Waist and hip circumference – For measuring the circumferences, a non-stretchable fiberglass tape was used. The waist circumference is one of the indicators of central obesity, and it was measured at the midpoint between the lower rib cage and iliac crest. The hip circumference was measured at the level of maximum extension of the buttocks while the participant stood upright, with the feet held together. The waist-to-hip ratio (WHR) was calculated as waist circumference (cm) divided by hip circumference (cm).18 Similarly, waist-to-height ratio (WHtR) was computed as waist circumference (cm) divided by height (cm).
Skinfold thickness (SFT) – The skinfold thickness was measured at four sites: triceps, bicep, subscapular, and suprailiac. SFT was measured using the Harpenden skinfold caliper. First, body density was calculated using the sum of the skinfolds and Durnin and Womersley’s equation. Body fat percentages were derived from the body density using Siri’s equation.19,20
Dietary Habits and Nutrient Intake
A 3-day-diet recall was recorded, including one weekend, which included the consumption of foods and beverages for 3 consecutive days. Time of meal intake, total meals consumed per day, and quantity of each food item were documented. Food Frequency Questionnaire (FFQ) was also used to assess nutrient intake. The questionnaire consisted of 70 food items grouped as fruits, green leafy vegetables, pulses, sprouts, milk and milk products, Indian sweets, confectionaries, fried and savory snacks (common street foods), and fast foods.21 Macronutrient and micronutrient intake was calculated using the DietCal software version 5.0.
Physical Activity Level (PAL)
Modified International Physical Activity Questionnaire was used to assess the duration of each physical activity per day. Energy expenditure over a period of 24 hours was calculated using the appropriate metabolic equivalent (MET) for each activity. PAL was calculated as the ratio of total energy expenditure (TEE) and basal metabolic rate (BMR).22
Statistical Analysis
Statistical analysis was performed using the Statistical Package for Social Sciences (SPSS) software v. 16.0 for MS Windows. The STROBE guidelines were followed to report the analysis. Descriptive statistics was applied to present the data in the form of mean, standard deviation, number of counts, and percentages, as appropriate. Pearson’s correlation was employed to assess the linear relationship between the variables, and Spearman rank–order correlation was used for associations between ordinal/categorical and continuous variables. Paired t-test and analysis of variance were applied for comparisons between variables. Statistical significance was set at p < 0.05.
Results
The mean age of the study participants was 20.08 ± 1.25 years (range: 18–24 years). Of the total participants, 237 (72%) were pursuing undergraduate studies and the remaining 93 (28%) were studying at the postgraduation level. The detailed characteristics of the study participants are presented in Table 1.
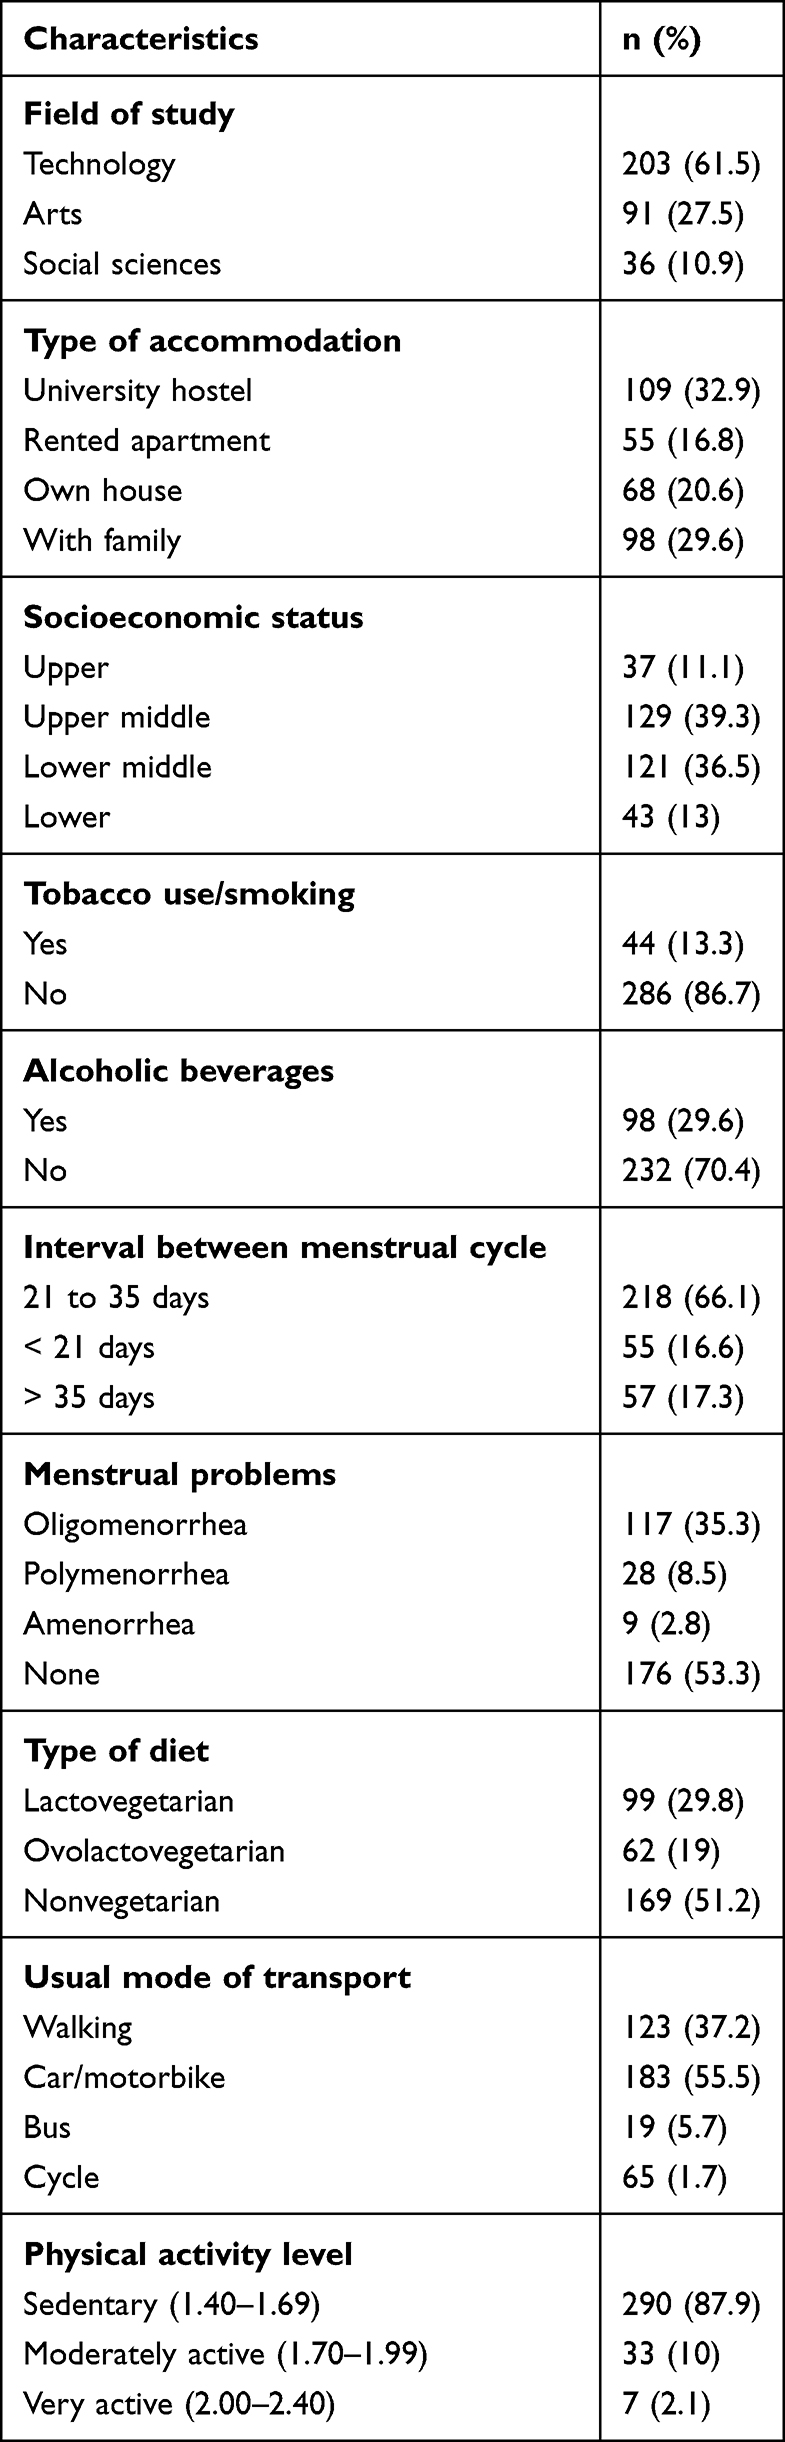 |
Table 1 Characteristics of the Participants (n = 330) |
The time spent on sedentary activities was 162.2 ± 70.7 minutes/day, moderate activities was 18.01 ± 8.7 minutes/day, and household chores was 33.79 ± 6.15 minutes/day. Significant differences were not seen in the time spent on various activities among the participants belonging to the three PMS categories. Furthermore, alcohol consumption and smoking were not associated with the occurrence or severity of PMS symptoms.
Menstrual History and PMS
The findings showed that in 66.1% of the participants, the menstrual cycle interval was 21–35 days; 17.3% had longer menstrual cycles, and 16.6% had shorter cycles. The mean age of menarche was 13.0 ± 1.25 years. Moreover, 236 (71.39%) participants experienced at least one PMS symptom. With regard to the MDQ scores, 155 (46.9%) had mild PMS, 104 (31.5%) had moderate PMS, 27 (8.3%) had strong PMS, and 44 (13.3%) participants had no symptoms at all.15 Table 2 lists the frequencies of PMS symptoms of varied severity.
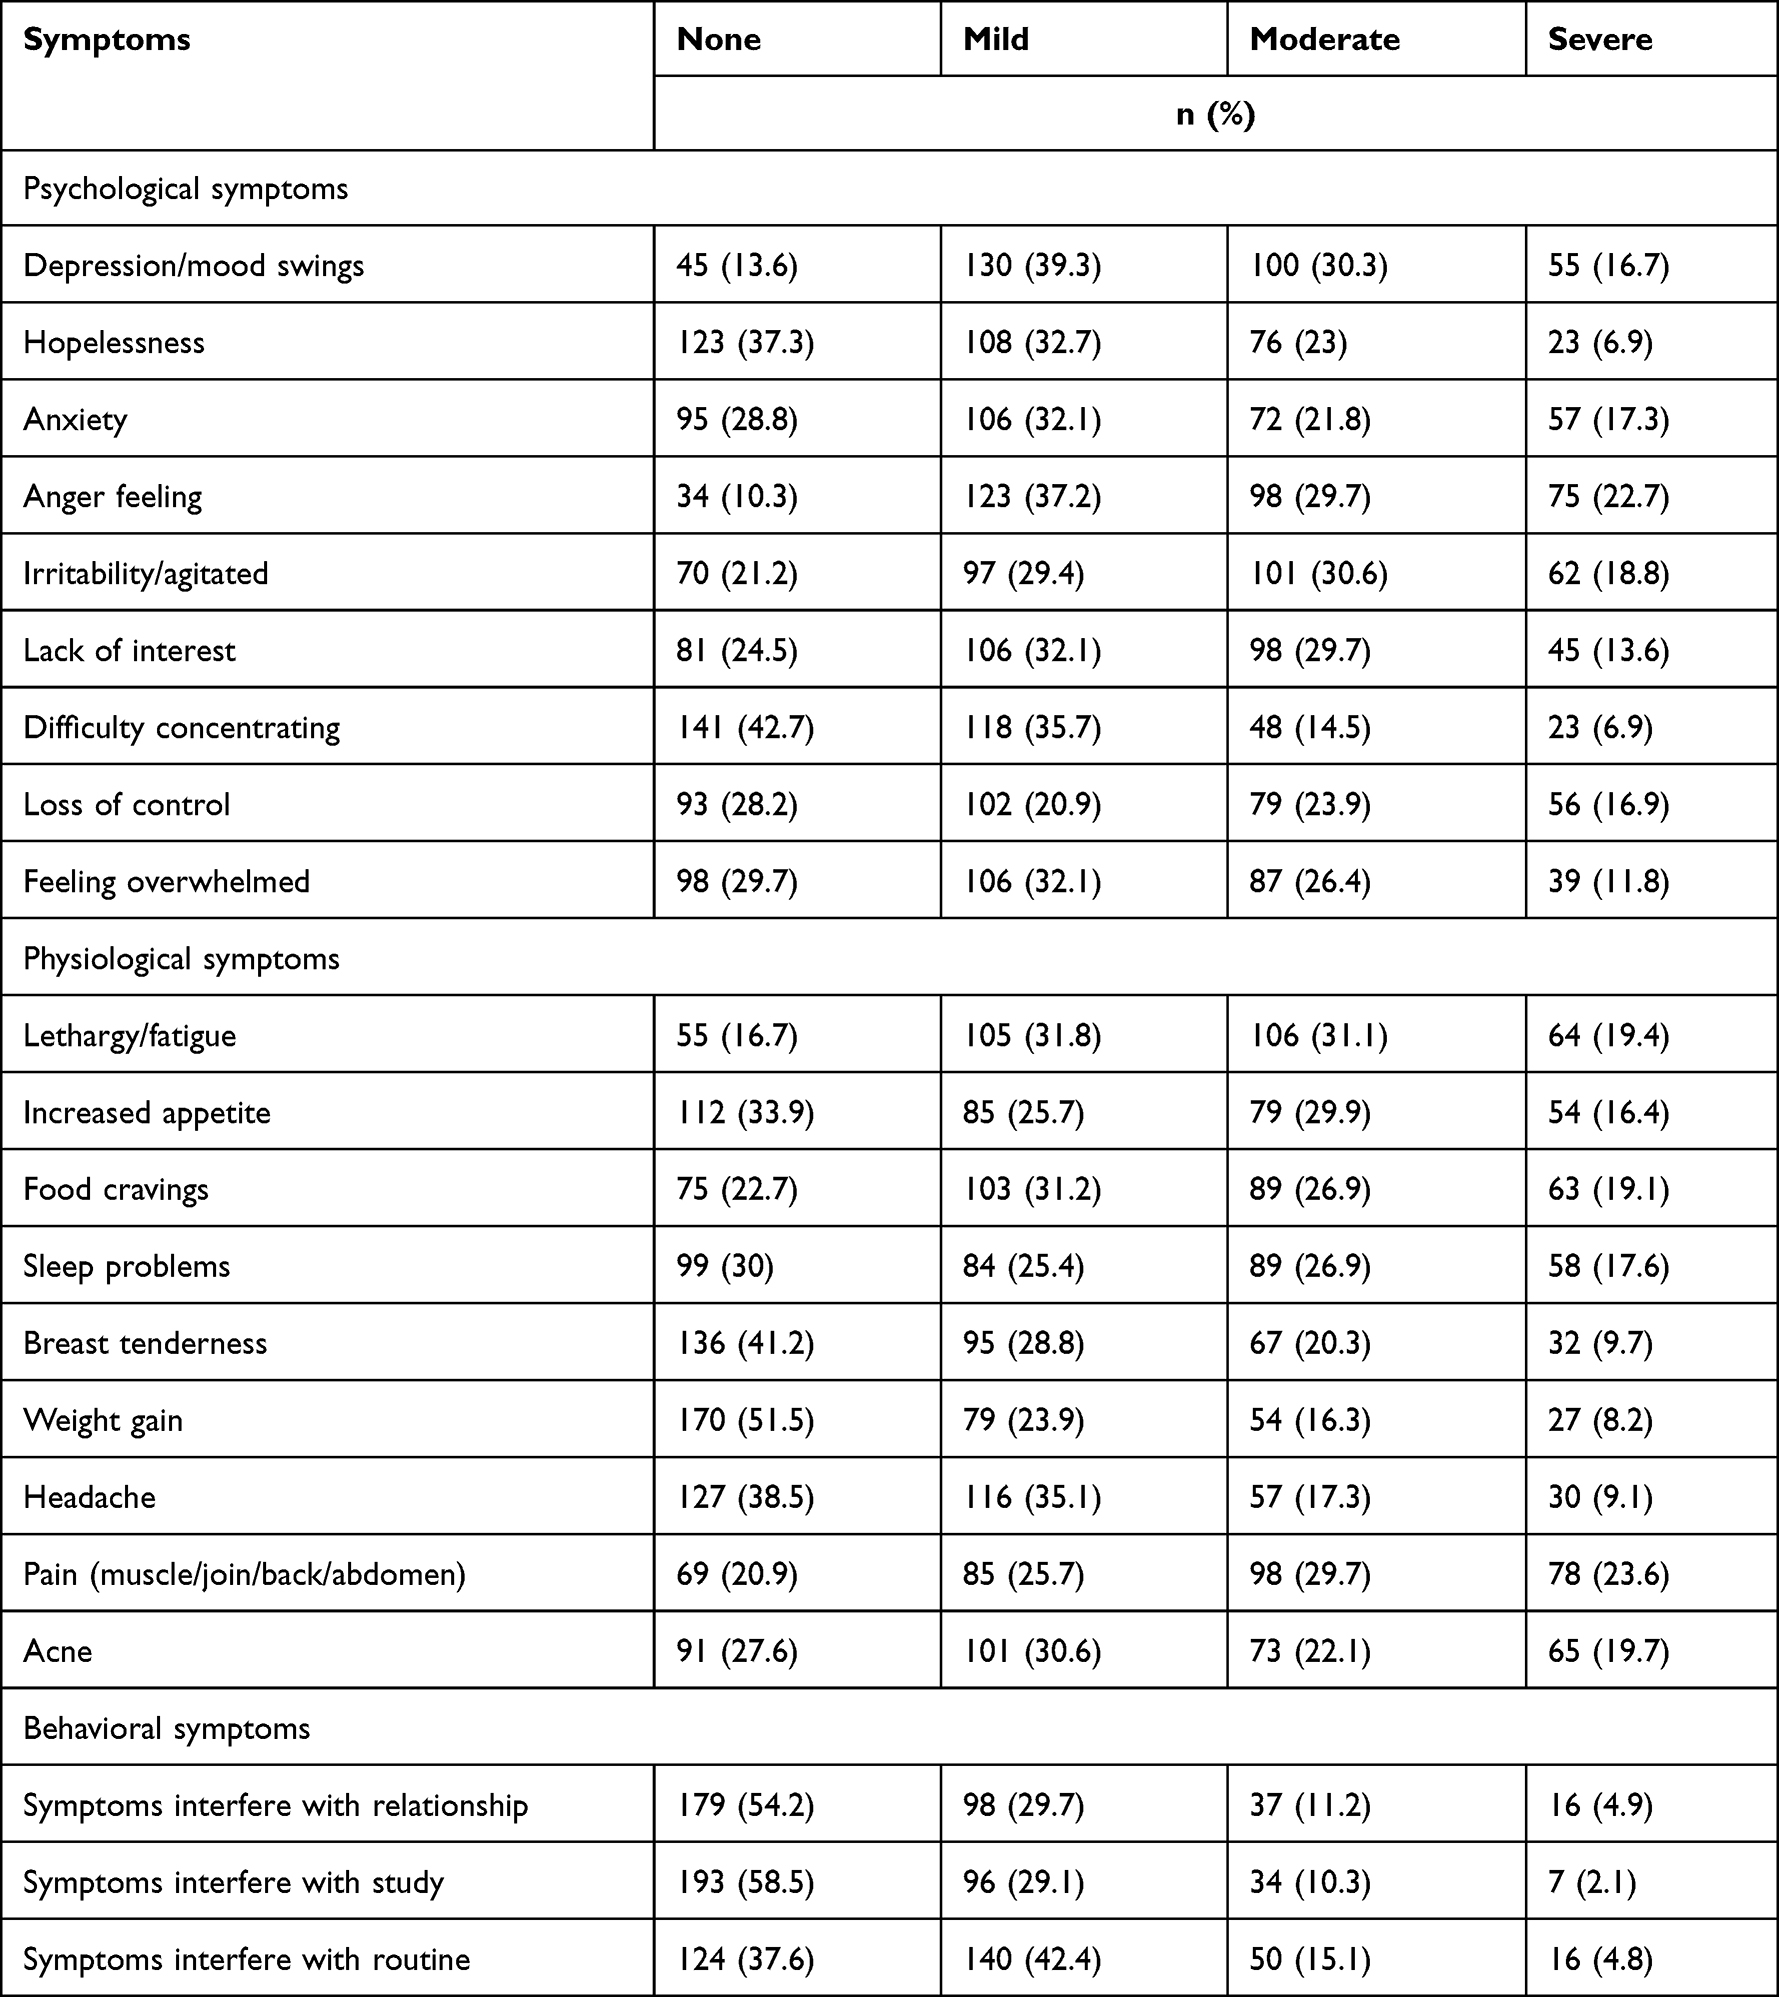 |
Table 2 Frequency of PMS Symptoms and Severity (n = 330) |
Anthropometric Indices
The mean body fat percentage was significantly different among the three PMS categories of mild, moderate, and severe.15,16 Similarly, significant differences were noted in weight, BMI, tricep, subscapular, and suprailiac skinfold thicknesses, and a sum of skinfolds. Leaner participants with lower circumferences and skinfold thicknesses experienced milder PMS symptoms compared with those in the severe PMS category. The anthropometric measurements of the participants are described in Table 3.
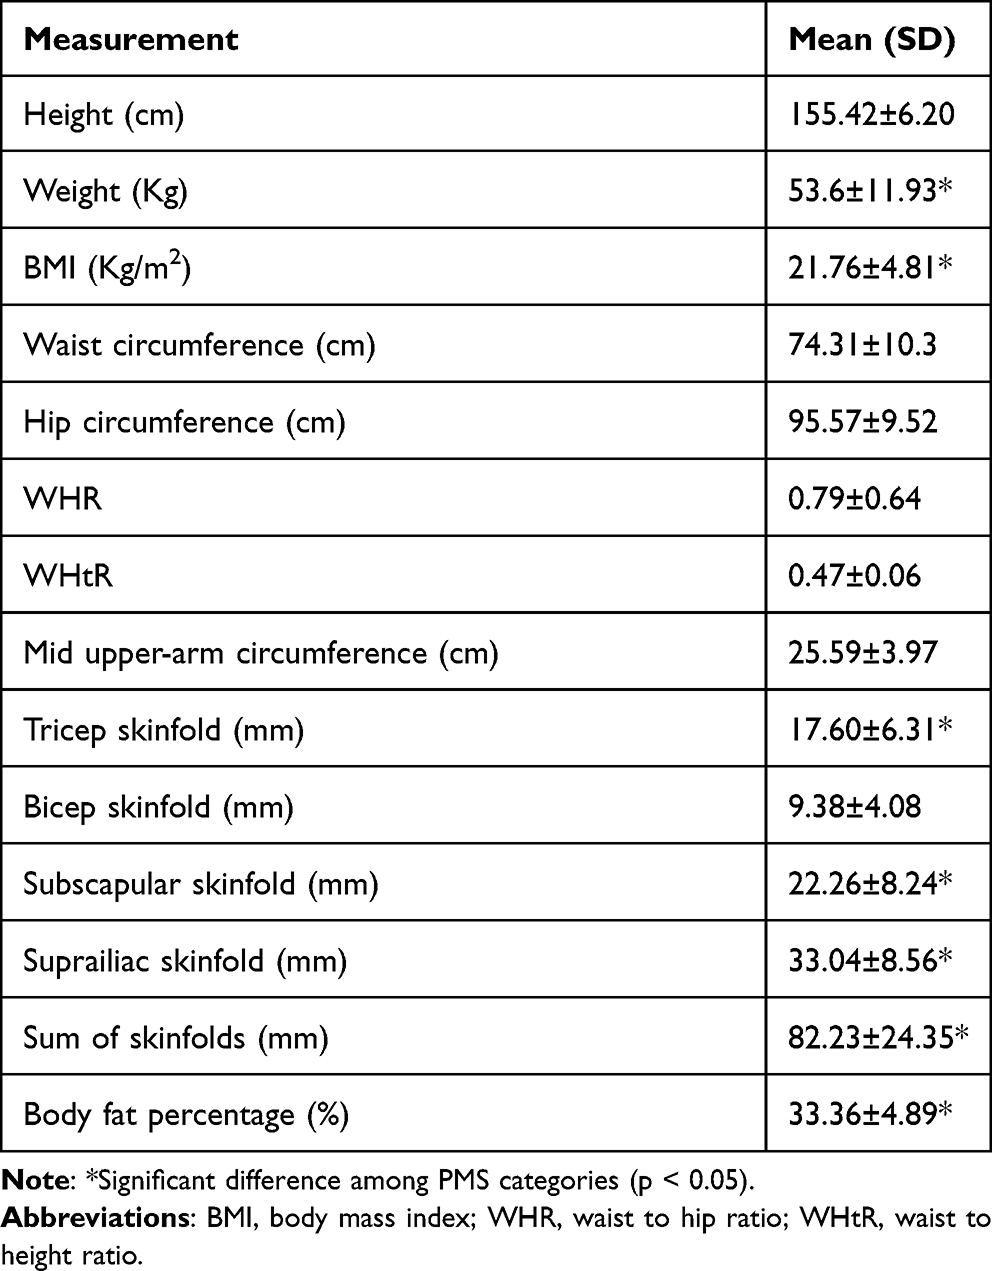 |
Table 3 Anthropometric Measurements of the Participants (n = 330) |
Figure 1 illustrates the BMI categories of the participants. One third of the participants (132, 39.9%) had normal BMI, 65 (19.9%) were underweight, 85 (25.6%) were overweight, 25 (7.6%) had grade I obesity, and 23 (7.1%) had grade II obesity according to the BMI cutoffs for Asians.17
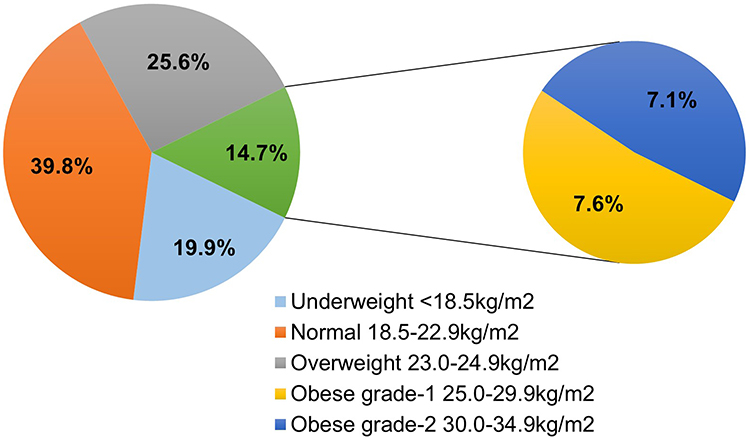 |
Figure 1 Participants across the BMI categories (n = 330). Abbreviation: BMI, body mass index. |
Dietary Habits and Lifestyle Factors
Assessment of the dietary habits revealed that 169 (51.2%) were nonvegetarians, 98 (29.9%) were lactovegetarians, and 63 (19%) were ovolactovegetarians. Significant differences were not observed in the occurrence or severity of PMS across the types of diet consumed. However, the type of diet was negatively correlated with some symptoms of PMS individually, such as decreased interest in home activities (p < 0.01), decreased interest in social activities (p < 0.05), hypersomnia (p < 0.05), and anxiety and fearfulness (p < 0.05). This observation indicated that lactovegetarians and ovolactovegetarians participants experienced milder PMS symptoms than those who consumed a nonvegetarian diet.
Figure 2 depicts the actual nutrient intake of the participants with reference to the RDA. The energy consumption was 1494 ± 466 Kcal per day, which was less than the RDA. Similarly, the intakes of proteins, dietary fibers, calcium, iron, vitamin C, and vitamin B12 were significantly deficient. Carbohydrate consumption was slightly higher than the RDA, probably because cereals and millets are the staple foods in India. However, fat consumption was significantly higher than the recommended value (p < 0.01). No difference was observed in energy intake between the weekdays and weekends, but the intakes of fat and carbohydrate were significantly higher on the weekend than on the weekdays (p < 0.01). Protein intake was significantly higher in participants with mild PMS than in those with moderate and severe PMS (p < 0.05). However, in all three categories of PMS, protein intake was less than the RDA.
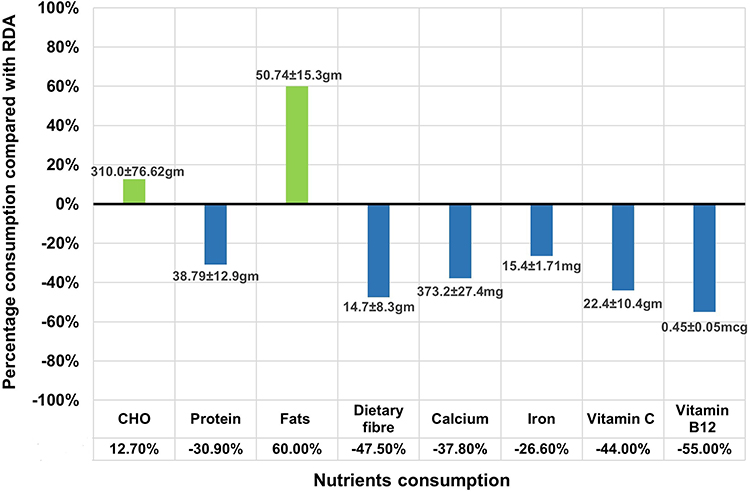 |
Figure 2 Nutrient intake compared with RDA (n = 330). Abbreviations: RDA, recommended dietary allowance; CHO, carbohydrates. |
Table 4 describes the Pearson’s correlation, which indicated the significant correlation of PMS with the consumption of sweets, fried savory foods, and fast foods.
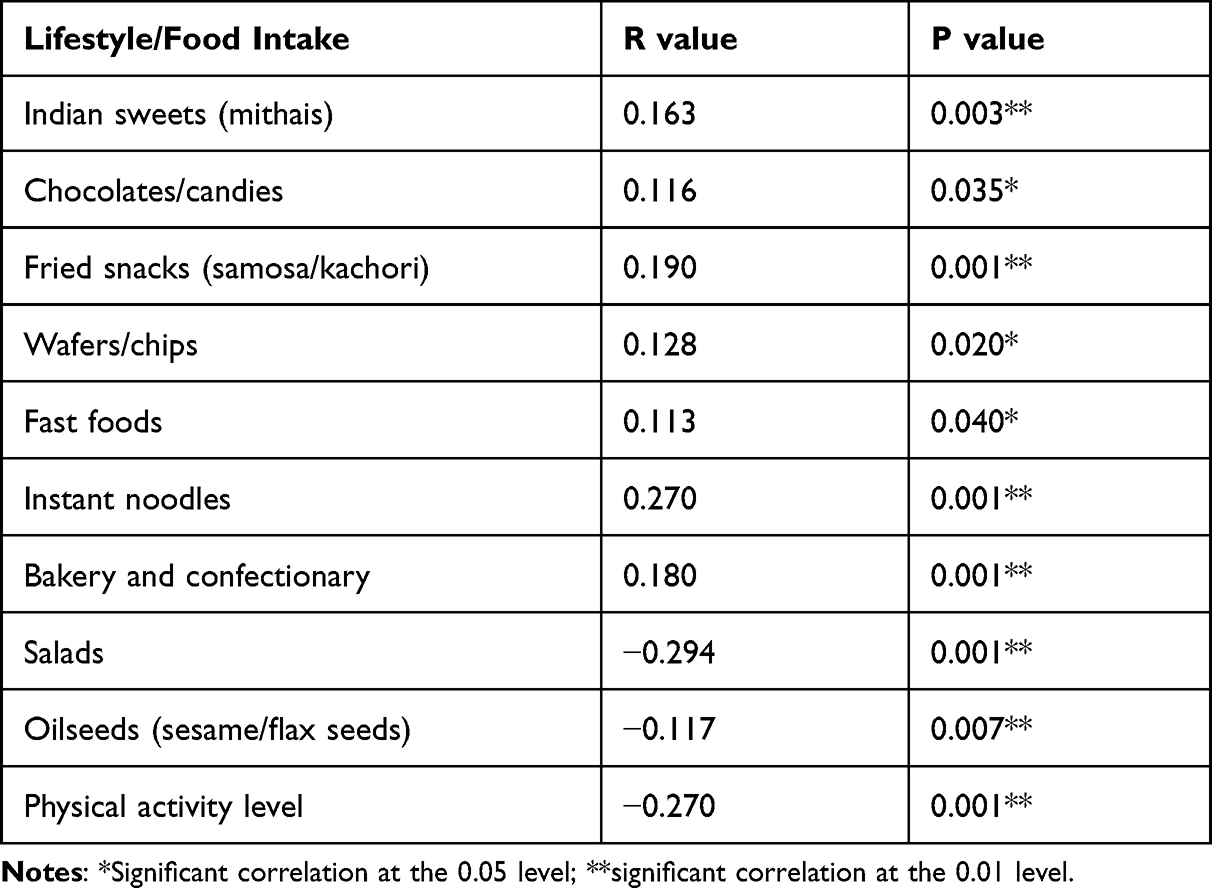 |
Table 4 Correlation Analysis Between Lifestyle/Food Intake and PMS Score (n = 330) |
Physical Activity Level
Physical activity levels were examined, which included various factors, such as the duration of sleep, screen time, mode of transport to college/institute, time spent on sedentary and moderate activities, and active participation in sports. As seen in Table 1, most of the participants (290, 87.9%) were sedentary, only few (33, 10%) were moderately active, and only a negligible number of women (7, 2.1%) were highly active. The computed PAL showed significant negative correlation across PMS scores (r = −0.270, p < 0.01), as presented in Table 4. The participants with low PAL displayed high scores in the MDQ subscales.
Discussion
Anxiety, nervousness, irritability, mood swings, and fatigue were the symptoms most frequently reported by the study participants. These findings are consistent with those from other Indian studies in which psychological symptoms were prevalent.23–25 However, minimal work has been done on the prevalence of PMS in India, particularly in the age group of 18–24 years. In our study, at least 71% of the participants experienced PMS symptoms. Comparable findings have been reported in a study from Thailand involving women of a similar age group.26 Weight, WHR, and body fat percentage were significantly correlated (p < 0.01) with the PMS score of the participants. Parallel findings have been observed in a study from Japan.27 Body fat percentage was higher than the cutoffs for adiposity even though the mean of BMI was normal. WHR was at the borderline of cutoffs (WHR < 0.08) as per the recommendations of WHO.18 On the MDQ scale, higher scores were noted for participants with higher body fat. Body fat percentages differed significantly across the PMS categories (p < 0.05). Additionally, BMI and the sum of the four skinfold thicknesses were significantly different among the PMS categories. The participants in the mild PMS category had smaller circumferences and skinfolds compared with those in the moderate and severe categories. Leptin, which is synthesized by the adipose tissues, plays a role in the regulation of gonadotropins. Overweight/obese women may have a higher level of leptin because of the greater number of fat cells, which could explain the role of adiposity in PMS. Nurse’s Health Study – 2 on PMS and adiposity has predicted a higher risk for PMS with an increase in BMR among women in the USA.28 These findings have also been supported by work done in Pakistan, Iran, and Korea.29–34
Traditionally, exercise is considered to be one of the nonpharmacological treatments for PMS. Many researchers have observed that the frequency of PMS is higher among women with a sedentary lifestyle. In this study too, similar findings were obtained, and the physical activity level was inversely associated with the PMS symptom scores. Physical activity may alleviate the PMS symptoms via several biological mechanisms, such as secretion of endorphins and improvement in mental and physiological health. Muscle contractions during exercise reduce back pain and pelvic discomfort and ease PMS symptoms by lowering the local concentrations of prostaglandins and other inflammatory substances.35–37 However, a Japanese study has reported that high-intensity exercises and sedentary activities contribute equally to the risk for PMS.36 Lifestyle changes and traditional relaxation methods have been shown to reduce pain and enhance the quality of life.38,39
The important role of nutrition in the reproductive health of women has a strong theoretical foundation. Various studies have established the association of certain nutrients with PMS and PMDD.40 A trend of eating street foods, which are generally high in sugars, salt, and oil, is commonly seen among youths. In our study, a significant association was observed between PMS score and the intake of foods high in sugar, fat, and salt. Higher consumption of these foods was linked to higher MDQ scores. These findings are consistent with reports by Houghton et al and Hussein et al, who have shown that the consumption of foods rich in simple carbohydrates and fats was associated with a higher risk for PMS.41,42 The positive association of the PMS score with high-calorie foods, sweets, and fried and salty snacks noted in our study is consistent with a study on the Iranian population.43 Participants who were lactovegetarians or ovolactovegetarians reported milder PMS symptoms than those who preferred a nonvegetarian diet. Protein intake is related to PMS via several potential physiological mechanisms. An increased intake of proteins from food sources of animal origin is linked to raised estrogen/estradiol levels, which may be a precursor for certain PMS symptoms. Substitution of proteins with carbohydrates during the luteal phase may increase the risk for the incidence of PMS.44 Consumption of salads and oilseeds (sesame and flax seeds) is inversely associated with the PMS score. Oilseeds, particularly sesame and flax seeds, are consumed widely in most regions of India in the form of chutneys or dips. Our study is probably the first to describe the inverse association of oilseed consumption with PMS symptoms among Indian women. Nutrient intake and dietary practices play a key role in PMS, which has been supported by findings from various studies. Less incidence and reduced severity of PMS symptoms has been associated with healthy food choices and adherence to a balance diet.13,45
Conclusions
The present study has attempted to explore PMS and its determinants among university students, thus emphasizing the prevalence of the condition. Nutrient intake, body composition parameters, and adiposity influence women’s health. Anthropometric indices demonstrated that despite normal BMI, body fat percentage and WHR were higher than the recommended values. The studied population showed deficient intake of vital nutrients, such as protein, iron, calcium, and vitamin B12. Lactovegetarians and ovolactovegetarians experienced milder symptoms compared with the nonvegetarians. An association of the severity of PMS symptoms with the consumption of high-calorie foods, sweets, and fried snacks with high sodium was observed, whereas the consumption of oilseeds was linked to a reduced incidence of PMS. These findings highlight the importance of awareness on a balanced diet and healthy lifestyle. The use of oilseeds in the treatment of PMS should be further explored in future studies. Our observations are limited to young women in the age group of 18–24 years. Prospective studies with middle-aged women would add to the existing knowledge. Our findings have established the influence of the analyzed factors on PMS and could serve as a valuable resource to suggest lifestyle modifications as an interventional program to treat PMS in young women.
Acknowledgment
The findings were partly presented as a poster at the International Congress of Dietetics (ICD 2021), and the abstract has been published in the proceedings as a special issue of the South African Journal of Clinical Nutrition.
The authors are thankful to all the students who participated in the study.
Funding
Harshada Thakur was funded by a Junior Research fellowship (Ref. No. 1514/NET-JUNE 2013) from the University Grants Commission, Government of India.
Disclosure
The authors report no conflicts of interest in this work.
References
1. Yonkers KA, Simoni MK. Premenstrual disorders. Am J Obstet Gynecol. 2018;218:68–74. doi:10.1016/j.ajog.2017.05.045
2. Akbarzadeh M, Moshfeghy Z, Dehghani M, et al. Comparison of the effect of Melissa officinalis capsule and care educational programs on the intensity of physical, mental and social symptoms of premenstrual syndrome in high school female students. Int J Womens Health Reprod Sci. 2018;16:18–26.
3. American College of Obstetrics and Gynaecology. Premenstrual Syndrome FAQ057; 2011.
4. Bansal M, Goyal M, Yadav S, et al. Premenstrual syndrome-A monthly menace. Indian J Clin Pract. 2012;10:491–494.
5. Bendich A. The potential for dietary supplements to reduce premenstrual syndrome (PMS) symptoms. J Am Coll Nutr. 2000;19(1):3–12. doi:10.1080/07315724.2000.10718907
6. Biggs WS, Demuth RH. Premenstrual syndrome and premenstrual dysphoric disorder. Am Fam Physician. 2011;84(8):918–924.
7. Chocano-Bedoya PO, Manson JE, Hankinson SE, et al. Dietary B vitamin intake and incident premenstrual syndrome. Am J Clin Nutr. 2011;93(5):1080–1086. doi:10.3945/ajcn.110.009530
8. Choudhary A, Mishra J. Effect of 16 weeks yogic intervention in premenstrual syndrome. Int J Pharm Bio Sci. 2013;4:207–212.
9. Deuster PA, Adera T, South-Paul J. Biological, social, and behavioral factors associated with premenstrual syndrome. Arch Fam Med. 1999;8(2):122–128. doi:10.1001/archfami.8.2.122
10. De Franciscis P, Conte A, Schiattarella A, et al. Non-hormonal treatments for menopausal symptoms and sleep disturbances: a comparison between purified pollen extracts and soy isoflavones. Curr Pharm Des. 2020;26(35):4509–4514. doi:10.2174/1381612826666200721002022
11. De Franciscis P, Colacurci N, Riemma G, et al. A nutraceutical approach to menopausal complaints. Medicina. 2019;55(9):1–17. doi:10.3390/medicina55090544
12. Schiattarella A, Riemma G, La Verde M, et al. Polycystic ovary syndrome and probiotics: a natural approach to an inflammatory disease. Curr Womens Health Rev. 2021;17(1):14–20. doi:10.2174/1573404816999200601162506
13. Gold EB, Bair Y, Block G, et al. Diet and lifestyle factors associated with premenstrual symptoms in a racially diverse community sample: Study of Women’s Health Across the Nation (SWAN). J Womens Health. 2007;16(5):641–656. doi:10.1089/jwh.2006.0202
14. Gururaj M. Kuppuswamy’s socio-economic status scale–A revision of income parameter for 2014. Int J Recent Trends Sci Technol. 2014;11:1–2.
15. Moos RH. The development of a menstrual distress questionnaire. Psychosom Med. 1968;30(6):853–867. doi:10.1097/00006842-196811000-00006
16. Steiner M, Macdougall M, Brown E. The premenstrual symptoms screening tool (PSST) for clinicians. Arch Womens Ment Health. 2003;6(3):203–209. doi:10.1007/s00737-003-0018-4
17. Consultation WE. Appropriate body-mass index for Asian populations and its implications for policy and intervention strategies. Lancet. 2004;363(9403):157–163. doi:10.1016/S0140-6736(03)15268-3
18. World Health Organization. Waist circumference and waist-hip ratio: report of a WHO expert consultation. Geneva; 8–11 December, 2008.
19. Durnin JV, Rahaman MM. The assessment of the amount of fat in the human body from measurements of skinfold thickness. Br J Nutr. 1967;21(3):681–689. doi:10.1079/BJN19670070
20. Kuriyan R. Body composition techniques. Indian J Med Res. 2018;148(5):648–658. doi:10.4103/ijmr.IJMR_1777_18
21. Longvah T, Anantan I, Bhaskarachary K, Venkaiah K, Longvah T Indian food composition tables. Hyderabad: national Institute of Nutrition. Indian Council of Medical Research. 2017.
22. Anjana RM, Sudha V, Lakshmipriya N, et al. Reliability and validity of a new physical activity questionnaire for India. Int J Behav Nutr Phys Act. 2015;12(1):1–2. doi:10.1186/s12966-015-0196-2
23. Anandha Lakshmi S, Saraswathi I, Saravanan A, et al. Prevalence of premenstrual syndrome and dysmenorrhoea among female medical students and its association with college absenteeism. Int J Biol Med Res. 2011;2:1011–1016.
24. Brahmbhatt S, Sattigeri BM, Shah H, et al. A prospective survey study on premenstrual syndrome in young and middle aged women with an emphasis on its management. Int J Res Med Sci. 2013;1(2):69–72. doi:10.5455/2320-6012.ijrms20130506
25. Garg P, Matreja PS, Khosla PP, et al. Correlation of symptoms of premenstrual syndrome in Indian set-up. Am J Health Res. 2014;2(3):102–105. doi:10.11648/j.ajhr.20140203.15
26. Buddhabunyakan N, Kaewrudee S, Chongsomchai C, et al. Premenstrual syndrome (PMS) among high school students. Int J Womens Health. 2017;9:501–505. doi:10.2147/IJWH.S140679
27. Takeda T, Tasaka K, Sakata M, et al. Prevalence of premenstrual syndrome and premenstrual dysphoric disorder in Japanese women. Arch Womens Ment Health. 2006;9(4):209–212. doi:10.1007/s00737-006-0137-9
28. Bertone-Johnson ER, Hankinson SE, Willett WC, et al. Adiposity and the development of premenstrual syndrome. J Womens Health. 2010;19(11):1955–1962. doi:10.1089/jwh.2010.2128
29. Tabassum S, Afridi B, Aman Z, et al. Premenstrual syndrome: frequency and severity in young college girls. Anxiety. 2005;45:4–5.
30. Tariq N, Hashim MJ, Jaffery T, et al. Impact and healthcare-seeking behaviour of premenstrual symptoms and dysmenorrhoea. Br J Med Prac. 2009;2:40–43.
31. Song JE, Chae HJ, Jang WH, et al. The relationship between life style, menstrual attitude and premenstrual syndrome in nursing students. Korean J Women Health Nurs. 2013;19(2):119–128. doi:10.4069/kjwhn.2013.19.2.119
32. Masho SW, Adera T, South-Paul J. Obesity as a risk factor for premenstrual syndrome. J Psychosom Obstet Gynaecol. 2005;26(1):33–39. doi:10.1080/01443610400023049
33. Ashfaq R, Jabeen S. Association between the prevalence of premenstrual syndrome and weight status of adolescent girls (11–21 years). Adv Obes Weight Manag Control. 2017;6:1–4.
34. Shahrjooye Haghighi E, Koushkie Jahromi M. The correlation between some body composition indices and premenstrual syndrome in young females. Womens Health Bull. 2019;6:1–4.
35. Arruda LM, Martins LS, Moreira TR. Assessment of the symptoms of premenstrual syndrome in physically active and sedentary adult women. J Nutr Therapeut. 2016;5:93–102.
36. Morino S, Egawa M, Hirata H, et al. Association between premenstrual syndrome and daily physical activity levels. J Womens Health. 2016;5:1–4.
37. Nam SJ, Cha C. Effects of a social-media-based support on premenstrual syndrome and physical activity among female university students in South Korea. J Psychosom Obstet Gynaecol. 2020;41:47–53.
38. Doğan H, Eroğlu S, Akbayrak T. The effect of kinesio taping and lifestyle changes on pain, body awareness and quality of life in primary dysmenorrhea. Complement Ther Clin Pract. 2020;39:101120. doi:10.1016/j.ctcp.2020.101120
39. Doğan H, Caltekin MD, Taylan ON, et al. Approaches of dealing with primary dysmenorrhea and relationship between kinesiophobia and pain severity. Konuralp Med J. 2020;12(3):551–556.
40. Chalasani S, Ortayli N. Reproductive health and nutrition. In: Nutrition and Health in a Developing World. Cham: Humana Press; 2017:469–485.
41. Houghton SC, Manson JE, Whitcomb BW, et al. Carbohydrate and fiber intake and the risk of premenstrual syndrome. Eur J Clin Nutr. 2018;72(6):861–870. doi:10.1038/s41430-017-0076-8
42. Hussein RA, Hafiz M, Bin-Afif S, et al. Premenstrual syndrome prevalence, and correlation with carbohydrate intake in young women. Health Med. 2012;6:774–780.
43. Hashim MS, Obaideen AA, Jahrami HA, et al. Premenstrual syndrome is associated with dietary and lifestyle behaviors among university students: a cross-sectional study from Sharjah, UAE. Nutrients. 2019;11(8):1–18. doi:10.3390/nu11081939
44. Houghton SC, Manson JE, Whitcomb BW, et al. Protein intake and the risk of premenstrual syndrome. Public Health Nutr. 2019;22(10):1762–1769. doi:10.1017/S1368980018004019
45. Yonkers KA, O’Brien PS, Eriksson E. Premenstrual syndrome. Lancet. 2008;371(9619):1200–1210. doi:10.1016/S0140-6736(08)60527-9
 © 2022 The Author(s). This work is published and licensed by Dove Medical Press Limited. The full terms of this license are available at https://www.dovepress.com/terms.php and incorporate the Creative Commons Attribution - Non Commercial (unported, v3.0) License.
By accessing the work you hereby accept the Terms. Non-commercial uses of the work are permitted without any further permission from Dove Medical Press Limited, provided the work is properly attributed. For permission for commercial use of this work, please see paragraphs 4.2 and 5 of our Terms.
© 2022 The Author(s). This work is published and licensed by Dove Medical Press Limited. The full terms of this license are available at https://www.dovepress.com/terms.php and incorporate the Creative Commons Attribution - Non Commercial (unported, v3.0) License.
By accessing the work you hereby accept the Terms. Non-commercial uses of the work are permitted without any further permission from Dove Medical Press Limited, provided the work is properly attributed. For permission for commercial use of this work, please see paragraphs 4.2 and 5 of our Terms.