")
Back to Journals » International Journal of Women's Health » Volume 14
Association of Maternal Serum Uric Acid and Cystatin C Levels in Late Pregnancy with Adverse Birth Outcomes: An Observational Cohort Study in China
Authors Yuan X, Han X, Jia C, Wang H, Yu B
Received 23 November 2021
Accepted for publication 4 February 2022
Published 17 February 2022 Volume 2022:14 Pages 213—223
DOI https://doi.org/10.2147/IJWH.S350847
Checked for plagiarism Yes
Review by Single anonymous peer review
Peer reviewer comments 2
Editor who approved publication: Professor Elie Al-Chaer
Xiaosong Yuan,1 Xiaoya Han,1 Chenbo Jia,1 Huiyan Wang,2 Bin Yu1
1Department of Medical Genetics, Changzhou Maternity and Child Health Care Hospital Affiliated to Nanjing Medical University, Changzhou City, Jiangsu Province, People’s Republic of China; 2Department of Obstetrics and Gynecology, Changzhou Maternity and Child Health Care Hospital Affiliated to Nanjing Medical University, Changzhou City, Jiangsu Province, People’s Republic of China
Correspondence: Bin Yu, Email [email protected]
Objective: To investigate the associations between serum uric acid (UA) and cystatin C (CysC) levels in late pregnancy with major unfavorable birth outcomes.
Methods: We retrospectively analyzed the maternal UA and CysC levels during late pregnancy and their relationship with unfavorable birth outcomes in a Chinese population (n = 11,580).
Results: Women with the highest quartile of UA had higher risks of low birth weight (LBW) and small for gestational age (SGA) babies and a lower risk of preterm birth (PTB) compared to women with the lowest quartile [for LBW, adjusted-odds ratio (OR) = 2.63, 95% CI: 1.76, 3.95; for SGA, adjusted-OR = 2.11, 95% CI: 1.73, 2.57; for PTB, adjusted-OR = 0.55, 95% CI: 0.45, 0.69; all P for trend < 0.001]. Compared to women in the lowest quartile of CysC, higher risks of macrosomia and large for gestational age (LGA) and lower risks of PTB and SGA were observed for those in the highest quartile (for macrosomia, adjusted-OR = 2.01, 95% CI: 1.60, 2.51; for LGA, adjusted-OR = 1.97, 95% CI: 1.67, 2.32; for PTB, adjusted-OR = 0.32, 95% CI: 0.26, 0.41; all P for trend < 0.001; for SGA, adjusted-OR = 0.78, 95% CI: 0.64, 0.96; P for trend < 0.05).
Conclusion: This study reports the associations of maternal UA and CysC with adverse birth outcomes, and suggests that routine determination of maternal UA and CysC in late pregnancy is beneficial for assessing the risks of these outcomes.
Keywords: uric acid, cystatin C, birth weight, preterm birth, small for gestational age, large for gestational age, macrosomia
Introduction
Serum uric acid (UA) and cystatin C (CysC) levels are often used as indicators of renal function. Increased uric acid is associated with both renal disease and risk factors for cardiovascular disease, hypertension, metabolic syndrome, obesity, and diabetes in adults.1 During pregnancy, elevated uric acid in hyper- or normotensive pregnancy is associated with unfavorable perinatal outcomes, including preterm birth (PTB), low birth weight (LBW), and small for gestational age (SGA) newborns.2–6 However, other reports suggest that high uric acid is not associated with these outcomes after adjusting for confounders.7–9 In a recent study of 885 mothers and their singleton newborns, Rothenbacher et al showed an inverse correlation of maternal high UA with a reduced risk of SGA in an age-adjusted analysis.10
CysC, an endogenous protease inhibitor with a molecular weight of 13 kDa, belongs to the cystatin superfamily and plays an important role in the intracellular catabolism of proteins and peptides. Most nucleated cells synthesize CysC, which is catabolized by renal proximal tubular cells after glomerular filtration. It has been widely studied in pre-eclampsia (PE) because PE mainly manifests as glomerular endotheliosis, which affects kidney function.11–16 However, little is known about CysC levels and other adverse pregnancy outcomes, such as gestational diabetes mellitus (GDM), intrahepatic cholestasis of pregnancy (ICP), PTB, SGA, large for gestational age (LGA) infants, LBW, and macrosomia.10 A few reports on the relationship between the CysC concentration and PTB are also inconsistent.8,17,18
Therefore, our hospital-based cohort study investigated the relationship between maternal UA, CysC in late pregnancy and adverse pregnancy outcomes in a Chinese population and quantified the risk of major pregnancy outcomes with varying UA and CysC levels after adjusting for available potential confounders, such as the maternal serum high sensitivity C-reactive protein (hsCRP) and blood lipids.
Methods
Study Population and Data Collection
This retrospective observational cohort study enrolled consecutive pregnant women admitted for delivery to the Changzhou Maternity and Child Health Care Hospital affiliated with Nanjing Medical University, Jiangsu Province, China, between April 2016 and March 2017. The study protocol was approved by the ethics committee of Changzhou Maternity and Child Health Care Hospital (No. ZD201803). Women were enrolled if they met the following criteria: singleton pregnancy, available medical records and complete laboratory tests, live birth, and no birth defects. Women were excluded if they had multiple pregnancies; smoked or used alcohol or illicit drugs during pregnancy; or had major pre-pregnancy diseases such as active gout, chronic hypertension, diabetes mellitus type 1 or 2, chronic heart, liver, or kidney disease, thyroid disease, immune rheumatic disease, or syphilis. Data on maternal characteristics [maternal age, body mass index (BMI), gestational age, gravidity, parity, blood pressure, and pregnancy complications] and on their infants (sex, birth length, and birth weight) were downloaded from the hospital information system. Maternal UA, CysC, hsCRP, and blood lipid levels were obtained from the hospital laboratory information system. Pregnant women were admitted after they developed symptoms of threatened labor onset. ALL of the blood samples in this study were collected before active labor. UA, CysC, creatinine, blood lipids, and hsCRP were detected using the uricase peroxidase method, latex enhanced immune turbidimetry, enzymatic procedures, and particle enhanced immunonephelometry, respectively, on automatic analyzers (AU5800, Beckman Coulter, Japan, for UA, CysC, creatinine, and lipids; BN II System, Siemens Diagnostics, Germany, for hsCRP). All laboratory analyses were performed in the corresponding gestational weeks at delivery by laboratory staff unaware of the birth outcomes.
Definitions of Pregnancy Outcomes
Pregnancy-induced hypertension (PIH), GDM, ICP, and PE were regarded as major pregnancy complications, while PTB, SGA, LBW, LGA babies, and macrosomia were considered important perinatal outcomes. Following the International Association for Diabetic Pregnancy Study Group criteria, a 75-g oral glucose tolerance test was used to diagnose GDM at 24–28 weeks of gestation.19,20 The diagnosis of ICP was based on abnormal liver function and elevated serum bile acids.21 On or after 20 gestational weeks, women without hypertension who developed high blood pressure (systolic blood pressure ≥140 mmHg or diastolic blood pressure ≥90 mmHg) with significant proteinuria (positive random tests for urine protein or urine protein ≥300 mg/24 h) were defined as PE, while those without proteinuria were diagnosed as PIH.22 PTB was defined as a delivery at <37 weeks of gestation.23 According to birth weight, newborns were divided into LBW (<2500 g), normal birth weight (2500–4000 g), and macrosomia (>4000 g).24,25 Based on a reported reference curve, SGA and LGA referred to neonates whose birth weights were less than the 10th and more than the 90th percentile by gestational age, respectively.26
Statistical Analysis
All statistical analyses were performed using Empower Stats software (X&Y solutions, Boston, MA, USA) and R (http://www.R-project.org). Descriptive statistics were used to describe the characters of mothers and their neonates in different categories of UA and CysC level. Parametric and nonparametric tests as appropriate were used to determine the statistical significance of the differences in demographics and birth outcomes in the four quartiles of UA and CysC levels. Maternal serum UA and CysC levels were defined as quartile 1 (Q1: UA < 249.8 µmol/L; CysC < 0.6 mg/L), quartile 2 (Q2: UA, 249.8 to < 292.1 µmol/L, CysC, 0.6 to < 0.70 mg/L), quartile 3 (Q3: UA, 292.1 to 340.9 µmol/L, CysC, 0.70 to 0.81 mg/L), and quartile 4 (Q4: UA, > 340.9 µmol/L; CysC, >0.81 mg/L), respectively. Spearman correlation analysis was used to investigate the association of maternal UA and CysC with maternal characteristics, blood lipids, and hsCRP. Furthermore, the associations between maternal UA and CysC and neonatal gestational age, birth weight, and length were examined using general linear models after adjusting for available confounders. In addition, by adjusting for confounding factors, logistic regression models were used to estimate odds ratios (ORs) and 95% confidence intervals (CIs) for major pregnancy complications and birth outcomes (for pregnancy complications, corrected for maternal age, BMI, gravidity, parity, blood lipids, and hsCRP levels; for PTB, also corrected for anemia, GDM, ICP, PE, PIH, systolic and diastolic BP at delivery, and infant sex; for SGA, LGA, LBW, and macrosomia, also corrected for gestational age at delivery).
Results
After excluding 1695 pregnant women with major pre-gestational diseases, medical abortion, multiple pregnancy, congenital malformation neonates, or no UA or CysC levels, 11,580 mothers and their singletons were eligible for the study. Tables 1 and 2 show the demographic characteristics of the study population according to the maternal UA and CysC categories, respectively. Significant differences in UA and CysC quartiles were observed (for both UA and CysC: maternal gravidity, parity, gestational age, blood pressure, prevalence of ICP, PE, PIH, and PTB, neonatal length and weight, the incidence of anemia, and GDM; for UA only: maternal age, BMI, delivery mode; for CysC only: neonatal sex). Among the 11,580 singleton neonates, 798, 519, and 853 were PTB/preterm premature rupture of membranes (PPROM), LBW, and fetal macrosomia, respectively. Of 11,580 neonates, 1024 were SGA babies and 1793 were LGA babies.
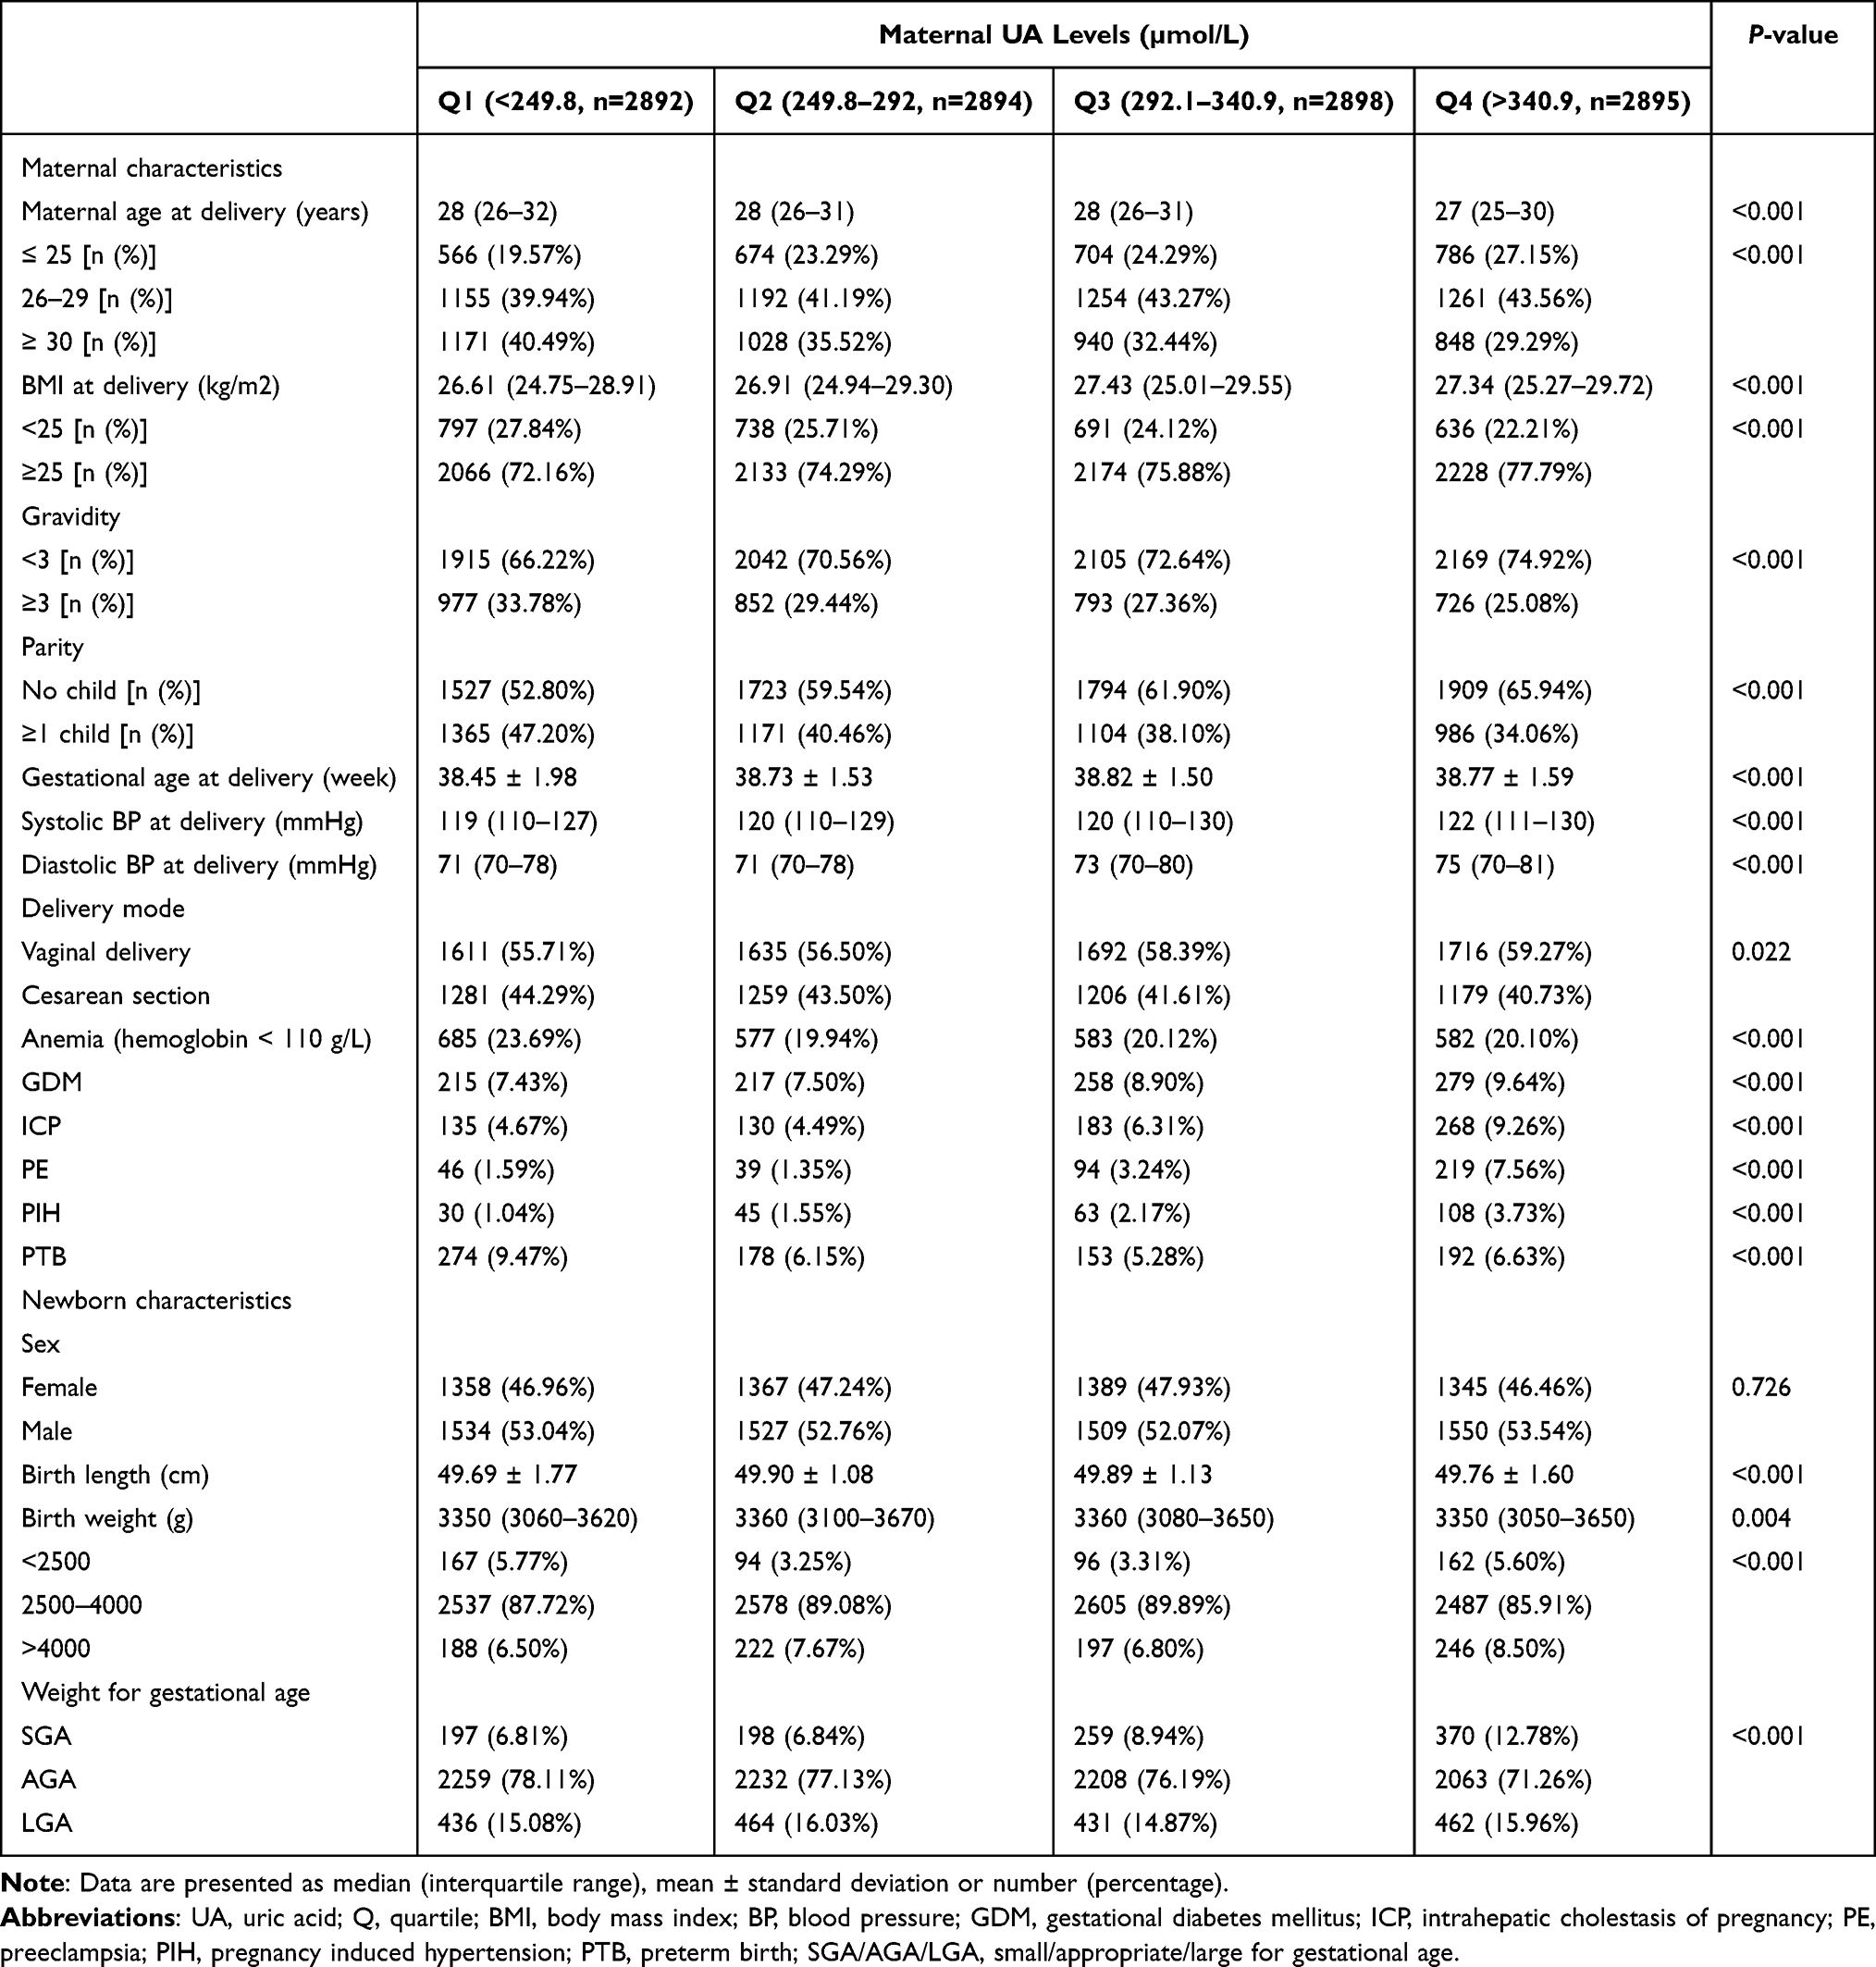 |
Table 1 Characteristics of the 11,579 Mothers and Their Babies According to the Quartile of Maternal UA Levels |
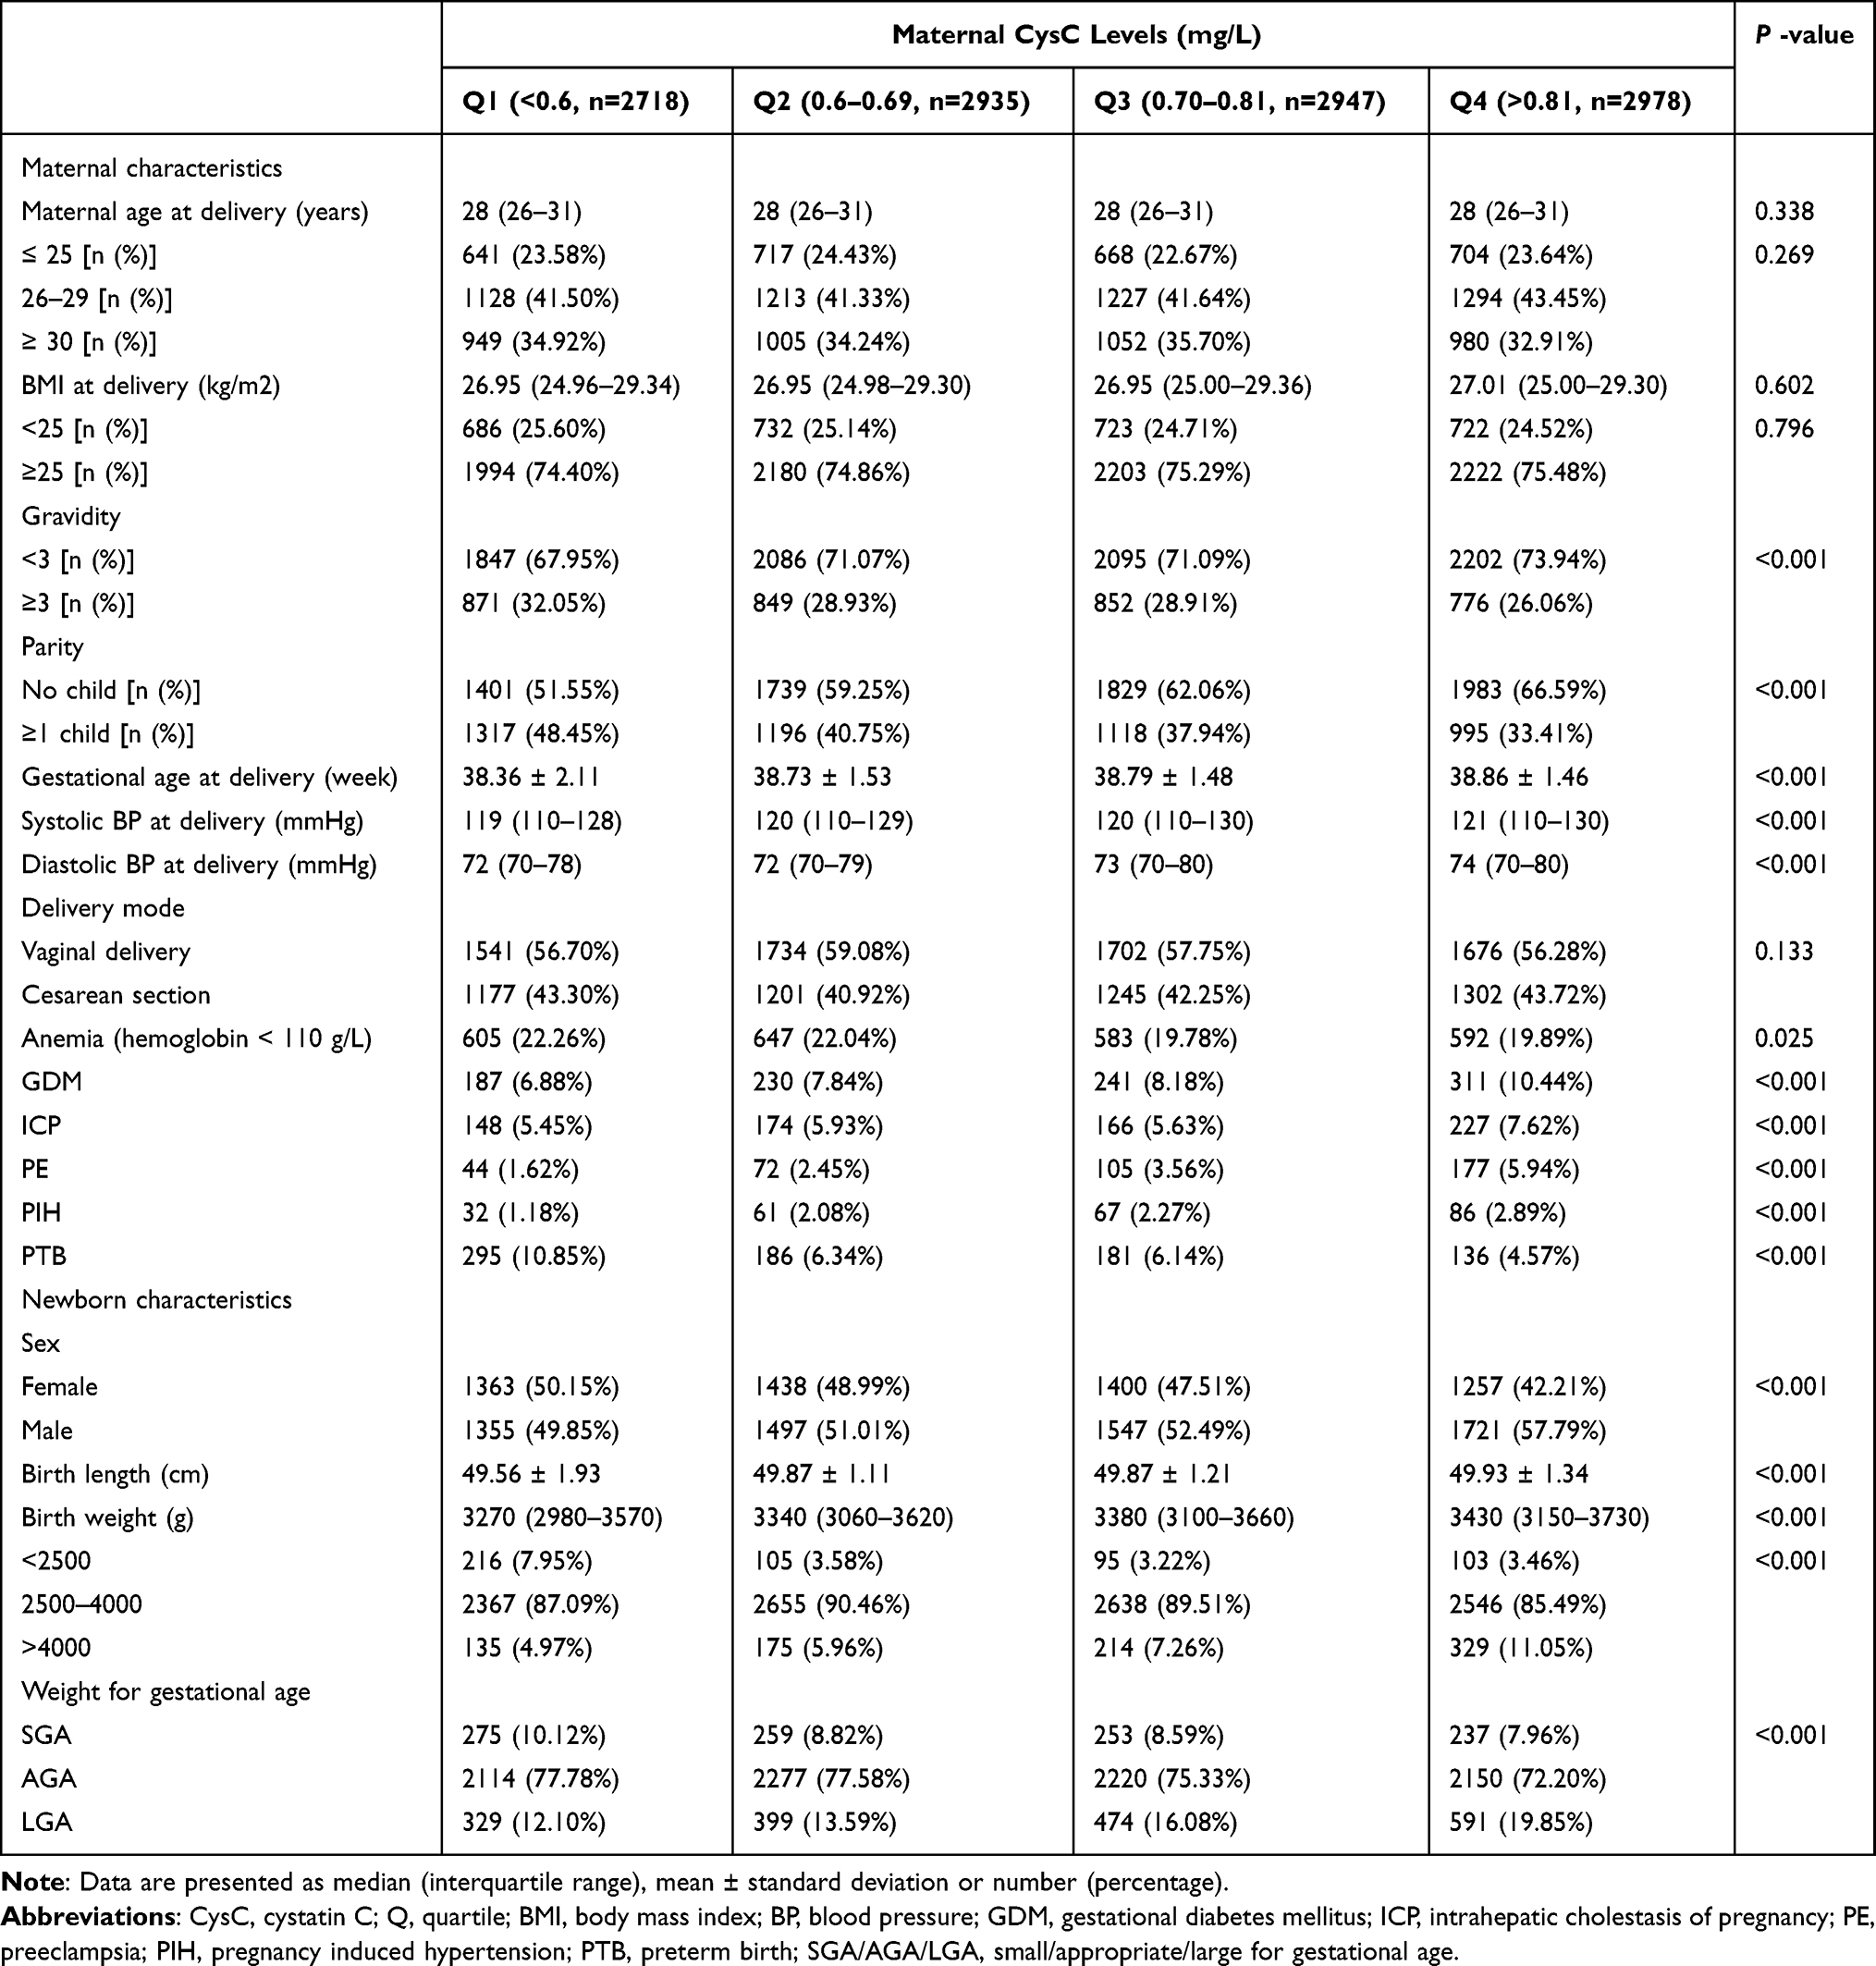 |
Table 2 Characteristics of the 11,578 Mothers and Their Babies According to the Quartile of Maternal CysC Levels |
In this study, the medians (range) of maternal UA and CysC levels in late pregnancy were 292.1 (45.60–722.40) µmol/L and 0.70 (0.10–2.39) mg/L, respectively. Interestingly, the incidence of macrosomia and LGA significantly elevated with increasing CysC quartile. Table 3 shows the distribution of maternal creatinine, blood lipids, and hsCRP with UA and CysC quartile. With increasing UA and CysC quartiles, triglyceride increased significantly, while HDL-C decreased. There were also significant correlations between UA or CysC and maternal characteristics (Table 4). Table 5 shows the effects of maternal UA and CysC levels on the growth of their newborns after adjusting for confounders. With increasing CysC quartile, the gestational age increased by 0.32, 0.37, and 0.46 weeks, and the neonatal birthweight increased by 32, 56, and 106 g. Compared to women in the lowest quartile of UA, longer gestational age and lower birthweight were observed for those in the highest quartile (for gestational age, adjusted- β = 0.28, 95% CI: 0.20, 0.37; for birthweight, adjusted- β = –59, 95% CI: –78, –39). The associations of UA and CysC levels (in quartiles) with the risks of major pregnancy outcomes in the adjusted models are summarized in Table 6. Women with the highest quartile of UA had higher risks of LBW and SGA babies and a lower risk of PTB compared to women with the lowest quartile (for LBW, adjusted-OR = 2.63, 95% CI: 1.76, 3.95; for SGA, adjusted-OR = 2.11, 95% CI: 1.73, 2.57; for PTB, adjusted-OR = 0.55, 95% CI: 0.45, 0.69). Compared to women in the lowest quartile of CysC, higher risks of macrosomia and LGA and lower risks of PTB and SGA were observed for those in the highest quartile (for macrosomia, adjusted-OR = 2.01, 95% CI: 1.60, 2.51; for LGA, adjusted-OR = 1.97, 95% CI: 1.67, 2.32; for PTB, adjusted-OR = 0.32, 95% CI: 0.26, 0.41; for SGA, adjusted-OR = 0.78, 95% CI: 0.64, 0.96).
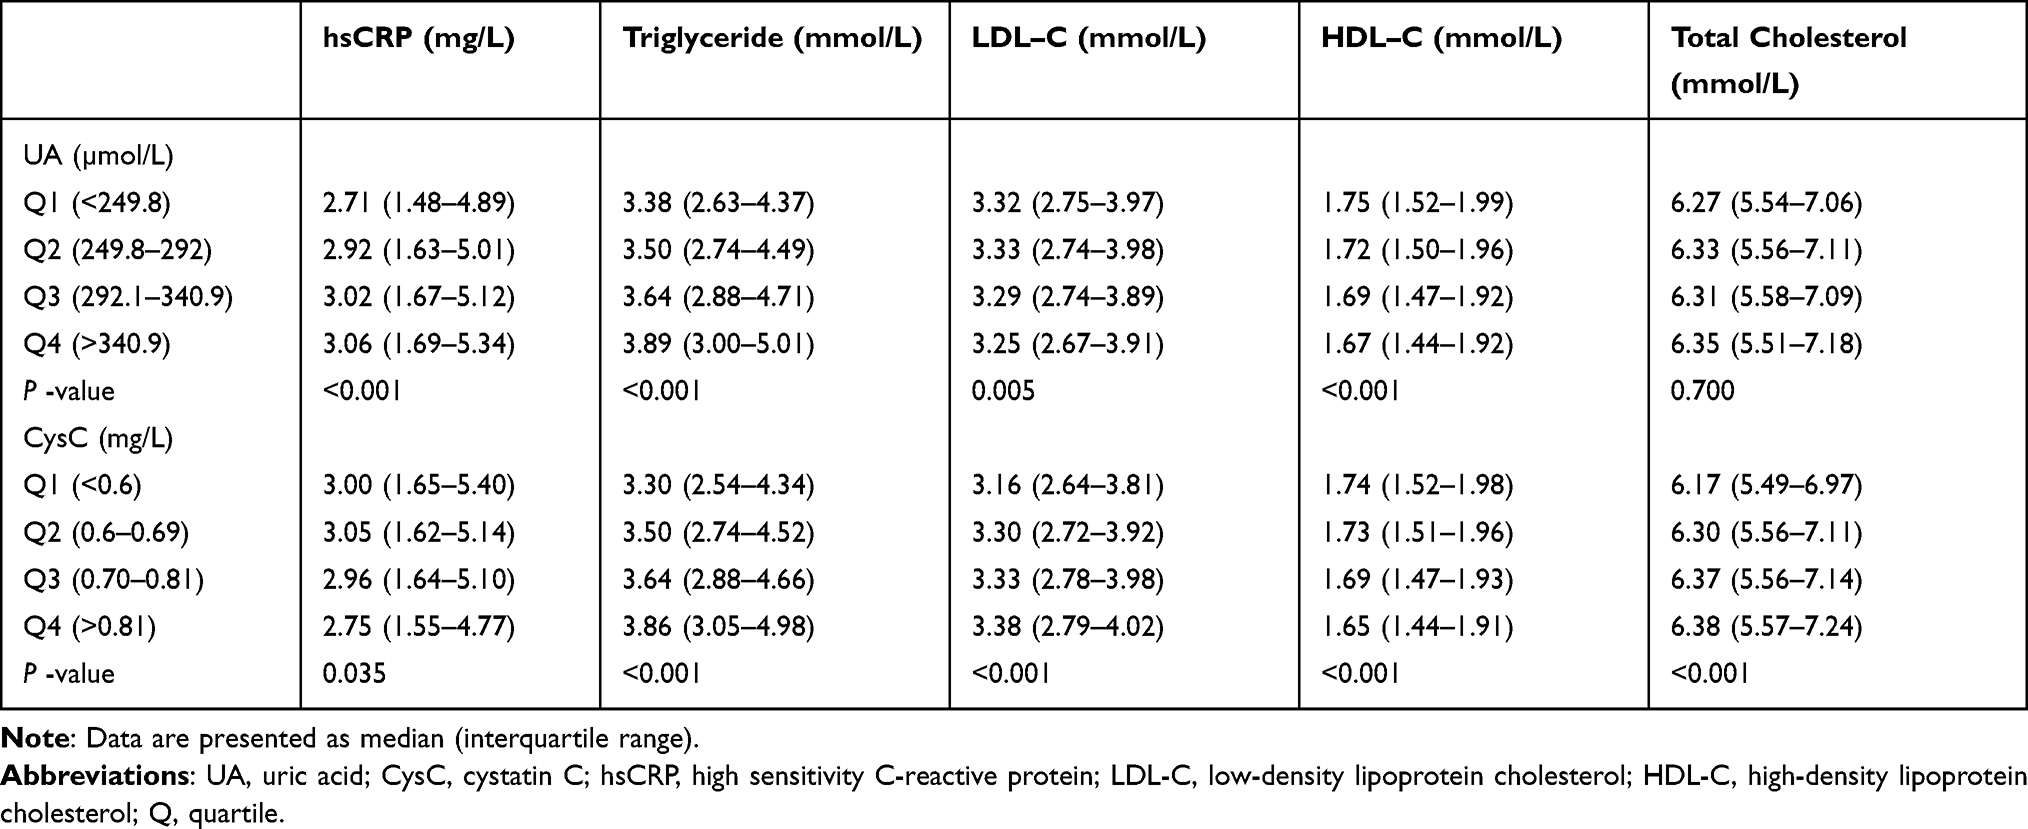 |
Table 3 Distribution of Maternal Serum Biochemistry Parameters According to Categories of UA and CysC Levels |
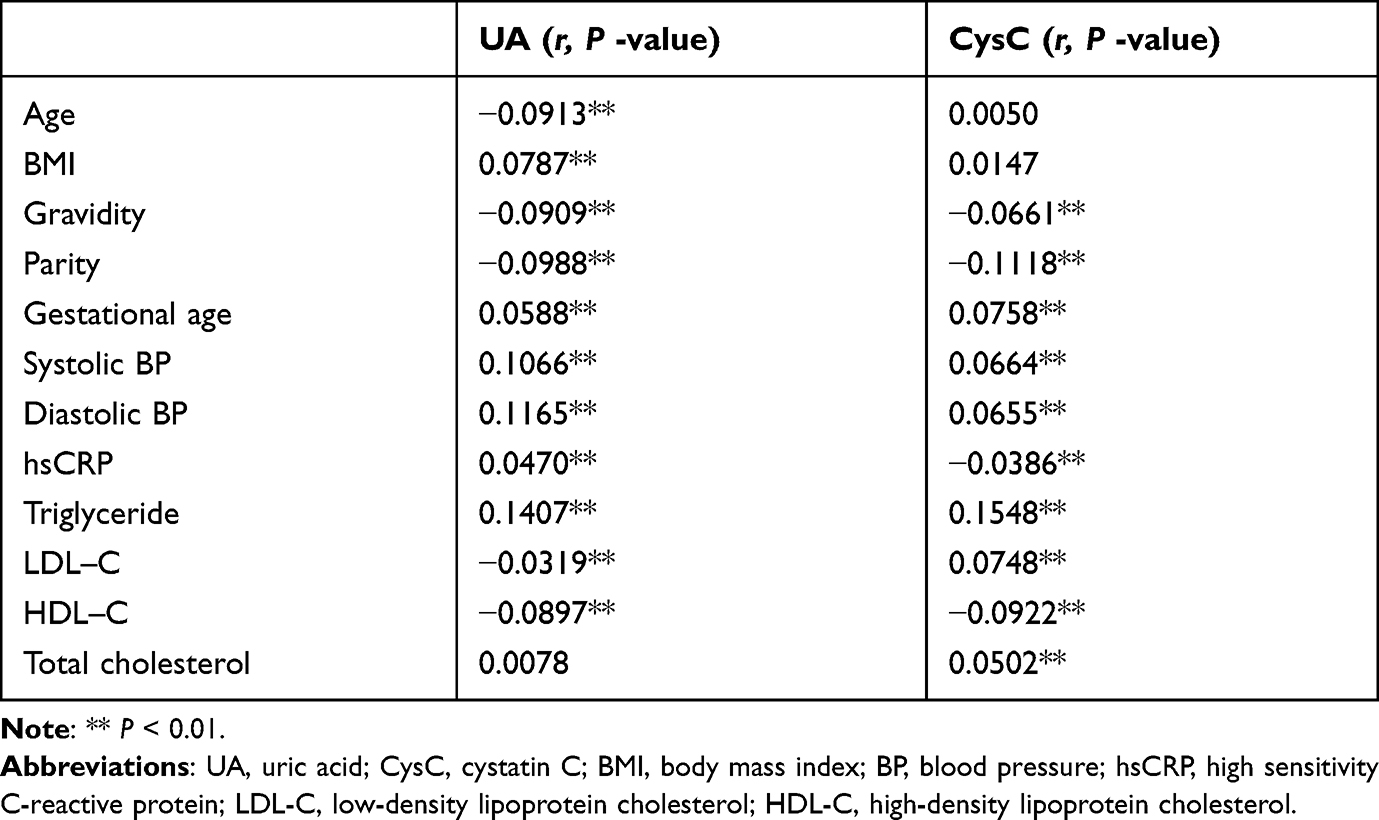 |
Table 4 Spearman Correlations Between UA and CysC, and Other Variables (Maternal Characteristics and Available Biochemistry Parameters) |
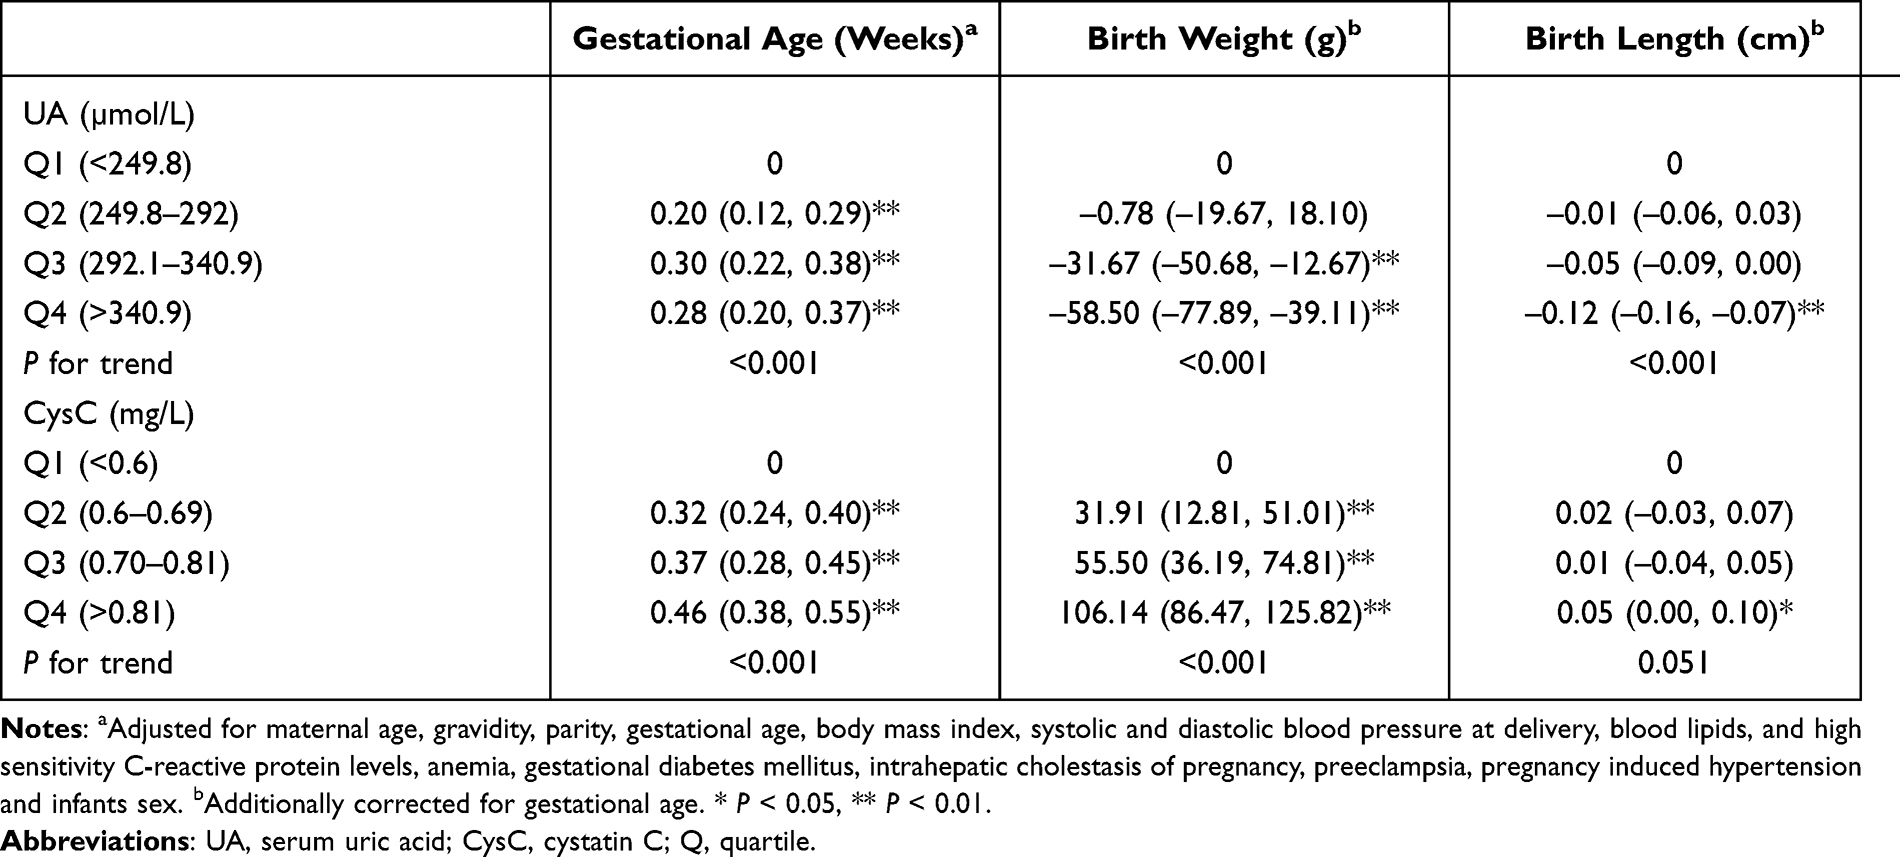 |
Table 5 Regression Coefficients [β (95% Confidence Interval)] for Neonatal Growth Parameters Associated with the Quartiles of UA and CysC Levels |
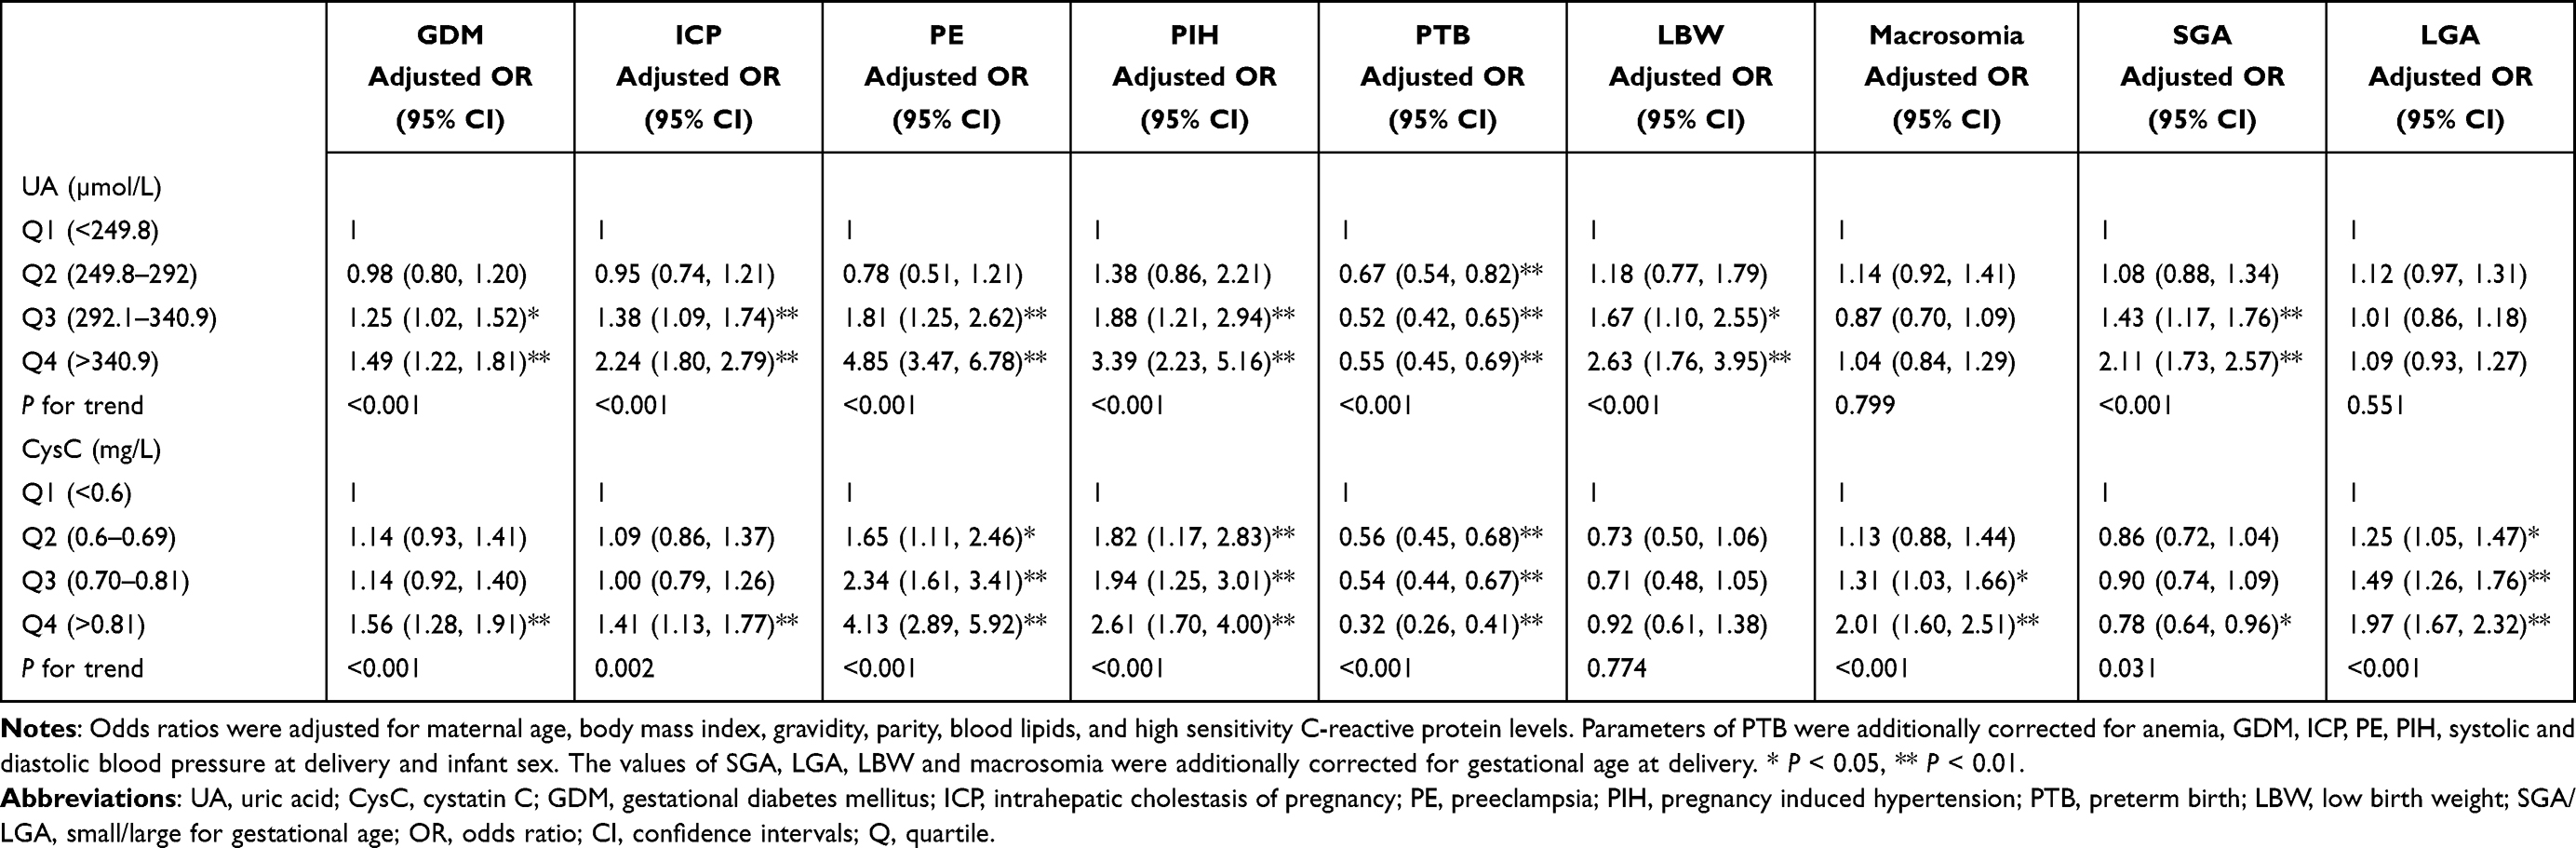 |
Table 6 Odds Ratios and 95% Confidence Intervals for Different Pregnancy Outcomes with the Quartiles of UA and CysC Levels |
Discussion
To our knowledge, this is the largest cohort study to examine the associations of maternal serum indices of renal function (UA and CysC) with unfavorable birth outcomes in a Chinese population. We found that with increasing UA quartile from Q3 to Q4, the risk of LBW increased by 1.67- and 2.63-fold, and the risk of SGA increased by 1.43- and 2.11-fold. With increasing CysC quartile, the risk of macrosomia increased by 1.13, 1.31, and 2.01-fold, and the risk of LGA increased by 1.25, 1.49, and 1.97-fold. Women in the highest quartiles of UA and CysC had a lower risk of PTB than those in the lowest quartiles.
The UA level decreases until about the 20th week of gestation, when it stabilizes and increases slightly approaching the end of pregnancy.27 During early pregnancy, the maternal UA declines because of the increased renal function and stimulatory effects of estrogens, whereas in late pregnancy UA increases significantly to as high as 238–298 μmol/L.28 High UA levels are attributed mainly to reduced glomerular filtration, elevated resorption, decreased secretion in the renal proximal tubules, oxidative stress, tissue damage and placental ischemia, probably leading to pregnancy complications.29–31 A common limitation of previous studies of the relationship between UA and pregnancy complications is the heterogeneity of the study populations explored, study design, classification of hyperuricemia, sample size, pregnancy outcomes chosen, and timing of UA detection. Our study of 11,580 Chinese mothers evaluated the association between UA in late pregnancy and major pregnancy complications and demonstrated that the highest UA quartile (>340.9 µmol/L) is associated with increased incidences of GDM, ICP, PE, and PIH as compared to the lowest quartile (for GDM, 9.64% vs 7.43%; for ICP, 9.26% vs 4.67%; for PE, 7.56% vs 1.59%; and for PIH, 3.73% vs 1.04%). This is the largest cohort study showing an association between high UA and ICP in Chinese population.
Previous studies have found that the CysC level increases with the progress of uncomplicated pregnancy and decreases after 6 weeks postpartum, returning to the level of non-pregnant women.32,33 Compared with UA, there is less evidence of correlations between maternal CysC and unfavorable birth outcomes. A cross-sectional study of 203 pregnant women from Turkey evaluated the predictive value of CysC levels in early pregnancy for PTB (cut-off value 0.505 mg/L, sensitivity 91.9%, specificity 27.7%).15 Wattanavaekin et al showed a significant positive correlation between CysC and PTB in 26 severe preeclampsia patients from Thailand (OR = 32.52).17 Contrasting with their findings, we found a negative association with PTB for Q4 vs Q1 (OR = 0.38, 95% CI: 0.30, 0.49). The inconsistent correlation can be explained by the different study populations and design, sample size, and lack of adjustment for some important confounders in the analysis, such as inflammatory biomarkers. We are the first to demonstrate that higher CysC levels (Q4) in late pregnancy have an increased risk of GDM compared to Q1 (OR = 1.45, 95% CI: 1.17, 1.79).
The previous study demonstrated that the correlation between the presence of the metabolic syndrome and an increased level of CysC contributed to GDM.34 In addition, some data have shown that there is a link between serum CysC and HOMA-IR.35 Thus, the association of GDM with maternal CysC level might be attributed to the close connection between CysC and insulin resistance, although the underlying causal mechanism between them is currently unknown.
There are only a few reports on the relationships between UA and CysC and birth weight. Laughon et al reported that hyperuricemia was associated with LBW in 263 normotensive women from the USA.4 Paula et al and Akahori et al found that UA levels were negatively correlated with birth weight in 58 Brazilian hypertensive pregnant women (r = –0.27, p = 0.04) and 120 Japanese pregnant women (r = –0.59, p = 0.006), respectively.5,7 A study of 116 Indian pregnant women showed an association of high UA levels with an increased risk of LBW in unadjusted analysis (crude OR = 2.49, 95% CI: 1.01, 6.17), and no correlation between CysC and LBW.8 By contrast, in a recent study of 885 pregnant women from Germany, Rothenbacher et al indicated that maternal increased CysC levels (Q4) were associated with an increased risk for LGA and a decreased risk for SGA compared to Q1 (for LGA, OR = 5.92, 95% CI: 2.27, 15.44; for SGA, OR = 0.35, 95% CI: 0.16, 0.77), and there was no association between UA and birth weight.10 In our cohort study, the associations between high CysC levels and an increased risk of LGA and between high UA levels and an elevated risk of SGA were extended to the Chinese population. Previous reports suggested that women with GDM had a higher incidence of LGA compared to those without pregnancy complications among individuals who underwent serum screening for Down syndrome (25.82% vs 13.80%) or noninvasive prenatal screening (29.7% vs 18.6%).36,37 In this study, the incidence of GDM was significantly increased between the maternal CysC quartile levels (from 6.88% to 10.44%). In addition, previous study demonstrated that maternal high triglyceride in the third trimester is significantly associated with an increased risk of LGA in Chinese population.38 Our study suggested that maternal CysC levels were positively correlated with triglyceride levels. Therefore, the association between maternal CysC levels and LGA in this study may be explained by maternal hyperglycemia and high triglyceride or other causes.
This cohort study’s strengths include the following: 1) its large sample size (11,580 pregnant women) with various levels of UA and CysC and different adverse birth outcomes, 2) the exclusion of cases with pre-existing disease or fetal congenital malformations, which are the main confounders affecting maternal UA and CysC levels and perinatal outcomes, 3) adjusting for the confounding factors maternal age, BMI, anemia, blood pressure, creatinine, hsCRP, and blood lipids, and 4) the determination of UA, CysC, creatinine, hsCRP, and blood lipids in a single laboratory using the same blood samples, instruments, and settings to minimize the differences caused by testing. Some limitations of this observational study should also be considered. One is the lack of a control for other maternal clinical risk factors and undetected variables, such as maternal education and family income, history of hypertension or diabetes in their previous pregnancies, which might contribute to potential bias. Another is that we did not examine the relationship between the two indicators of kidney function and risk for adverse pregnancy outcomes during early and middle pregnancy due to the retrospective, observational design. A longitudinal prospective investigation of the fluctuations in these markers during pregnancy and their relationship with pregnancy outcomes is necessary.
Conclusion
Our cohort study confirmed the associations between maternal UA and CysC levels in late pregnancy and the risk of adverse birth outcomes and suggests that routine determination of maternal UA and CysC in late pregnancy is beneficial for assessing the risks of these outcomes.
Abbreviations
UA, uric acid; CysC, cystatin C; LGA, large for gestational age; PTB, preterm birth; LBW, low birth weight; SGA, small for gestational age; OR, odds ratio; CI, confidence interval; GDM, gestational diabetes mellitus; ICP, intrahepatic cholestasis of pregnancy; PE, preeclampsia; PIH, pregnancy-induced hypertension; hsCRP, high sensitivity C-reactive protein; BMI, body mass index; IADPSG, international association for diabetic pregnancy study group; OGTT, oral glucose tolerance test.
Data Sharing Statement
The data used and/or analyzed in the present study are available from the corresponding author on reasonable request.
Ethics Approval and Consent to Participate
We confirmed that our study complies with the Declaration of Helsinki. The study protocol was approved by the ethics committee of Changzhou Maternity and Child Health Care Hospital (No. ZD201803). Informed consent in our study was waived due to retrospective and anonymous analysis.
Acknowledgments
We thank all of the study participants and staff in the laboratory and medical record sections of Changzhou Maternity and Child Health Care Hospital for their help.
Author Contributions
All authors made a significant contribution to the work reported, whether that is in the conception, study design, execution, acquisition of data, analysis and interpretation, or in all these areas; took part in drafting, revising or critically reviewing the article; gave final approval of the version to be published; have agreed on the journal to which the article has been submitted; and agree to be accountable for all aspects of the work.
Funding
This work was supported by Changzhou science and technology support project (Social Development: CE20205028), and Jiangsu Maternal and Child Health Research Projects (F201842).
Disclosure
The authors declare that they have no conflicts of interest in this work.
References
1. Ndrepepa G. Uric acid and cardiovascular disease. Clin Chim Acta. 2018;484:150–163. doi:10.1016/j.cca.2018.05.046
2. Roberts JM, Bodnar LM, Lain KY, et al. Uric acid is as important as proteinuria in identifying fetal risk in women with gestational hypertension. Hypertension. 2005;46(6):1263–1269. doi:10.1161/01.HYP.0000188703.27002.14
3. Hawkins TL, Roberts JM, Mangos GJ, Davis GK, Roberts LM, Brown MA. Plasma uric acid remains a marker of poor outcome in hypertensive pregnancy: a retrospective cohort study. BJOG. 2012;119(4):484–492. doi:10.1111/j.1471-0528.2011.03232.x
4. Laughon SK, Catov J, Roberts JM. Uric acid concentrations are associated with insulin resistance and birthweight in normotensive pregnant women. Am J Obstet Gynecol. 2009;201(6):
5. Akahori Y, Masuyama H, Hiramatsu Y. The correlation of maternal uric acid concentration with small-for-gestational-age fetuses in normotensive pregnant women. Gynecol Obstet Invest. 2012;73(2):162–167. doi:10.1159/000332391
6. Amini E, Sheikh M, Hantoushzadeh S, Shariat M, Abdollahi A, Kashanian M. Maternal hyperuricemia in normotensive singleton pregnancy, a prenatal finding with continuous perinatal and postnatal effects, a prospective cohort study. BMC Pregnancy Childbirth. 2014;14(1):104. doi:10.1186/1471-2393-14-104
7. Paula LG, da Costa BE, Poli-de-figueiredo CE, Antonello IC. Does uric acid provide information about maternal condition and fetal outcome in pregnant women with hypertension? Hypertens Pregnancy. 2008;27(4):413–420. doi:10.1080/10641950801955709
8. Yalamati P, Bhongir AV, Betha K, Verma R, Dandge S. Relationship of serum uric acid, serum creatinine and serum cystatin C with maternal and fetal outcomes in rural Indian pregnant women. Int J Reprod Contracept Obstet Gynecol. 2015;4(5):1505–1510.
9. Laughon SK, Catov J, Powers RW, Roberts JM, Gandley RE. First trimester uric acid and adverse pregnancy outcomes. Am J Hypertens. 2011;24(4):489–495. doi:10.1038/ajh.2010.262
10. Rothenbacher D, Braig S, Logan CA, et al. Association of maternal uric acid and cystatin C serum concentrations with maternal and neonatal cardiovascular risk markers and neonatal body composition: the Ulm SPATZ Health Study. PLoS One. 2018;13(7):e0200470. doi:10.1371/journal.pone.0200470
11. Strevens H, Wide-Swensson D, Grubb A, et al. Serum cystatin C reflects glomerular endotheliosis in normal, hypertensive and pre-eclamptic pregnancies. BJOG. 2003;110(9):825–830. doi:10.1111/j.1471-0528.2003.02051.x
12. Park YS, Kim Y, Kim HY, et al. Serum sFlt-1, cystatin C and cathepsin B are potential severity markers in preeclampsia: a pilot study. Arch Gynecol Obstet. 2020;301(4):955–962. doi:10.1007/s00404-020-05478-6
13. Yalcin S, Ulas T, Eren MA, et al. Relationship between oxidative stress parameters and cystatin C levels in patients with severe preeclampsia. Medicina. 2013;49(3):118–123.
14. Risch M, Purde MT, Baumann M, et al. High first-trimester maternal blood cystatin C levels despite normal serum creatinine predict pre-eclampsia in singleton pregnancies. Scand J Clin Lab Invest. 2017;77(8):634–643. doi:10.1080/00365513.2017.1393692
15. Niraula A, Lamsal M, Baral N, et al. Cystatin-C as a marker for renal impairment in preeclampsia. J Biomark. 2017;2017:7406959. doi:10.1155/2017/7406959
16. Behram M, Oğlak SC. The expression of angiogenic protein Cyr61 significantly increases in the urine of early-onset preeclampsia patients. Int J Contemp Med. 2021;11(5):605–609.
17. Wattanavaekin K, Kitporntheranunt M, Kreepala C. Cystatin C as a novel predictor of preterm labor in severe preeclampsia. Kidney Res Clin Pract. 2018;37(4):338–346. doi:10.23876/j.krcp.18.0080
18. Gursoy AY, Tasci Y, Celik H, et al. The prognostic value of first-trimester cystatin C levels for gestational complications. J Perinat Med. 2016;44(3):295–299. doi:10.1515/jpm-2015-0061
19. Metzger BE, Gabbe SG, Persson B, et al. International association of diabetes and pregnancy study groups recommendations on the diagnosis and classification of hyperglycemia in pregnancy. Diabetes Care. 2010;33(7):676–682. doi:10.2337/dc10-0719
20. Oğlak SC, Obut M. Expression of ADAMTS13 and PCNA in the placentas of gestational diabetic mothers. Int J Morphol. 2021;39(1):38–44. doi:10.4067/S0717-95022021000100038
21. Williamson C, Geenes V. Intrahepatic cholestasis of pregnancy. Obstet Gynecol. 2014;124(1):120–133. doi:10.1097/AOG.0000000000000346
22. Tranquilli AL, Dekker G, Magee L, et al. The classification, diagnosis and management of the hypertensive disorders of pregnancy: a revised statement from the ISSHP. Pregnancy Hypertens. 2014;4(2):97–104. doi:10.1016/j.preghy.2014.02.001
23. Behram M, Oğlak SC, Başkıran Y, et al. Maternal serum IL-22 concentrations are significantly upregulated in patients with preterm premature rupture of membranes. Ginekol Pol. 2021;92(9):631–636. doi:10.5603/GP.a2021.0036
24. Oğlak SC, Bademkıran MH, Obut M. Predictor variables in the success of slow-release dinoprostone used for cervical ripening in intrauterine growth restriction pregnancies. J Gynecol Obstet Hum Reprod. 2020;49(6):101739. doi:10.1016/j.jogoh.2020.101739
25. Behram M, Oğlak SC, Dağ İ. Circulating levels of Elabela in pregnant women complicated with intrauterine growth restriction. J Gynecol Obstet Hum Reprod. 2021;50(8):102127. doi:10.1016/j.jogoh.2021.102127
26. Yuan X, Hu H, Zhang M, et al. Iron deficiency in late pregnancy and its associations with birth outcomes in Chinese pregnant women: a retrospective cohort study. Nutr Metab. 2019;16(1):30. doi:10.1186/s12986-019-0360-9
27. Bellomo G. Serum uric acid and pre-eclampsia: an update. Expert Rev Cardiovasc Ther. 2012;10(6):701–705. doi:10.1586/erc.12.51
28. Kang DH, Finch J, Nakagawa T, et al. Uric acid, endothelial dysfunction and pre-eclampsia: searching for a pathogenetic link. J Hypertens. 2004;22(2):229–235. doi:10.1097/00004872-200402000-00001
29. Rajasingam D, Seed PT, Briley AL, Shennan AH, Poston L. A prospective study of pregnancy outcome and biomarkers of oxidative stress in nulliparous obese women. Am J Obstet Gynecol. 2009;200(4):
30. Laughon SK, Catov J, Provins T, Roberts JM, Gandley RE. Elevated first-trimester uric acid concentrations are associated with the development of gestational diabetes. Am J Obstet Gynecol. 2009;201(4):
31. Wolak T, Sergienko R, Wiznitzer A, Paran E, Sheiner E. High uric acid level during the first 20 weeks of pregnancy is associated with higher risk for gestational diabetes mellitus and mild preeclampsia. Hypertens Pregnancy. 2012;31(3):307–315. doi:10.3109/10641955.2010.507848
32. Larsson A, Palm M, Hansson LO, Axelsson O. Reference values for clinical chemistry tests during normal pregnancy. BJOG. 2008;115(7):874–881. doi:10.1111/j.1471-0528.2008.01709.x
33. Obrenovic R, Petrovic D, Majkic-Singh N, Trbojevic-Stankovic J, Stojimirovic B. Serum cystatin C levels in normal pregnancy. Clin Nephrol. 2011;76(3):174–179. doi:10.5414/CN106792
34. Yousefzadeh G, Pezeshki S, Gholamhosseinian A, Nazemzadeh M, Shokoohi M. Plasma cystatin-C and risk of developing gestational diabetes mellitus. Diabetes Metab Syndr. 2014;8(1):33–35. doi:10.1016/j.dsx.2013.10.016
35. Zhao W, Pan J, Li H, et al. Relationship between high serum cystatin C levels and the risk of gestational diabetes mellitus. PLoS One. 2016;11(2):e0147277. doi:10.1371/journal.pone.0147277
36. Yuan X, Long W, Liu J, et al. Associations of serum markers screening for Down’s syndrome with pregnancy outcomes: a Chinese retrospective cohort study. Clin Chim Acta. 2019;489:130–135. doi:10.1016/j.cca.2018.12.001
37. Yuan X, Zhou L, Zhang B, Wang H, Jiang J, Yu B. Early second-trimester plasma cell free DNA levels with subsequent risk of pregnancy complications. Clin Biochem. 2019;71:46–51. doi:10.1016/j.clinbiochem.2019.07.001
38. Jin WY, Lin SL, Hou RL, et al. Associations between maternal lipid profile and pregnancy complications and perinatal outcomes: a population-based study from China. BMC Pregnancy Childbirth. 2016;16(1):60. doi:10.1186/s12884-016-0852-9
 © 2022 The Author(s). This work is published and licensed by Dove Medical Press Limited. The full terms of this license are available at https://www.dovepress.com/terms.php and incorporate the Creative Commons Attribution - Non Commercial (unported, v3.0) License.
By accessing the work you hereby accept the Terms. Non-commercial uses of the work are permitted without any further permission from Dove Medical Press Limited, provided the work is properly attributed. For permission for commercial use of this work, please see paragraphs 4.2 and 5 of our Terms.
© 2022 The Author(s). This work is published and licensed by Dove Medical Press Limited. The full terms of this license are available at https://www.dovepress.com/terms.php and incorporate the Creative Commons Attribution - Non Commercial (unported, v3.0) License.
By accessing the work you hereby accept the Terms. Non-commercial uses of the work are permitted without any further permission from Dove Medical Press Limited, provided the work is properly attributed. For permission for commercial use of this work, please see paragraphs 4.2 and 5 of our Terms.