")
Back to Journals » Cancer Management and Research » Volume 10
Association of low skeletal muscle index with increased systematic inflammatory responses and interferon γ-induced protein 10 levels in patients with colon cancer
Authors He WZ , Yang QX, Xie JY, Kong PF , Hu WM , Yang L , Yang YZ, Xie QK, Jiang C, Yin CX, Guo GF, Qiu HJ, Zhang B, Xia LP
Received 27 December 2017
Accepted for publication 4 May 2018
Published 7 August 2018 Volume 2018:10 Pages 2499—2507
DOI https://doi.org/10.2147/CMAR.S160901
Checked for plagiarism Yes
Review by Single anonymous peer review
Peer reviewer comments 3
Editor who approved publication: Professor Harikrishna Nakshatri
Wen-Zhuo He,1,* Qiu-Xia Yang,2,* Jin-Ye Xie,3,* Peng-Fei Kong,1 Wan-Ming Hu,4 Lin Yang,1 Yuan-Zhong Yang,4 Qian-Kun Xie,1 Chang Jiang,1 Chen-Xi Yin,1 Gui-Fang Guo,1 Hui-Juan Qiu,1 Bei Zhang,1 Liang-Ping Xia1
1VIP Region, State Key Laboratory of Oncology in South China, Collaborative Innovation Center for Cancer Medicine, Sun Yat-sen University Cancer Center, Guangzhou, Guangdong 510060, People’s Republic of China; 2Department of Medical Imaging, State Key Laboratory of Oncology in South China, Collaborative Innovation Center for Cancer Medicine, Sun Yat-sen University Cancer Center, Guangzhou, Guangdong, 510060, People’s Republic of China; 3Department of Biochemistry, Zhongshan School of Medicine, Sun Yat-sen University, Guangzhou, Guangdong 510060, People’s Republic of China; 4Department of Pathology, State Key Laboratory of Oncology in South China, Collaborative Innovation Center for Cancer Medicine, Sun Yat-sen University Cancer Center, Guangzhou, Guangdong 510060, People’s Republic of China
*These authors contributed equally to this work
Background: Skeletal muscle depletion is a prognostic factor in patients with cancer. Here, we evaluated the association between the skeletal muscle index (SMI) and local and systemic responses in patients with colon cancer.
Patients and methods: We analyzed the relationships of the SMI with neutrophil, lymphocyte, monocyte, and platelet counts; the neutrophil-to-lymphocyte ratio; albumin levels; and C-reactive protein levels in a cohort of 561 patients, and with the circulating levels of 39 cytokines in a cohort of 125 patients. We also studied the association between the SMI and tumor local inflammatory response and the effect of SMI on survival.
Results: The median SMIs for male and female subjects were 44.1 and 34.2 cm2/m2, respectively. We observed positive correlations of the SMI with neutrophil (p=0.022), lymphocyte (p=0.001), and monocyte counts (p=0.003). A low SMI correlated significantly with an increased platelet count (p=0.017), decreased albumin level (p=0.006), neutrophil-to-lymphocyte ratio >3 (p=0.021), and an increased interferon γ-induced protein 10 level (IP-10, r = –0.276, p=0.002). The SMI did not correlate significantly with local inflammatory reactions or the C-reactive protein level. Finally, the SMI was a significant prognosticator in patients with stage III colon cancer (3-year disease-free survival rates: 35.1% for the low SMI arms versus 46.0% in the high SMI arms; HR =2.036; p=0.034).
Conclusion: This study highlights the association of a low SMI with a high systematic inflammatory response and IP-10 levels. Furthermore, low SMI is a predictor of poor disease-free survival in patients with stage III colon cancer.
Keywords: colon cancer, skeletal muscle, interferon γ-induced protein 10
Introduction
Skeletal muscle depletion, an indicator of sarcopenia, is associated with poor physical function and nutritional statuses.1 The skeletal muscle index (SMI), which can be easily evaluated using computed tomography (CT), has increasingly attracted research attention. For example, in a surgical context, a low SMI was associated with an increased incidence of surgical site infection and prolongation of the hospital stay.2,3 Moreover, a low SMI has been shown to impair survival and increase chemotherapy-related toxicity.4
A recent study described cross-talk between systemic inflammation and sarcopenia;5 specifically, systemic inflammation may contribute to muscle breakdown, which in turn leads to an enhanced inflammatory response. Cancer cells can cooperate with other cells in the microenvironment and trigger inflammation, a process with various cytokines released.6 The cytokines may contribute to the loss of muscle mass. Additionally, Feliciano et al5 identified a positive association between an increased neutrophil-to-lymphocyte ratio (NLR) and the incidence of sarcopenia in patients with colorectal cancer (CRC). However, the potential associations of sarcopenia with other systemic inflammatory indexes, such as platelets, monocytes, and C-reactive protein (CRP) levels, remain to be studied.7,8 To our knowledge, no prior study has evaluated the association between the SMI and local tumor environmental factors, such as infiltrating neutrophils and lymphocytes.
Against this background, we aimed to investigate the relationships of the SMI with both systemic and local inflammatory factors in patients with CRC. We additionally studied the correlations of the SMI and with the circulating levels of cytokines in a cohort of patients who previously underwent cytokine analysis.9
Patients and methods
Patient selection
This study was approved by the ethics review board of Sun Yat-sen University Cancer Center. All included patients met the following criteria: 1) primary tumor resection and pathological diagnosis of colon cancer at Sun Yat-sen University Cancer Center between 2009 and 2014; 2) available pretreatment routine blood analysis records; 3) available pre-surgical CT images; and 4) available follow-up information. Patients with infections, hematological disease, hyperpyrexia, intestinal perforation, or intestinal obstruction at diagnosis were excluded. All patients provided written informed consent to participate in the study.
Clinical and pathological data
A dataset was constructed prospectively at Sun Yat-sen University Cancer Center. The following data were retrospectively collected from medical records: age, sex, height, weight, primary tumor location, TNM staging, differentiation, mucinous histology, primary tumor size, neural invasion, venous invasion, mismatch repair status, and carcinoembryonic antigen (CEA) status. The following systemic inflammation markers were also analyzed: leukocyte, neutrophil, lymphocyte, monocyte, platelet counts, and albumin and CRP levels. Routine blood analyses were conducted using a Sysmex XE-5000™ Automated Hematology System (Sysmex, Shanghai, People’s Republic of China). CRP levels were tested using a Hitachi Automatic Analyzer 7600-020 (Hitachi, Tokyo, Japan). CEA levels were evaluated using a Roche 2010 Chemistry Analyzer (F. Hoffmann-La Roche Ltd, Basel, Switzerland). The NLR, calculated as the ratio of neutrophil to lymphocyte counts, was used to stratify patients into 2 groups (NLR >3 and ≤3).
Two pathologists blinded to the clinical data assessed the carcinoma percentage, neutrophil infiltration (both central region and invasive margin), lymphocyte infiltration (central region and invasive margin), and Crohn’s-like reactions, as previously reported.10,11 Inflammatory cell reactions (neutrophils and lymphocytes) were estimated by screening the central tumor areas and invasive margins in hematoxylin and eosin-stained histological sections. All sections containing the most invasive part of the primary tumor were selected to avoid bias, and 4–6 sections were routinely evaluated per tumor. We used a 4-degree scale to assess the infiltration of neutrophils and lymphocytes. A score of 0 indicated an absence of reaction, 1 was weak, 2 indicated moderate, and 3 was severe increase of each cell type. Absent and weak (0–1) were combined as low grade, while moderate to severe increase (2–3) were high grade. If the 2 pathologists reached different conclusions, an agreement was reached through careful discussion.
The following cytokines were analyzed in a cohort of patients with metastatic CRC: IL-1α, IL-1β, IL-1RA, IL-2, IL-3, IL-4, IL-5, IL-6, IL-7, IL-8, IL-9, IL-10, IL-13, IL-15, IL-17, IL-12 P40, IL-12 P70, EGF, eotaxin, G-CSF, GM-CSF, IFNα-2, IFNγ, interferon γ-induced protein 10 (IP-10), MCP-1, MCP-3, MIP-1α, MIP-1β, TNFα, TNFβ, VEGF, FGF-2, TGF-α, FIT-3L, fractalkine, GRO, MDC, sCD40L, and sIL-2Rα.
Measurement of SMI
The baseline (ie, 1 month before surgery) enhanced CT images (slice thickness: 5 mm) were used to evaluate the SMI. One radiologist identified a single axial image at the third lumbar vertebral level on which both transverse processes were initially fully visualized.12 The axial CT image was then analyzed using the semiautomated GE Reformat postprocessing tool supplied with the GE picture archiving and communication systems workstation (Centricity® Radiology RA1000; GE Medical Healthcare, Little Chalfont, UK) to determine the cross-sectional skeletal muscle at a Hounsfield unit threshold of –29 to 150, as previously described.13 The skeletal muscle area was then quantified automatically and recorded. The following skeletal muscles were measured: psoas, erector spinae, quadratus lumborum, transversus abdominis, external and internal obliques, and rectus abdominis. The SMI was calculated by dividing the skeletal muscle area by the height squared (cm2/m2). Most previous studies of sarcopenia in patients with CRC have been conducted in Western countries, and accordingly no consensus has been reached regarding the optimal SMI cut-off point for defining sarcopenia in Asian patients with CRC. In our study, therefore, we classified patients into low and high SMI groups according to the median SMI values for men and women, respectively.
Patient treatment and follow-up
Patients with colon cancer underwent primary tumor resection at our hospital. All patients were chemotherapy-naïve before surgery, and no adjuvant chemotherapy was provided to patients with stage I colon cancer. The administration of adjuvant chemotherapy to patients with stage II colon cancer was determined based on the patient’s risk factors and physician’s decision. Patients with stage III colon cancer were administered ~6-month course of oxaliplatin-based adjuvant chemotherapy. All patients were followed up through outpatient visits and telephone interviews. The last date of follow-up was August 31, 2017.
Statistical analyses
All statistical analyses were performed using SPSS version 22 (IBM Corporation, Armonk, NY, USA). Frequencies and descriptive statistics were used to compare patient characteristics, and relationships between 2 continuous variables were tested using nonparametric tests or Pearson correlation coefficients as appropriate. Disease-free survival (DFS) was defined as the time from diagnosis to the time of the first event (locoregional recurrence, metastasis, or death). Survival curves were calculated using the Kaplan–Meier method and compared using the log-rank test. A multivariate analysis based on a Cox proportional hazards model was used to test independent significance via the backward elimination of insignificant explanatory variables. A P-value of <0.05 was considered to indicate statistical significance.
Results
Patient characteristics
The study cohort included 343 men and 218 women with a median age of 59 years (range: 19–87 years). Of them, 210 (37.4%) patients had right-sided colon cancer and 346 (61.7%) had left-sided colon cancer. The median SMIs for men and women were 44.1 and 34.2 cm2/m2, respectively.
Notably, 383 (68.3%) patients met the definition of sarcopenia according to the cut-off point used in the study by Feliciano et al.5 The distributions of the patients’ clinicopathological features and their correlations with the SMI are shown in Table 1. Particularly, a low SMI was associated with increasing age (p<0.001), a larger primary tumor (p=0.018), and a lower body mass index (p<0.001).
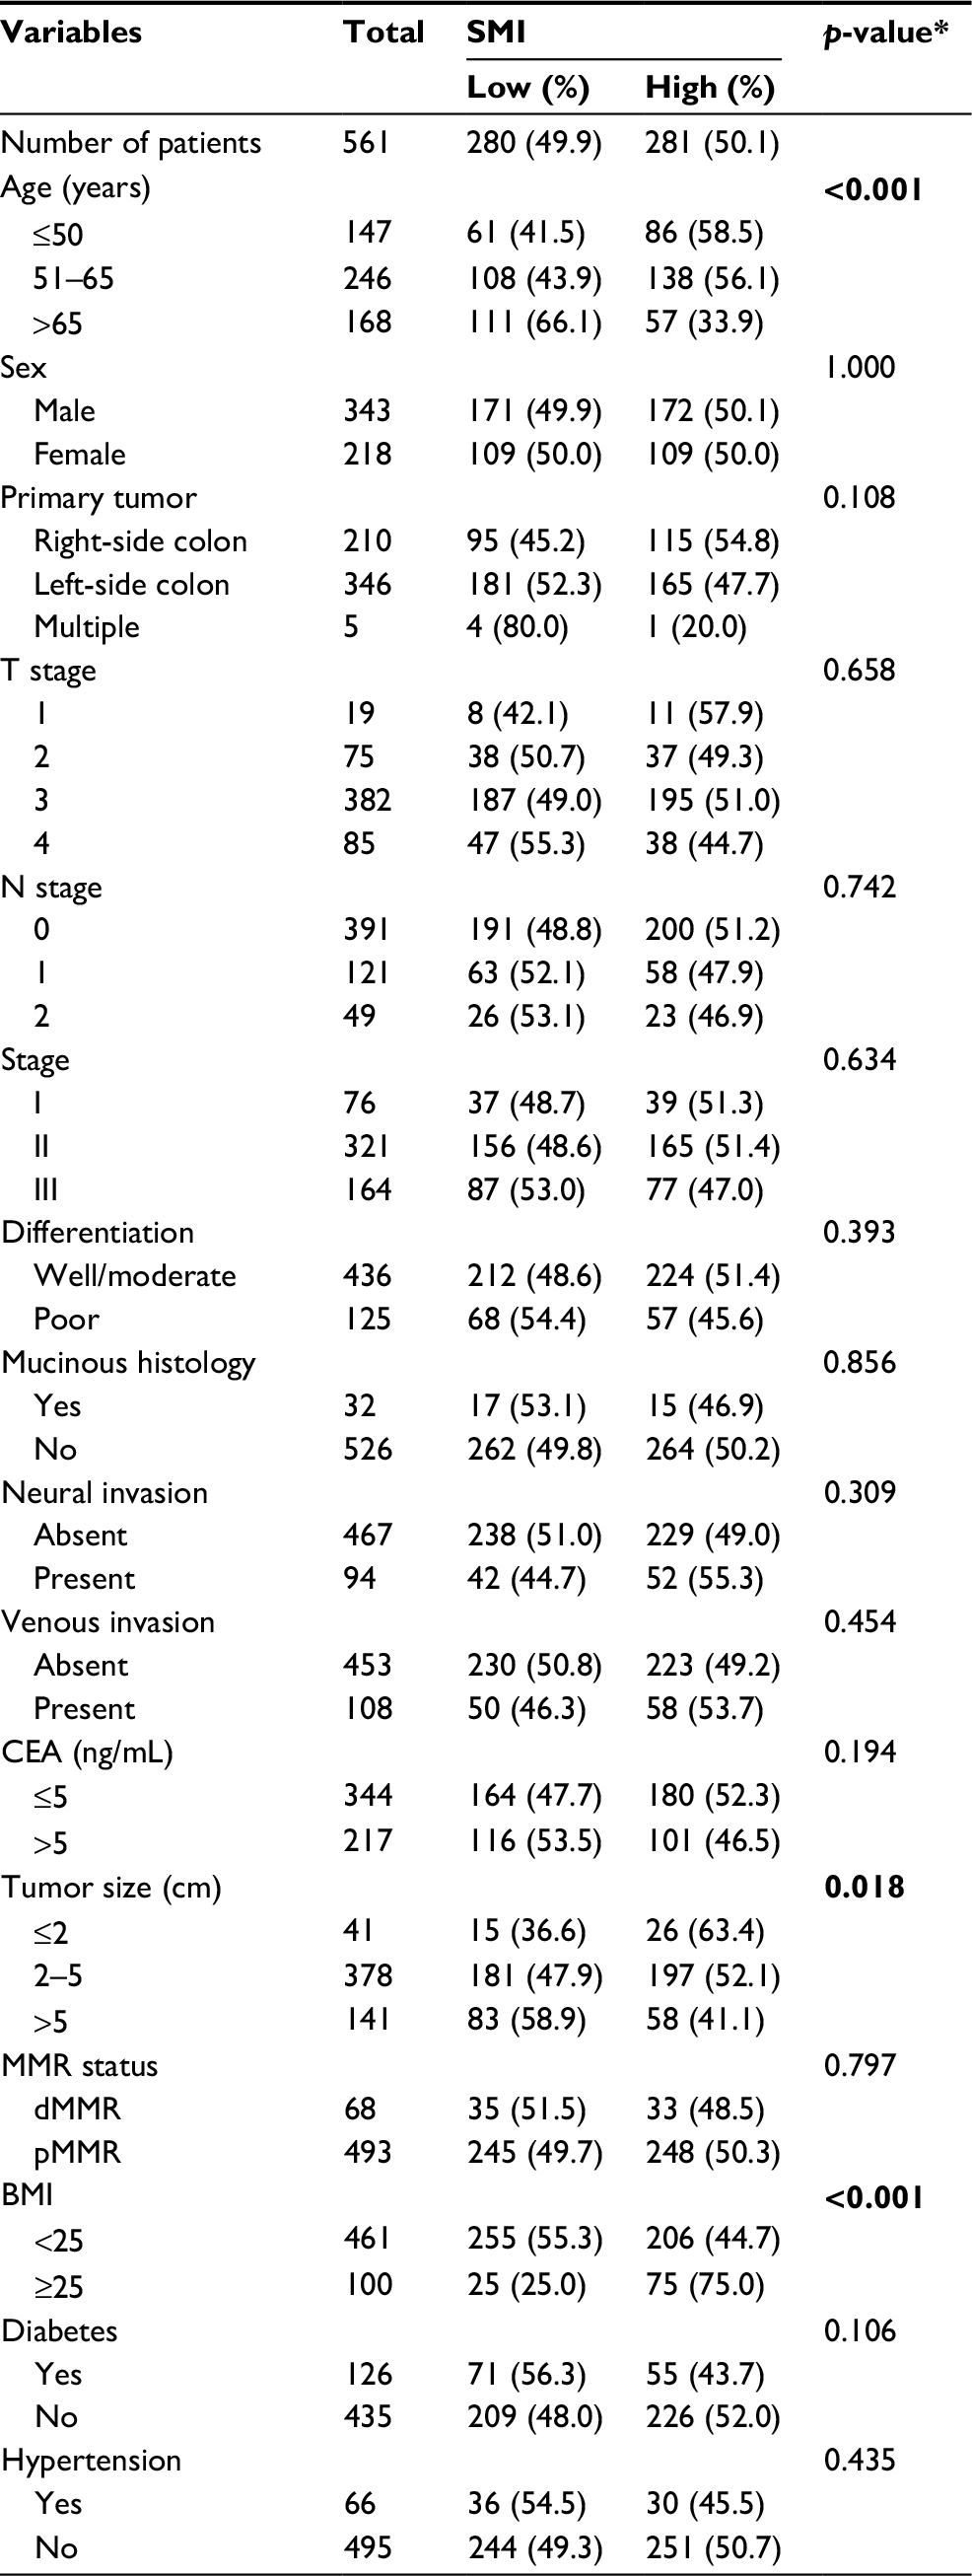 | Table 1 Correlations between SMI and patients’ characteristics Notes: *χ2 test was used to compare patient characteristics, and p-value <0.05 shown in bold was statistically significant. Abbreviations: BMI, body mass index; CEA, carcinoembryonic antigen; MMR, mismatch repair; SMI, skeletal muscle index. |
SMI and inflammatory factors
SMI was not found to correlate with local inflammatory reactions, as shown in Table 2. Then, we studied the relation between SMI and systemic inflammatory response. Among 280 patients with a low SMI, 96 (34.3%) had an NLR >3, whereas only 71 (25.3%) of 281 patients with a high SMI had an NLR >3 among (p=0.021). Similarly, a low SMI was found to correlate significantly with a decreased albumin level (p=0.006), but not with the CRP level (p=0.129).
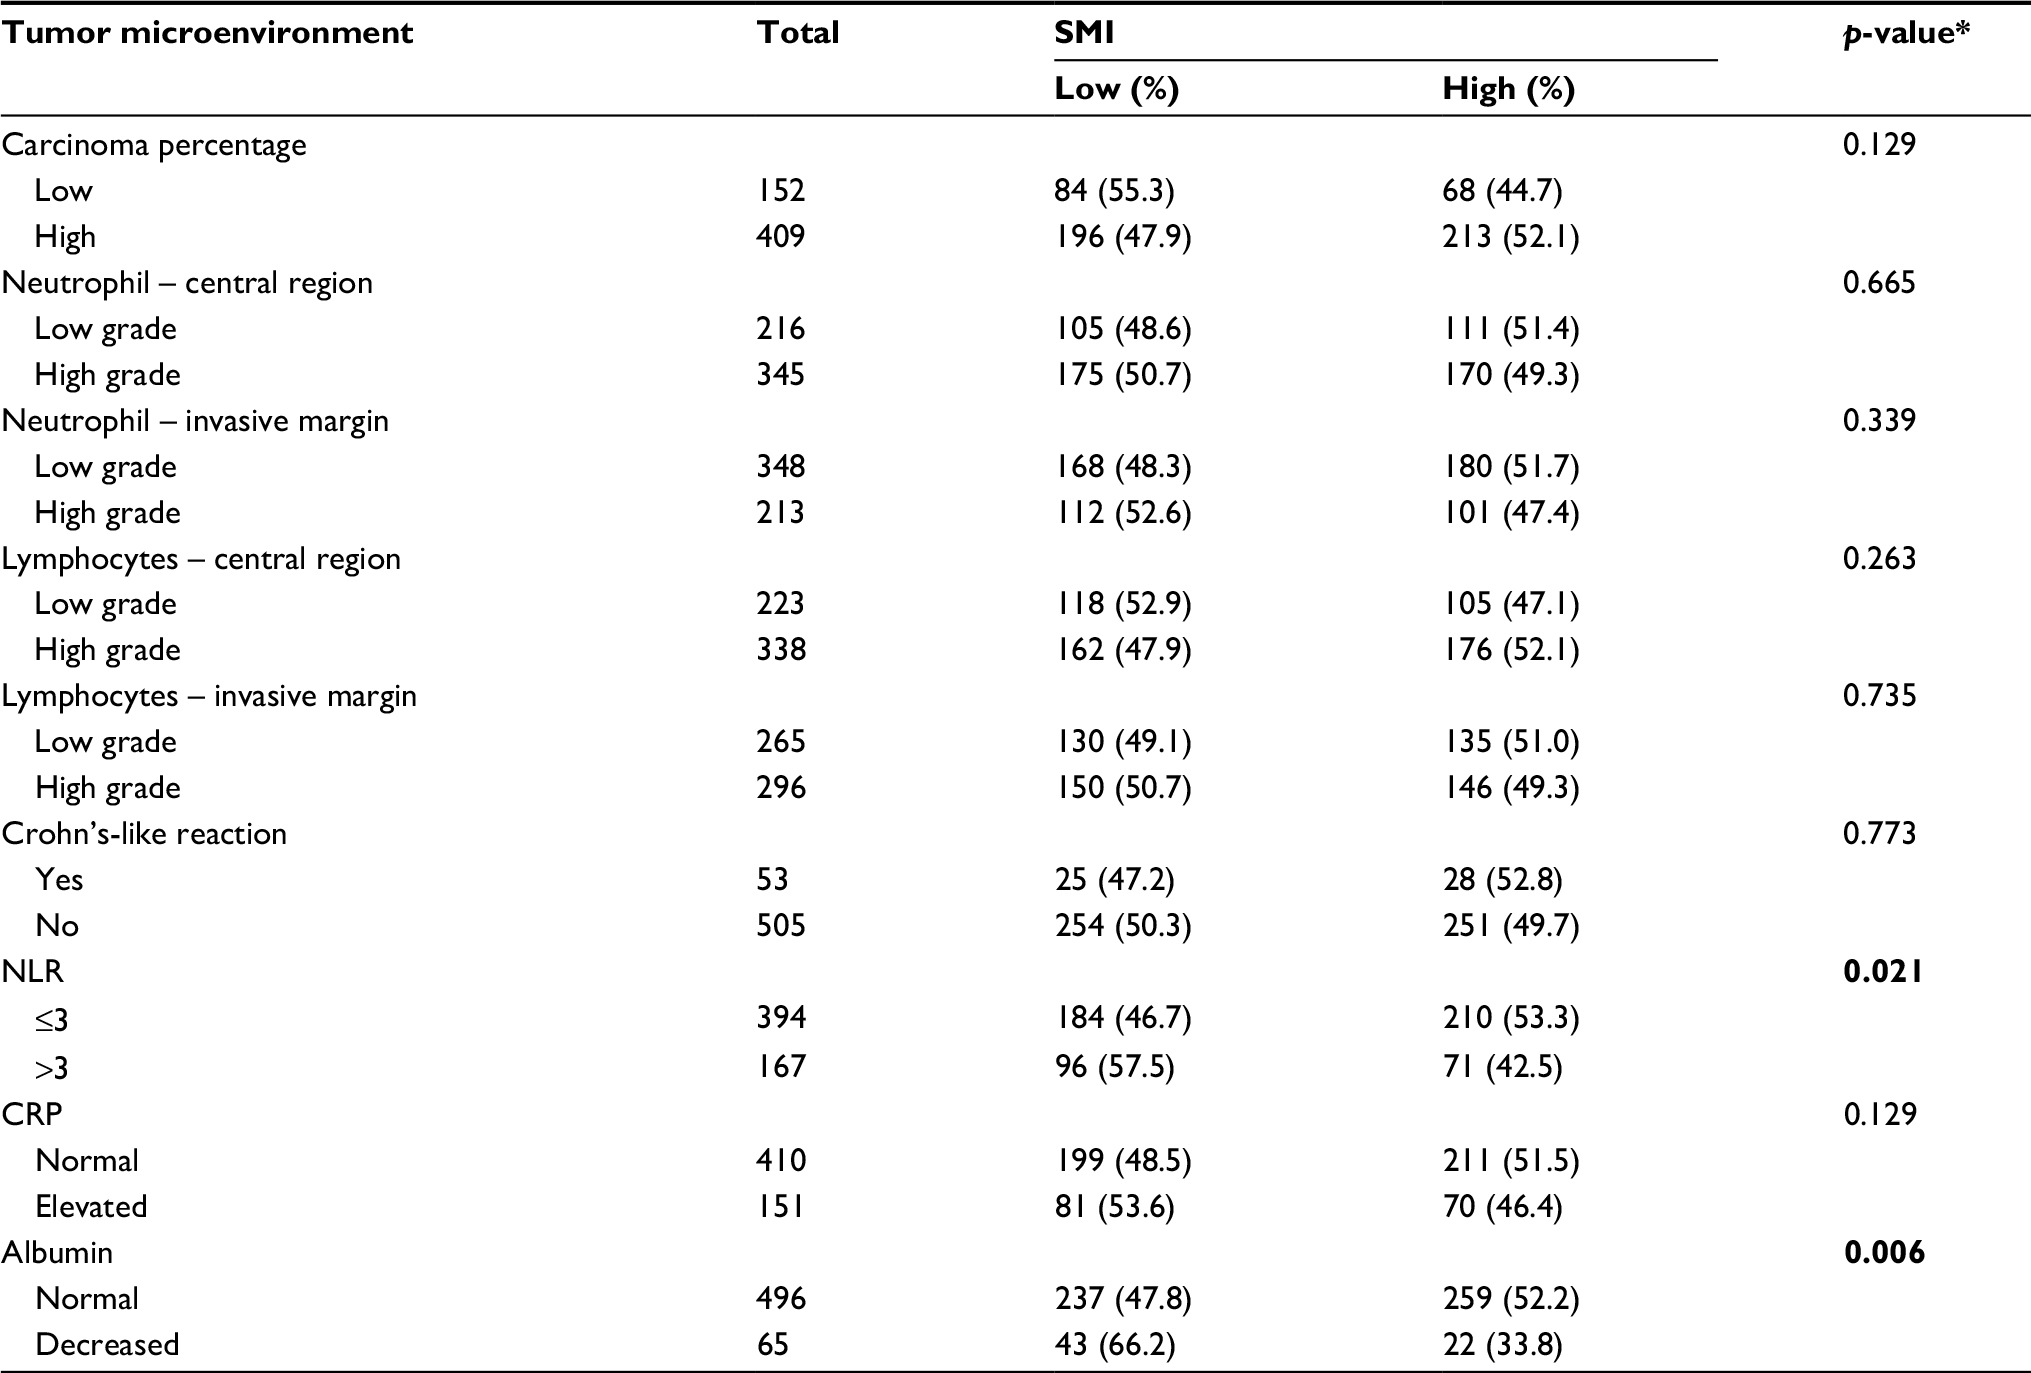 | Table 2 Correlation between skeletal muscle mass and the local tumor microenvironment Notes: *χ2 test was used to compare patient characteristics, and p-value <0.05 shown in bold was statistically significant. Abbreviations: CRP, C-reactive protein; NLR, neutrophil-to-lymphocyte ratio; SMI, skeletal muscle index. |
To further evaluate the relationship between the SMI and systemic inflammatory response, correlations of the absolute SMI values with the leukocyte, neutrophil, lymphocyte, monocyte, and platelet counts and CRP levels were investigated (Figure 1). Notably, we found that the SMI correlated positively with leukocyte (p=0.019), neutrophil (p=0.022), lymphocyte (p=0.001), and monocyte counts (p=0.003) and negatively with the platelet count (p=0.017). No significant correlation was observed between the SMI and CRP level (p=0.402).
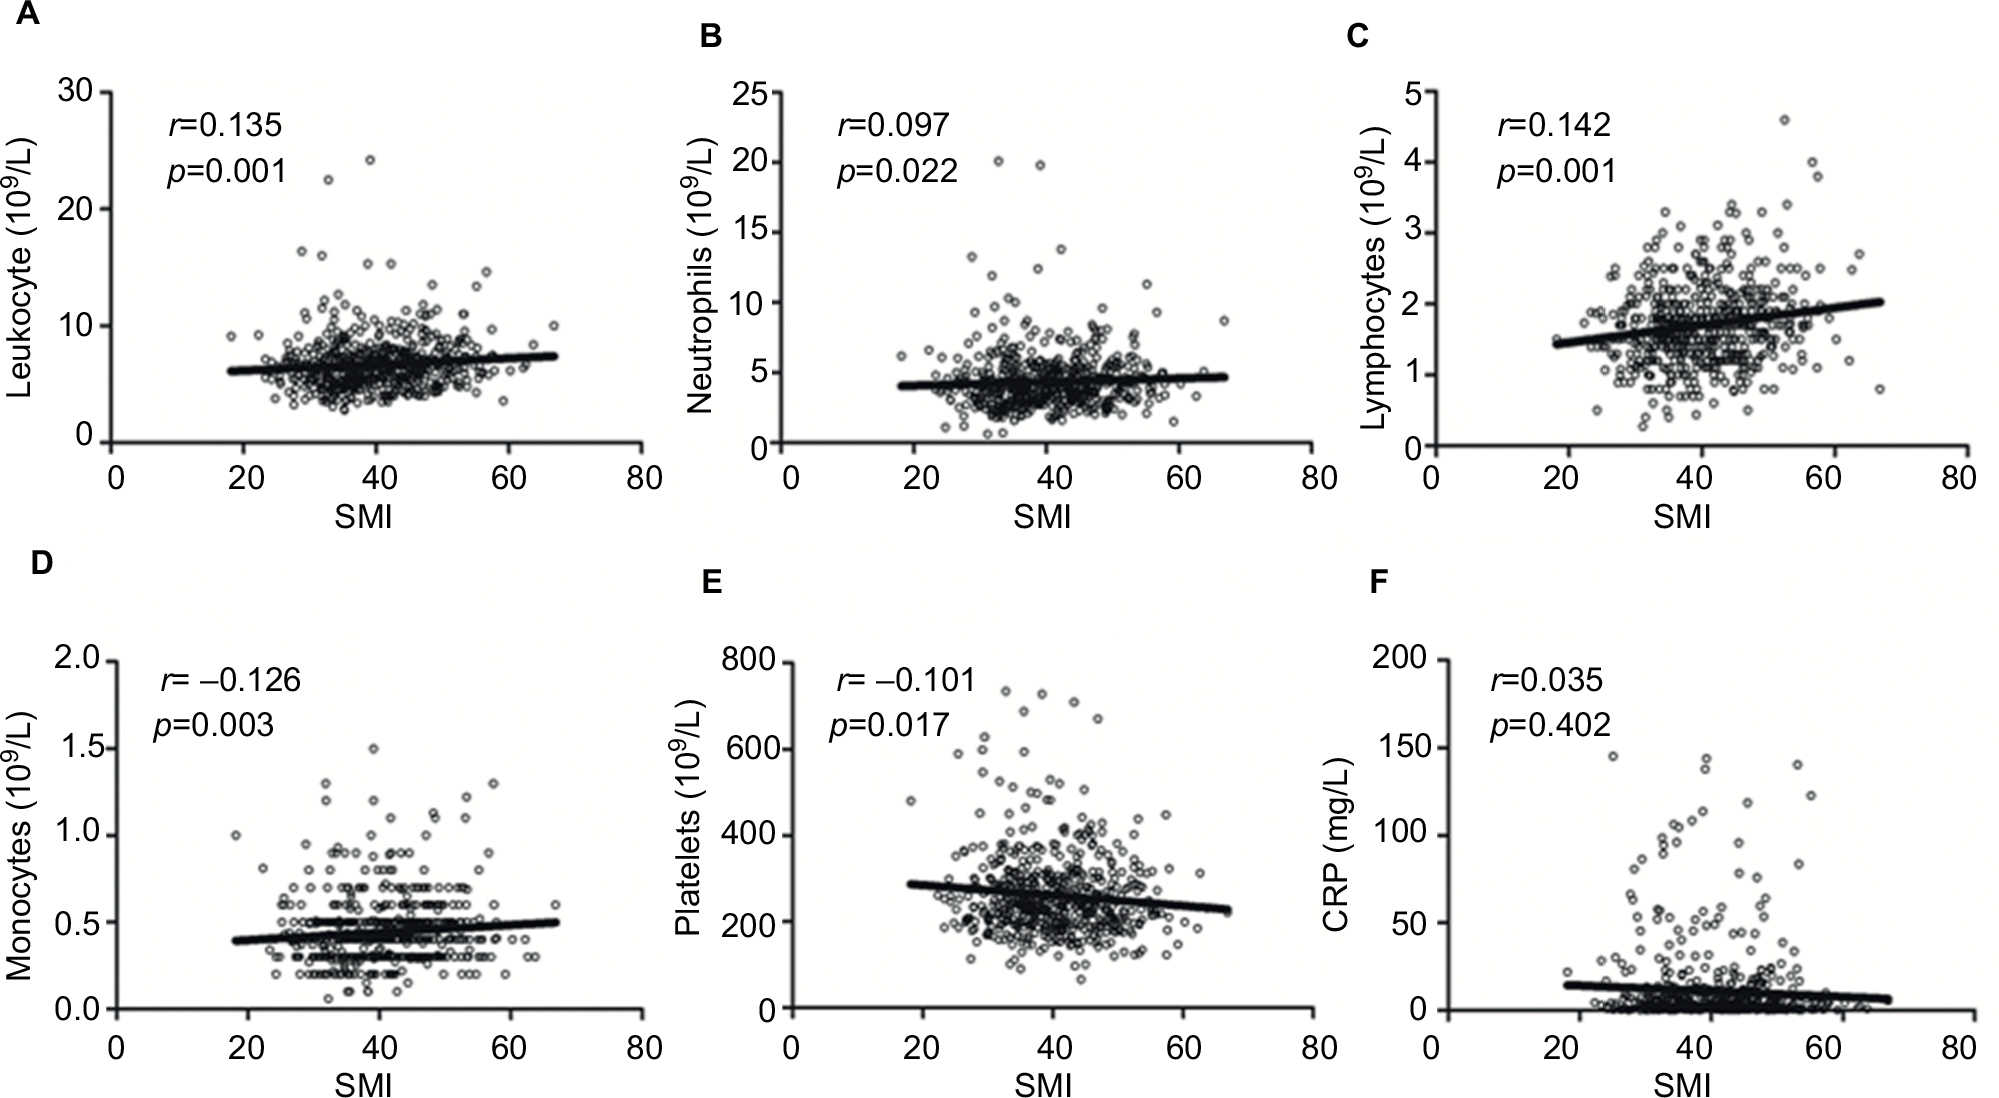 | Figure 1 Correlations between the SMI and the leukocyte (A), neutrophil (B), lymphocyte (C), monocyte (D), platelet counts (E), and CRP level (F). Abbreviations: CRP, C-reactive protein; SMI, skeletal muscle index. |
Survival according to SMI and tumor stage
The survival data for all 561 patients included in this study are shown in Figure S1. The 3-year DFS rates were 57.0% in the low SMI population and 56.4% in the high SMI population, indicating a lack of a significant association of the SMI with DFS (HR =1.025; p=0.950) in patients with stage I + II disease. However, the SMI was found to have prognostic value in patients with stage III disease, with 3-year DFS rates of 35.1% in the low SMI population and 46.0% in the high SMI population (HR =2.036; p=0.034; Figure 2). Furthermore, a multivariate analysis revealed that the prognostic value of the SMI was independent of age, sex, T stage, N stage, the CEA level, and NLR (Table 3).
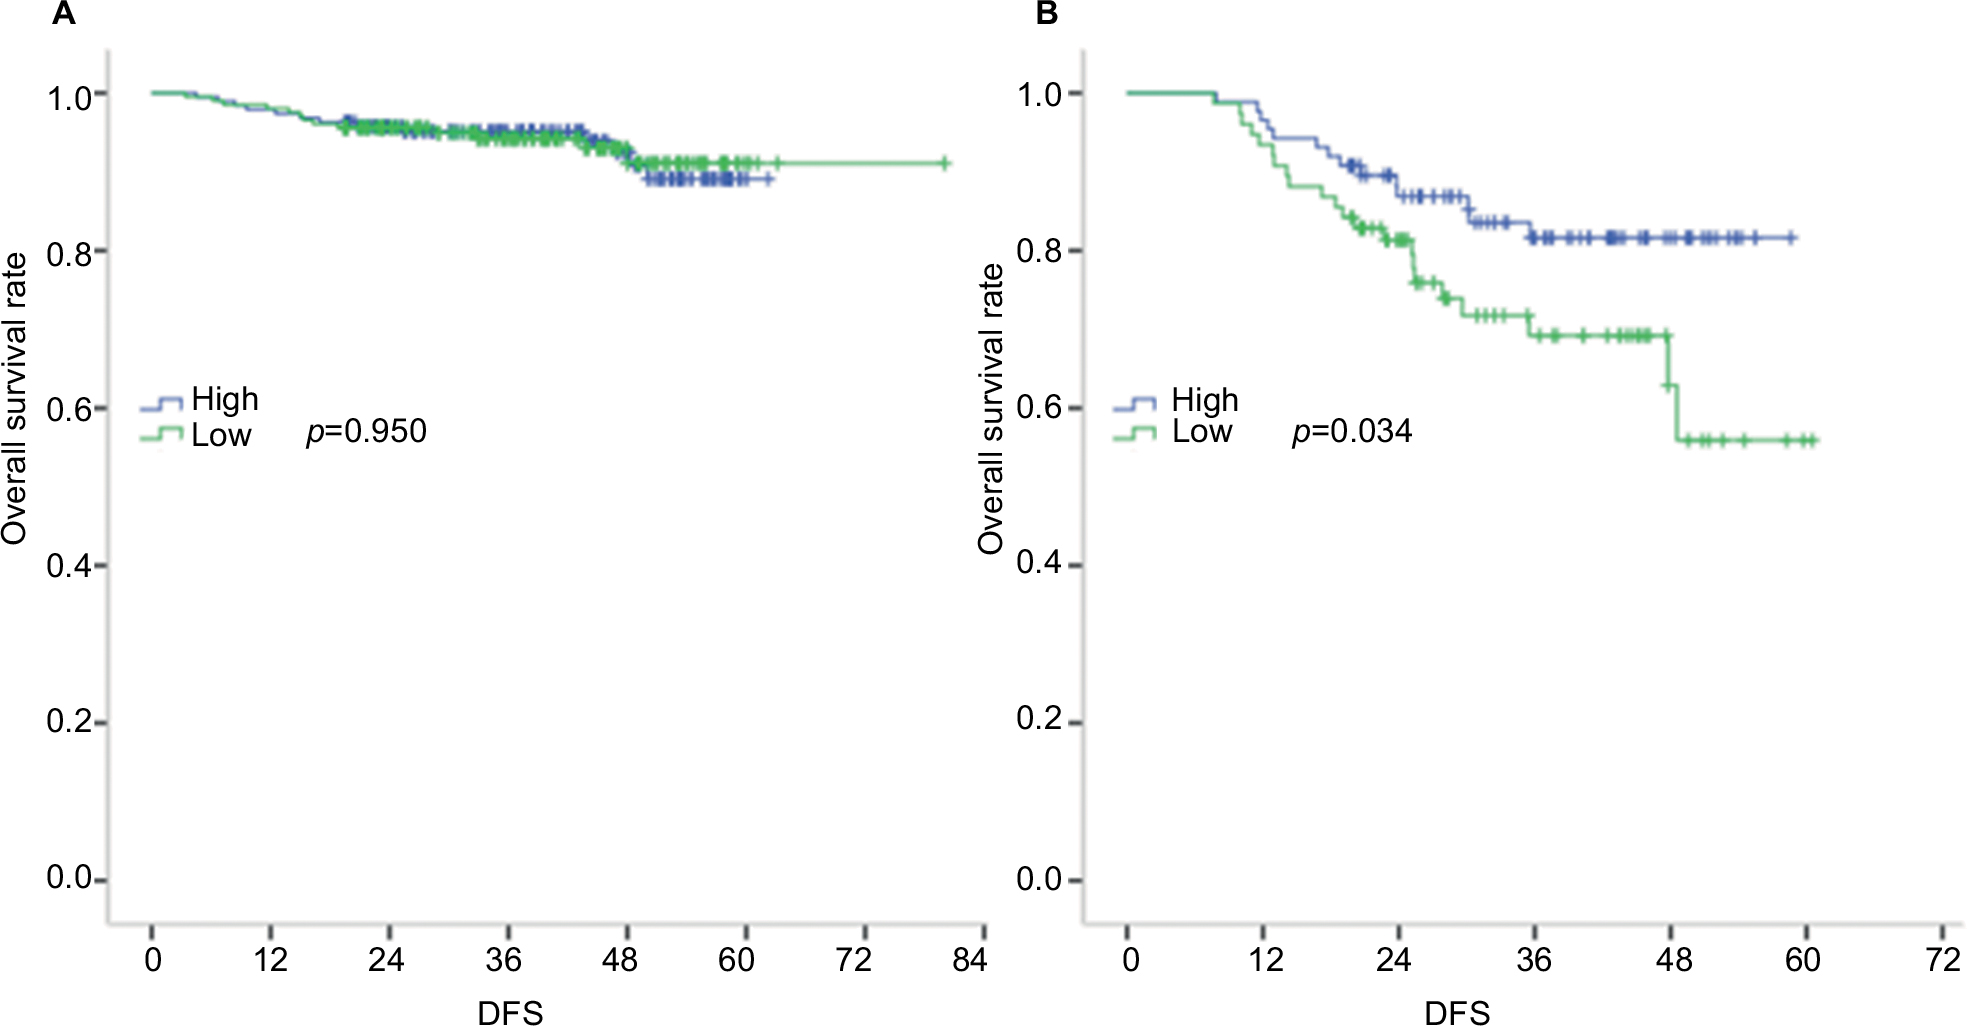 | Figure 2 DFS of patients with stage I + II (A) and stage III (B) colon cancer, stratified by SMI. Abbreviations: DFS, disease-free survival; SMI, skeletal muscle index. |
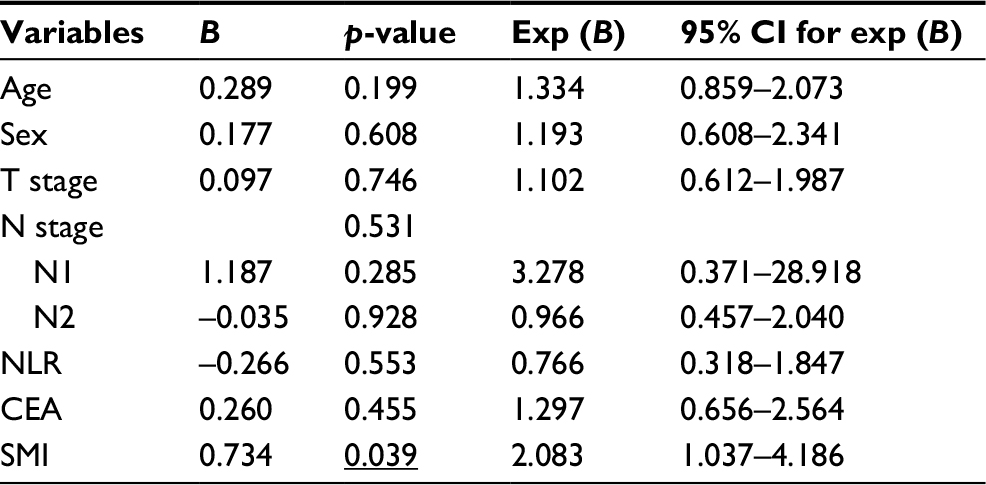 | Table 3 Multivariate analysis of prognostic factors in patients with stage III colon cancer Abbreviations: CEA, carcinoembryonic antigen; Exp (B), exponent of B; NLR, neutrophil-to-lymphocyte ratio; SMI, skeletal muscle index. |
Associations of SMI with circulating levels of cytokines
We previously tested the circulating levels of cytokines in another cohort of 176 patients with CRC,9 including 125 patients with colon cancer and available CT scan data within 1 month after diagnosis. The clinical characteristics of these patients are shown in Table S1. A decreased SMI was found to associate with an increased IP-10 level (r = –0.276, p=0.002; Figure 3). No associations were observed between the SMI and other cytokines.
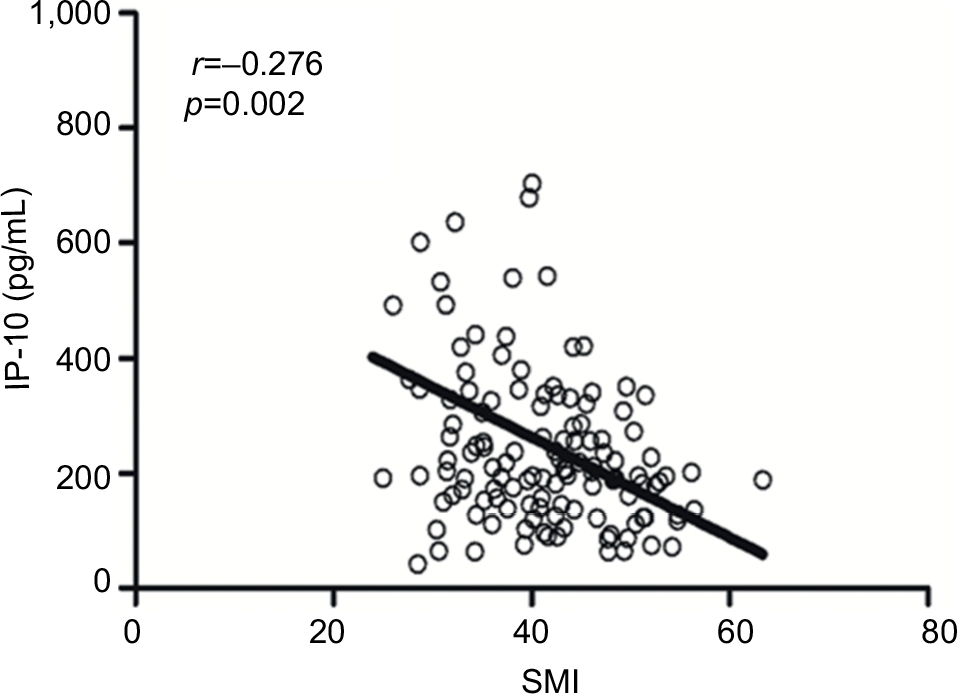 | Figure 3 Correlation between the SMI and IP-10 level. Abbreviations: IP-10, interferon γ-induced protein 10; SMI, skeletal muscle index. |
Discussion
In this study of patients with colon cancer, we found that a low SMI was associated with an increased NLR and decreased albumin level. Additionally, we observed a negative correlation between the SMI and circulating IP-10 level and confirmed a high SMI as a predictor of a better prognosis in patients with stage III colon cancer. By contrast, we did not observe an association between the SMI and tumor local inflammatory environment in our patient cohort.
The exact mechanism underlying the correlation between the SMI and inflammation in patients with colon cancer remains elusive.5 In this study, we found that a low SMI correlated with an increased IP-10 level, which was previously found to indicate a poor prognosis and higher levels of systemic inflammation markers in patients with colon cancer.14,15 The previous findings that IP-10 expression can be downregulated by running and vitamin D16,17 suggest that lifestyle changes can correct a low SMI. Consistent with a previous study by Itoh et al,18 we found that SMI correlated with host factors, but not with tumor factors. Additionally, patients with a low SMI may benefit from exercise, and Shin and Lee16 reported that running could reduce IP-10 levels. Other potential interventions include an increased protein intake and the use of (n-3) fatty acids and anti-inflammatory drugs.19 In brief, the potential reversibility and simple evaluability of the SMI merit further attention.
As noted previously, most studies of SMI in patients with colon cancer have been conducted in Western countries,19,20 and we used the cut-off value reported by Feliciano et al5 to classify ~70% of patients in our study as having sarcopenia. Although a recent report proposed a diagnostic algorithm to promote sarcopenia research in Asia,1 the most optimal SMI cut-off value remains controversial. We note that the sex-specific SMI cut-off points used in our study are similar to those used previously in other Asian studies18,20 and recommend additional prospective studies with larger cohorts to identify the optimal value.
Unlike Feliciano et al,5 we did not observe a relationship between the SMI and DFS in patients with stage II colon cancer. We might attribute this discrepancy to the diverse prognoses of patients with stage II colon cancer.21 Additionally, the patients included in the study by Feliciano et al5 were followed for longer than those in our study.
This study had several limitations. First, we applied a retrospective study design and were unable to evaluate the physical performances or muscle strengths of the involved patients. Second, the circulating levels of cytokines were tested only in a cohort of patients with metastatic CRC. Third, as most patients remain alive, we were unable to evaluate overall survival.
Conclusion
In conclusion, this study highlights the correlations of a low SMI with a high systematic inflammation response and IP-10 level. Finally, we identified a low SMI as a predictor of poor DFS in patients with stage III colon cancer.
Data availability
The authenticity of this article has been validated by uploading the key raw data onto the Research Data Deposit public platform. (www.researchdata.org.cn), with the approval RDD number as RDDA2018000654.
Acknowledgments
This work was supported by grants from the Natural Science Foundation of Guangdong, People’s Republic of China (2015A030313010), the Science and Technology Program of Guangzhou, China (1563000305), and the National Natural Science Foundation of the People’s Republic of China (81272641 and 81572409).
Disclosure
The authors report no conflicts of interest in this work.
References
Chen LK, Liu LK, Woo J, et al. Sarcopenia in Asia: consensus report of the Asian Working Group for Sarcopenia. J Am Med Dir Assoc. 2014;15(2):95–101. | ||
Reisinger KW, van Vugt JL, Tegels JJ, et al. Functional compromise reflected by sarcopenia, frailty, and nutritional depletion predicts adverse postoperative outcome after colorectal cancer surgery. Ann Surg. 2015;261(2):345–352. | ||
van Vugt JLA, Buettner S, Levolger S, et al. Low skeletal muscle mass is associated with increased hospital expenditure in patients undergoing cancer surgery of the alimentary tract. PLoS One. 2017;12(10):e0186547. | ||
Chemama S, Bayar MA, Lanoy E, et al. Sarcopenia is associated with chemotherapy toxicity in patients undergoing cytoreductive surgery with hyperthermic intraperitoneal chemotherapy for peritoneal carcinomatosis from colorectal cancer. Ann Surg Oncol. 2016;23(12):3891–3898. | ||
Feliciano EMC, Kroenke CH, Meyerhardt JA, et al. Association of systemic inflammation and sarcopenia with survival in nonmetastatic colorectal cancer: results from the C SCANS study. JAMA Oncol. 2017;3(12):e172319. | ||
Curtale G. MiRNAs at the crossroads between innate immunity and cancer: focus on macrophages. Cells. 2018;7(2):pii:E12. | ||
Richards CH, Roxburgh CS, MacMillan MT, et al. The relationships between body composition and the systemic inflammatory response in patients with primary operable colorectal cancer. PLoS One. 2012;7(8):e41883. | ||
Reisinger KW, Derikx JP, van Vugt JL, et al. Sarcopenia is associated with an increased inflammatory response to surgery in colorectal cancer. Clin Nutr. 2016;35(4):924–927. | ||
Chen ZY, He WZ, Peng LX, et al. A prognostic classifier consisting of 17 circulating cytokines is a novel predictor of overall survival for metastatic colorectal cancer patients. Int J Cancer. 2015;136(3):584–592. | ||
Klintrup K, Makinen JM, Kauppila S, et al. Inflammation and prognosis in colorectal cancer. Eur J Cancer. 2005;41(17):2645–2654. | ||
Ogino S, Nosho K, Irahara N, et al. Lymphocytic reaction to colorectal cancer is associated with longer survival, independent of lymph node count, microsatellite instability, and CpG island methylator phenotype. Clin Cancer Res. 2009;15(20):6412–6420. | ||
Shen W, Punyanitya M, Wang Z, et al. Total body skeletal muscle and adipose tissue volumes: estimation from a single abdominal cross-sectional image. J Appl Physiol (1985). 2004;97(6):2333–2338. | ||
Heymsfield SB, Smith R, Aulet M, et al. Appendicular skeletal muscle mass: measurement by dual-photon absorptiometry. Am J Clin Nutr. 1990;52(2):214–218. | ||
Blank S, Nienhuser H, Dreikhausen L, et al. Inflammatory cytokines are associated with response and prognosis in patients with esophageal cancer. Oncotarget. 2017;8(29):47518–47532. | ||
Kibe S, Yutani S, Motoyama S, et al. Phase II study of personalized peptide vaccination for previously treated advanced colorectal cancer. Cancer Immunol Res. 2014;2(12):1154–1162. | ||
Shin YO, Lee JB. Leukocyte chemotactic cytokine and leukocyte subset responses during ultra-marathon running. Cytokine. 2013;61(2):364–369. | ||
Scolletta S, Colletti M, Di Luigi L, Crescioli C. Vitamin D receptor agonists target CXCL10: new therapeutic tools for resolution of inflammation. Mediators Inflamm. 2013;2013:876319. | ||
Itoh S, Shirabe K, Matsumoto Y, et al. Effect of body composition on outcomes after hepatic resection for hepatocellular carcinoma. Ann Surg Oncol. 2014;21(9):3063–3068. | ||
Shachar SS, Williams GR, Muss HB, Nishijima TF. Prognostic value of sarcopenia in adults with solid tumours: a meta-analysis and systematic review. Eur J Cancer. 2016;57:58–67. | ||
Huang DD, Chen XX, Chen XY, et al. Sarcopenia predicts 1-year mortality in elderly patients undergoing curative gastrectomy for gastric cancer: a prospective study. J Cancer Res Clin Oncol. 2016;142(11):2347–2356. | ||
Labianca R, Nordlinger B, Beretta GD, et al. Early colon cancer: ESMO Clinical Practice Guidelines for diagnosis, treatment and follow-up. Ann Oncol. 2013;24(Suppl 6): vi64–vi72. |
Supplementary materials
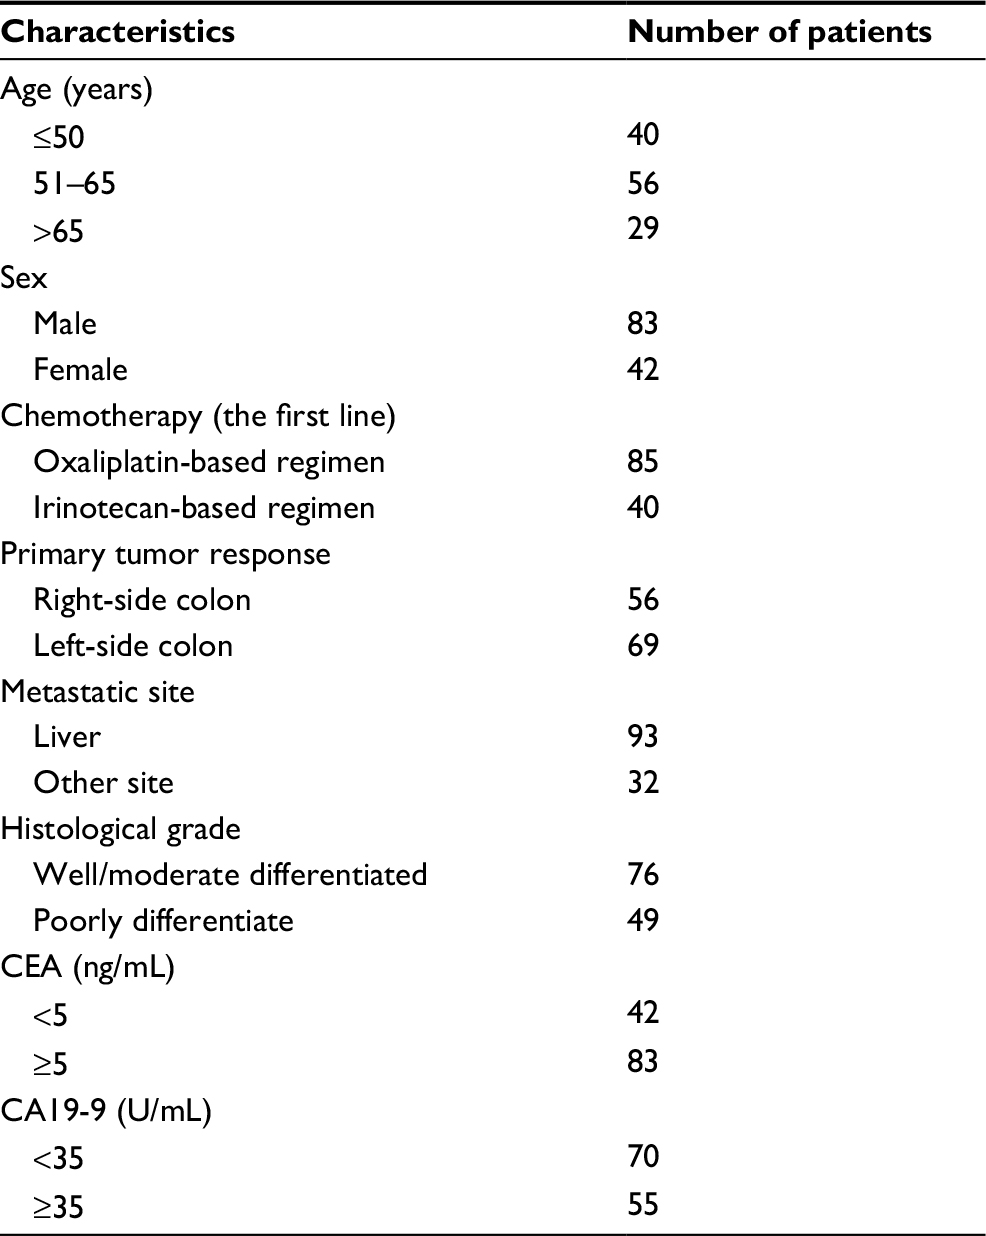 | Table S1 Clinical characteristics of patients with available CT scan results and circulating cytokine levels Abbreviations: CEA, carcinoembryonic antigen; CT, computed tomography. |
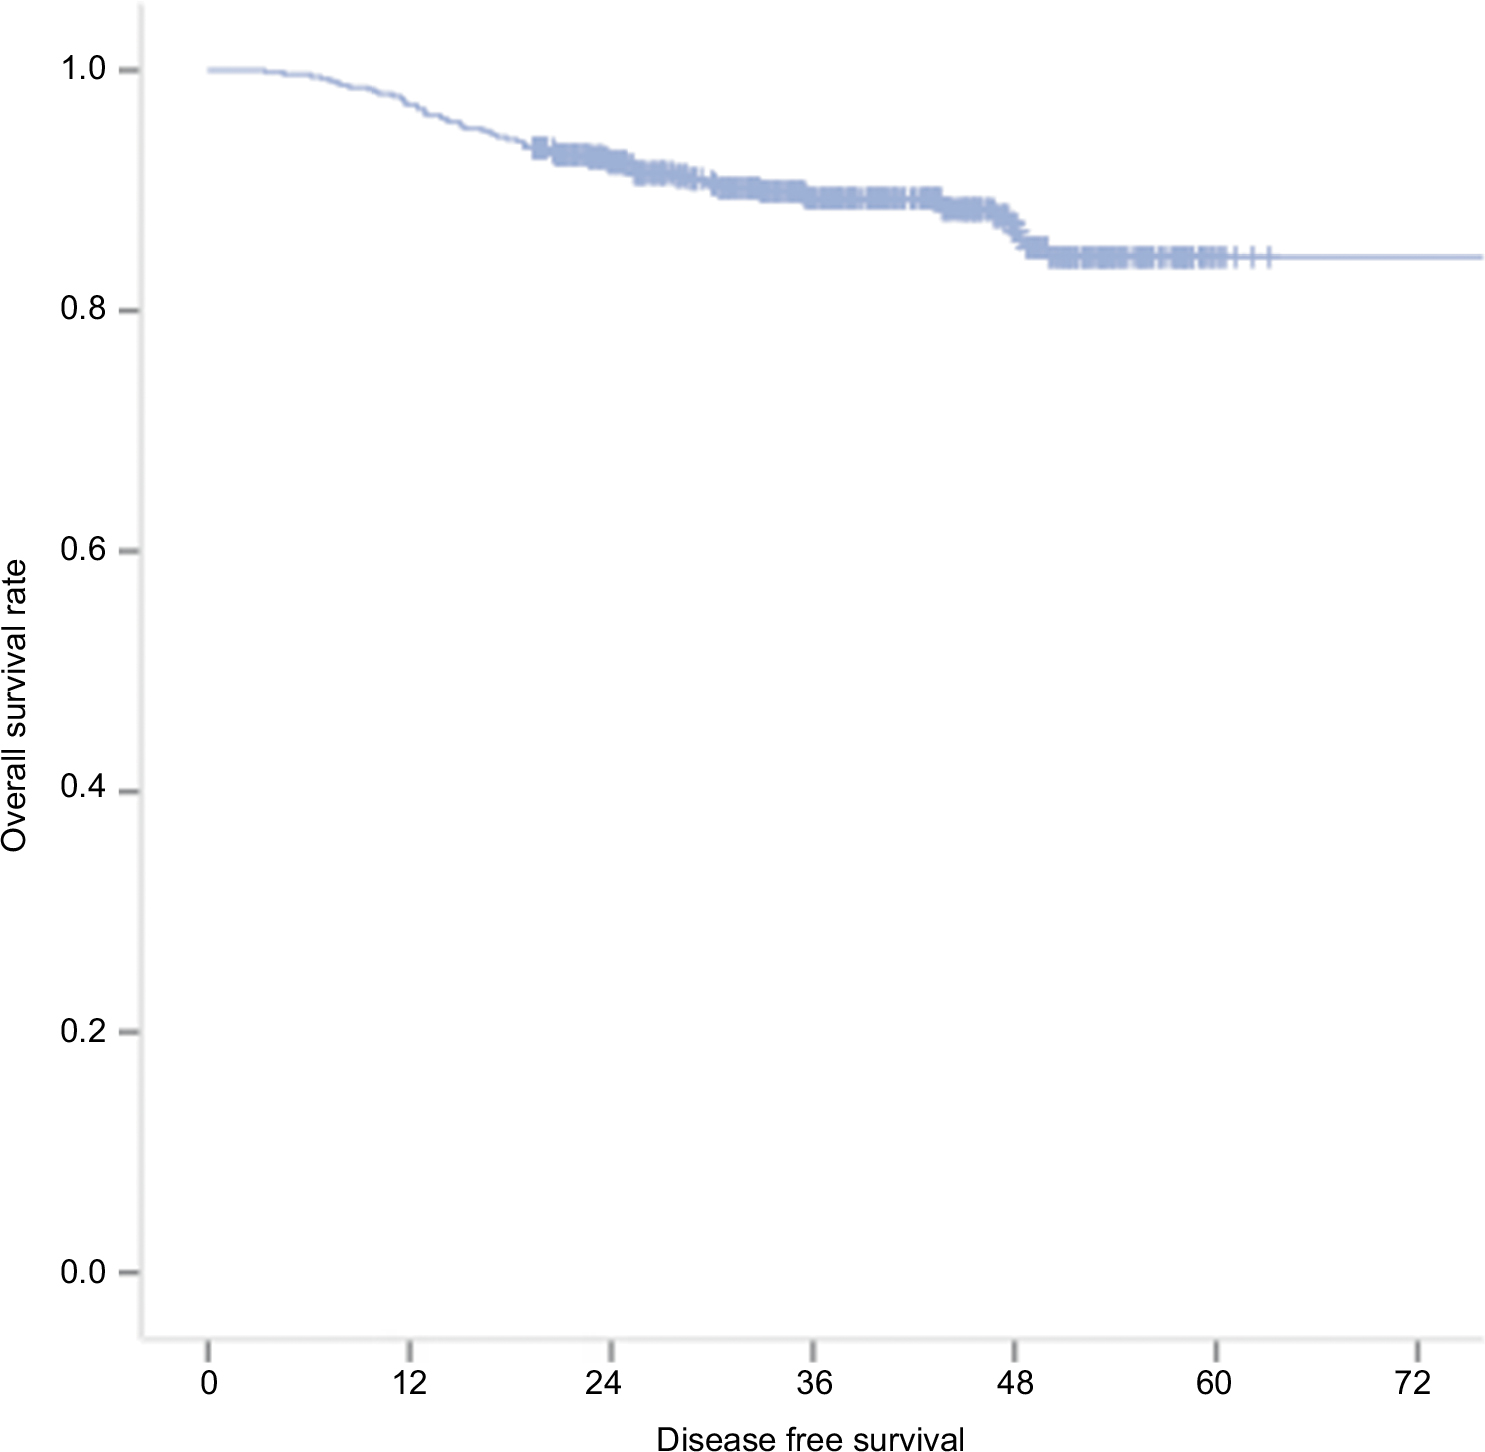 | Figure S1 The survival data in all 561 patients included in this study. |
 © 2018 The Author(s). This work is published and licensed by Dove Medical Press Limited. The full terms of this license are available at https://www.dovepress.com/terms.php and incorporate the Creative Commons Attribution - Non Commercial (unported, v3.0) License.
By accessing the work you hereby accept the Terms. Non-commercial uses of the work are permitted without any further permission from Dove Medical Press Limited, provided the work is properly attributed. For permission for commercial use of this work, please see paragraphs 4.2 and 5 of our Terms.
© 2018 The Author(s). This work is published and licensed by Dove Medical Press Limited. The full terms of this license are available at https://www.dovepress.com/terms.php and incorporate the Creative Commons Attribution - Non Commercial (unported, v3.0) License.
By accessing the work you hereby accept the Terms. Non-commercial uses of the work are permitted without any further permission from Dove Medical Press Limited, provided the work is properly attributed. For permission for commercial use of this work, please see paragraphs 4.2 and 5 of our Terms.