")
Back to Journals » Nature and Science of Sleep » Volume 13
Association of Hypertriglyceridemic Waist Phenotype with Obstructive Sleep Apnea: A Cross-Sectional Study
Authors Gu M, Huang W , Li X , Liu Y , Wang F, Fang C, Chen T
Received 20 August 2021
Accepted for publication 6 December 2021
Published 18 December 2021 Volume 2021:13 Pages 2165—2173
DOI https://doi.org/10.2147/NSS.S335288
Checked for plagiarism Yes
Review by Single anonymous peer review
Peer reviewer comments 3
Editor who approved publication: Dr Sarah L Appleton
Meizhen Gu,1,2,* Weijun Huang,2,3,* Xinyi Li,2,3 Yupu Liu,2,3 Fan Wang,2,3 Chao Fang,2,4 Ting Chen2,5
1Department of Otolaryngology-Head & Neck Surgery, Shanghai Children’s Hospital, Shanghai Jiao Tong University, Shanghai, People’s Republic of China; 2Shanghai Key Laboratory of Sleep Disordered Breathing, Shanghai, People’s Republic of China; 3Department of Otolaryngology Head & Neck Surgery, Shanghai Jiao Tong University Affiliated Sixth People’s Hospital, Shanghai, People’s Republic of China; 4Department of Otolaryngology-Head & Neck Surgery, The First Hospital of Putian, Putian, Fujian Province, People’s Republic of China; 5Department of Stomatology, Shanghai Jiao Tong University Affiliated Sixth People’s Hospital, Shanghai, People’s Republic of China
*These authors contributed equally to this work
Correspondence: Chao Fang; Ting Chen Email [email protected]; [email protected]
Objective: Hypertriglyceridemic waist (HTGW) phenotype is an independent risk factor for metabolic disorders. Although obstructive sleep apnea (OSA) is associated with metabolic disorders, it is unclear whether there is an association between HTGW phenotype and OSA.
Methods: We enrolled consecutive participants presenting to a sleep center in Shanghai, China. Full-night polysomnography was performed, and serum triglyceride (TG) levels and waist circumference (WC) were calculated. HTGW phenotype was defined as increased WC (men > 90 cm, women > 80 cm) and elevated TG levels (> 1.7 mmol/L). Participants were classified into four groups: normal TG with normal WC (NTNW); normal TG with increased WC (NTGW); elevated TG with normal WC (HTNW); and elevated TG with enlarged WC, namely HTGW. The relationships between HTGW phenotypes and OSA were assessed using binary (apnea hypopnea index, [AHI]≥ 5/hr) and multinomial logistic regression analyses (clinical AHI severity categories).
Results: We included 3190 participants in this cross-sectional study. Compared to the NTNW phenotype, participants with NTGW and HTGW phenotypes had the significantly higher risk of OSA (AHI ≥ 5/hr, odds ratio [OR] = 2.51, 95% confidence interval [CI] = 1.91– 3.31; OR = 3.76, 95% CI = 2.67– 5.31, respectively), after adjustment for confounders. In subgroup analyses categorised by age, sex, and BMI, the aforementioned associations remained significant. The association between the NTGW, HTGW phenotype and OSA risk remained significant across the OSA severity groups. Multinomial logistic regression also revealed that the mild (OR = 1.63, 95% CI = 1.07– 2.50), moderate (OR = 1.875, 95% CI = 1.22– 2.88), and severe OSA (OR = 3.18, 95% CI = 2.14– 4.73) were associated with HTGW phenotype.
Conclusion: Both NTGW and HTGW phenotype were positively associated with OSA risk in all subgroups. Further longitudinal follow-up studies are needed to determine the causal link and prognostic role of these metabolic factors.
Keywords: obstructive sleep apnea, waist circumference, hypertriglyceridemia
Introduction
Obstructive sleep apnea (OSA), one of the most common sleep disorders, affects about 23.4% of women and 49.7% of men in Europe.1,2 The prevalence of OSA is increasing because of the increasing prevalence of obesity worldwide.1 Overall, it is estimated that 50% to 60% of people who are obese and patients with the metabolic syndrome (MS) have OSA.3 In recent meta-analysis, it estimated that 936 million adults aged 30–69 years have mild to severe OSA and 425 million adults aged 30–69 years have moderate to severe OSA globally.2 It is characterized by recurrent episodes of upper airway collapse, secondary intermittent hypoxia (IH), hypercapnia, and sleep fragmentation.4 OSA is a component of MS, and is associated with several metabolic disorders, such as dyslipidemia, obesity, hypertension, diabetes, and cardiovascular disease.5–7 Thus, OSA imposes a significant social and economic burden globally, especially in China.2 OSA and MS are highly correlated. About 50–80% of OSA subjects have MS, while the prevalence of MS in non-OSA ones is 10–30%.8
Previous studies used multiple parameters to predict the risk of OSA, such as elevated serum lipid levels (triglycerides [TG], total cholesterol [TC], low-density lipoprotein [LDL], and high-density lipoprotein [HDL]) and increased obesity indices (neck, hip, and waist circumferences [WC]).9–12 Other clinical OSA cohorts with high rates of obesity or lean patients reported that associations between TG and apnea-hypopnea index (AHI)/ oxygen reduction index (ODI) were also existed.13–15
Hypertriglyceridemic waist (HTGW) phenotype, defined as increased WC with an elevated TG level, is cheap and easy to determine. It is commonly used to screen for gestational16 or type217 diabetes mellitus, as well as for hypertension,18 increased urinary albumin-creatinine ratio,19 hepatic steatosis,20 and cardiovascular disease.21 Because OSA is associated with MS and many of the aforementioned diseases, we hypothesized that HTGW phenotype might predict the risk of OSA.
To the best of our knowledge, only one previous study evaluated the HTGW phenotype in the context of sleep medicine,22 and found that short sleepers had a higher likelihood of having the HTGW phenotype compared to long sleepers (7–8 h sleep/day). It is unclear whether there is an association between the HTGW phenotype and OSA. This is the first study to examine the associations of HTGW and three TG waist phenotypes with the risk of OSA. In addition, we also explored the associations between the TG waist phenotypes and stages of OSA.
Methods
Study Participants
This cross-sectional study was conducted in Shanghai, China. Individuals who presented with suspected OSA between 2013 and 2017 were consecutively enrolled. Details of this dynamic cohort study have been published previously.23 Briefly, adults who provided written informed consent were screened for inclusion. Participants with any of the following were excluded: regular use of lipid-lowering drugs; pregnancy; serious diseases, such as cancer, psychiatric diseases, stroke, infectious diseases, or renal, cardiorespiratory, or hepatic failure; Moderate to severe OSA who had continuous positive airway pressure treatment or upper airway surgery and mild OSA who had oral appliance treatment; alcohol use; drug addiction; or incomplete data. After excluding these participants, 3190 were included in the statistical analysis. The study protocol was approved by the Ethics Committee of the Shanghai Jiao Tong University Affiliated Sixth People’s Hospital, and was conducted in accordance with the Declaration of Helsinki.
Basic Data Collection
We used a structured questionnaire to collect general information from each participant, including age, sex, self-reported current or previous chronic diseases, lifestyle factors (such as smoking and alcohol use), and subjective sleep quality. Smoking status was dichotomized (smokers vs non-smokers [never smokers], as was alcohol use (current vs no alcohol use), as previously described.23 After the patients had rested for 15 min, blood pressure was measured three times using an electronic sphygmomanometer, and mean systolic blood pressure (SBP) and diastolic blood pressure (DBP) values were calculated.
Anthropometric Measurements
Weight and height were carefully measured while the participants were wearing light clothes and no shoes, as previously described.12 WC was measured at the end of normal expiration, at the midpoint between the lower costal margin and the iliac crest, as previously described.12 Hip circumference was measured at the maximum girth at the level of the greater trochanter, as previously described.12 Details regarding the aforementioned measurements have been published previously.23 All measurements were taken twice, and mean values were used for the statistical analysis.
Biochemical Measurements
Patients have been informed of the study and gave their informed consent for the blood test. Fasting venous blood was collected at 7:00 am, after polysomnography (PSG). Fasting serum lipid (TG, TC, HDL, and LDL) levels were measured by the hospital laboratory using routine procedures, as previously described.12 The serum glucose was measured using an H-7600 autoanalyzer (Hitachi, Tokyo, Japan). Fasting serum insulin was measured using immunoradiology method.
PSG Assessment
For objective assessment of overnight sleep quality, laboratory-based PSG (Alice 5; Respironics, Pittsburgh, PA, USA) was performed. Standard PSG uses multiple signal channels to monitor electroencephalography, electrocardiography, chin electromyography, electrooculography, thoracic/abdominal movements, body position, oronasal/nasal airflow, and finger oxygen saturation. The PSG was performed between 9 pm and 7 am. Apneas/hypopneas were defined as a decline in airflow of ≥ 90% from baseline for ≥ 10 s, or of ≥ 30% from baseline accompanied by a decrease in SpO2 of ≥ 3% or an arousal. Skilled technicians manually measured the aforementioned objective sleep variables, in accordance with the 2012 guidelines of the American Academy of Sleep Medicine (AASM 2012).24
Definitions
Body mass index (BMI) was calculated as weight/height2 (kg/m2). Hypertension was defined as SBP > 140 mmHg, DBP > 90 mmHg, or use of antihypertensive drugs.25 Diabetes was defined as fasting blood glucose level ≥ 7 mmol/L (126 mg/dL) or use of antidiabetic medications.26 Normal TG levels were < 1.7 mmol/L, while normal WC was < 90 cm for men and < 80 cm for women. Dyslipidemia of TC, HDL-C, and LDL-C was defined as ≥5.17, <1.03, and ≥3.33 mmol/L, respectively, according to the diagnostic criteria of NCEPIII.27 Waist circumference: hip circumference ratio (WHR) was calculated as WC (cm) divided by hip circumference (cm). Participants were classified into four groups based on Ren et al: normal TG with normal WC (NTNW); normal TG with enlarged WC (NTGW); elevated TG with normal WC (HTNW); and elevated TG with enlarged WC, namely HTGW.17 Abnormal obesity was defined as a BMI>28Kg/m2 and abdominal obesity was defined as a WC≥90 cm in male or ≥85 cm in female. The AHI was the average number of apneas/hypopneas per hour of sleep; the ODI was the number of episodes of oxygen desaturation (> 3% decline) per hour of sleep; the mean oxygen saturation (SaO2), lowest oxygen saturation (LSaO2) during sleep and micro-arousal index (ArI, mean number of arousals per hour of sleep) were calculated in accordance with AASM 2012; OSA severity was categorized as non-, mild, moderate or severe as AHI<5, 5~15, 15~30 and ≥30 times per hour, respectively.24
Statistical Analysis
The statistical analyses were performed using SPSS software (version 22.0; IBM Corp., Armonk, NY, USA). The Kolmogorov–Smirnov test was performed to assess the normality of the data distribution. Data with a non-normal distribution were transformed to fit a normal distribution. Continuous data with a normal distribution are presented as means (standard deviations), and that with skewed distribution as medians (interquartile ranges). Categorical data are presented as numbers (percentages). The groups were compared using Student’s t-test, the Mann–Whitney U-test, or the Chi-square test, as appropriate. Logistic regression analyses were performed to determine the associations of TG waist phenotypes with OSA; odds ratios (ORs) and 95% confidence intervals (CIs) were calculated with NTNW as the reference group. The covariates adjusted for in the analysis included BMI, age, sex, smoking status, drinking status, hypertension, diabetes, LDL, HDL, and TC. Multinomial logistic regression analysis with multiple adjustments was also used to assess the associations of TG waist phenotypes with OSA severity categories (non-OSA, mild, moderate, and severe groups). Heatmap based on the Spearman correlation matrix were performed to demonstrate correlations between the PSG indicators and metabolic profiles. Two-sided p-values < 0.05 were considered statistically significant.
Results
Baseline Characteristics
Table 1 summarizes the baseline characteristics of 3190 participants according to OSA severity (median age, 41 years; males, 78.8%; BMI, 26.17 Kg/m2). Compared to participants without OSA (n = 633), those with OSA (n = 2557) were older (42 and 36 years old, respectively; p < 0.001), had a higher BMI (26.73 and 23.85 kg/m2, respectively; p < 0.001), and were more likely to smoke (23.8% and 14.4%, respectively; p < 0.001), and drink alcohol (12.3% and 8.4%, respectively; p < 0.001). Additionally, OSA patients had higher blood glucose levels (5.27 and 5.03 mmol/L, respectively; p < 0.001), insulin levels (11.40 and 7.99 µU/mL, respectively; p < 0.001), SBP (126 and 120 mmHg, respectively; p < 0.001), DBP (80 and 78 mmHg, respectively; p < 0.001), TC (4.77 and 4.41 mmol/L, respectively; p < 0.001), TG (1.67 and 1.20 mmol/L, respectively; p < 0.001), and LDL (2.97 and 2.70 mmol/L, respectively; p < 0.001). The HDL levels were lower in individuals with OSA compared to those without OSA (1.01 and 1.10 mmol/L, respectively; p < 0.001). Importantly, OSA participants had a higher likelihood of having the HTGW phenotype compared to those without OSA. The PSG parameters (AHI, ODI, mean SaO2, LSaO2, and ArI) were worse for participants with OSA compared to those without OSA. Heatmap based on the Spearman correlation matrix demonstrated clear correlations between the PSG indicators and metabolomic profiles. In the heatmap, the correlation coefficients are showed as numbers in squares and are displayed by colors, with weaker correlations between variables displayed in light colors and stronger correlations displayed in darker colors, such as red or violet. The correlation between two different parameters were all significant (p<0.001). The ODI, glucose, insulin, HOMA-IR, TC, TG and LDL were positively correlated with AHI, while LSpO2 and HDL had negative correlation with AHI (Figure 1).
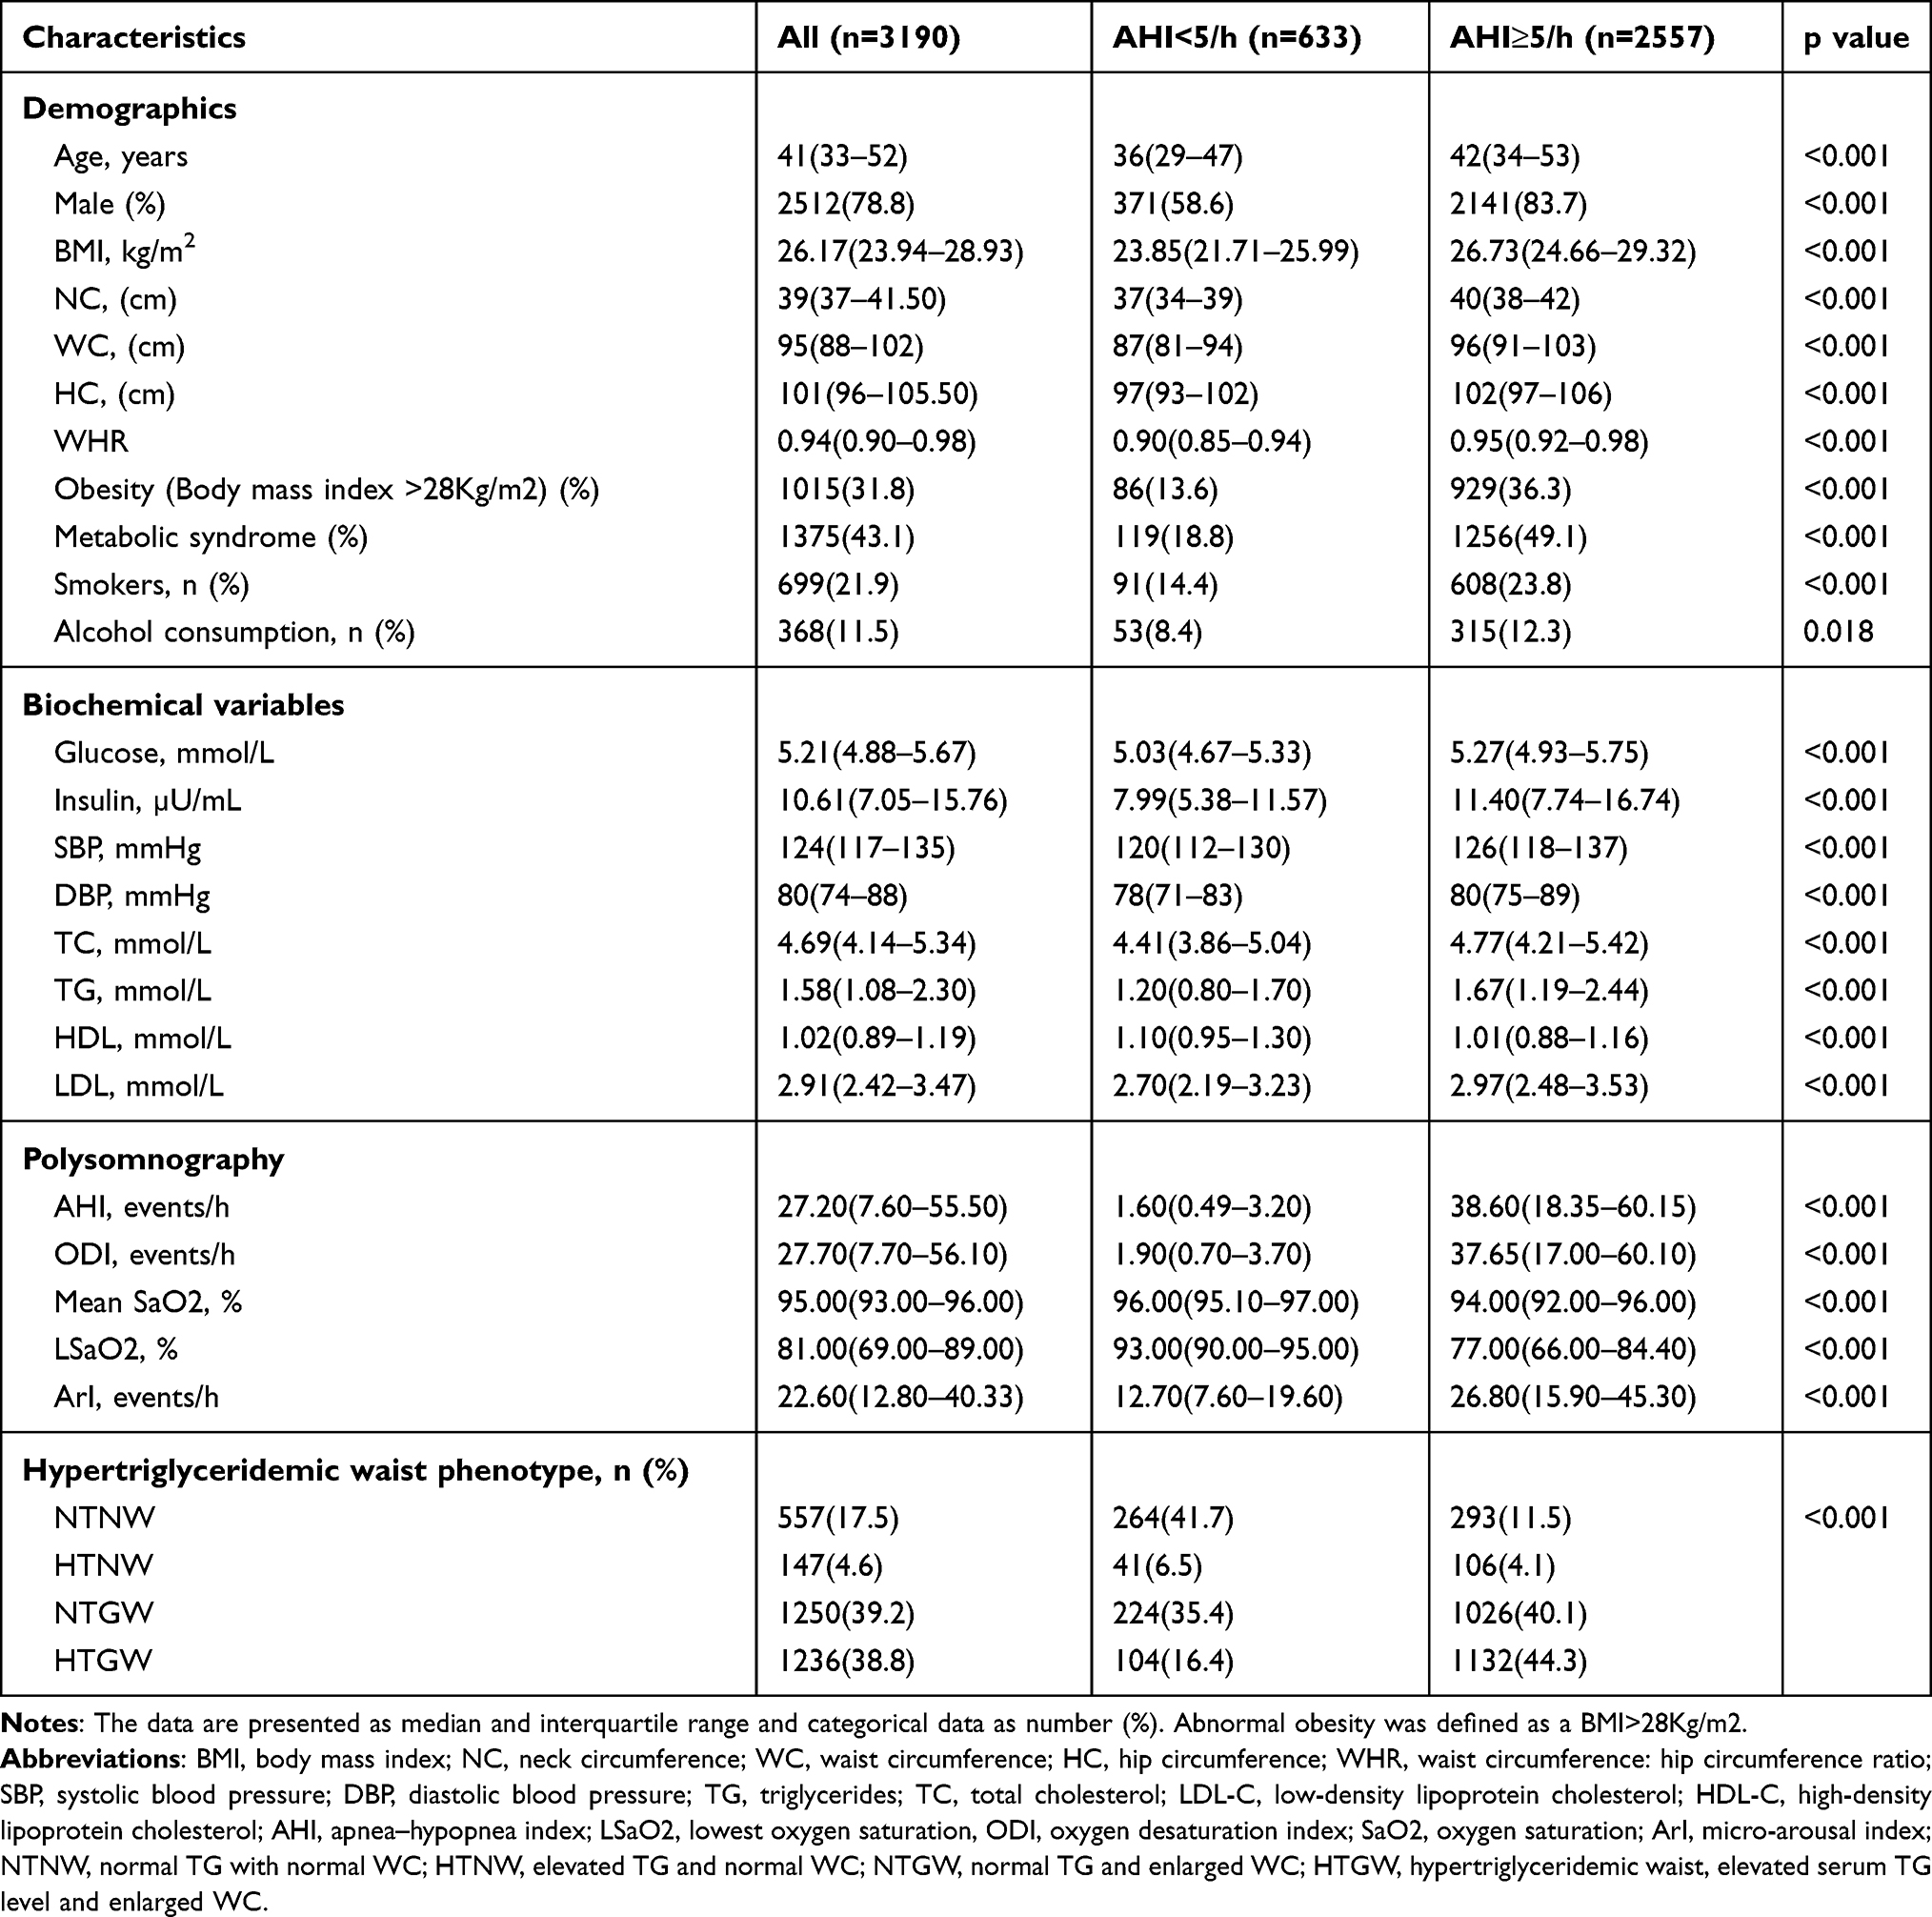 |
Table 1 Basic Characteristics of the Participants |
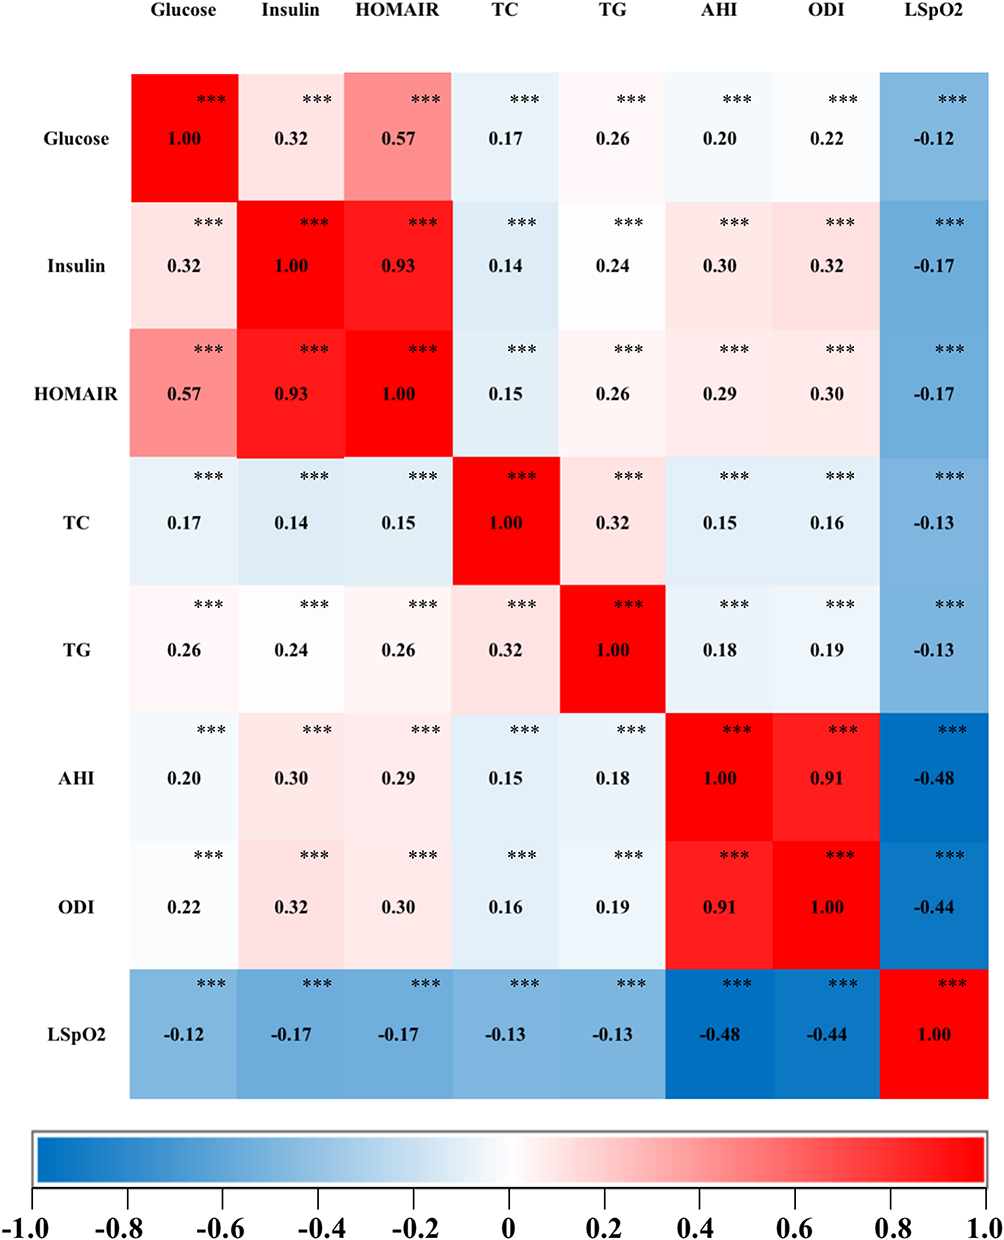 |
Figure 1 Heatmap based on the Spearman correlation matrix demonstrated clear correlations between the clinical indicators and metabolomic profiles of all subjects. The correlation coefficients are showed as numbers in squares and are displayed by colors, with weaker correlations between variables displayed in light colors and stronger correlations displayed in darker colors, such as red or violet. ***Indicated the significance of correlations with p value <0.001. The correlation between two different parameters were all significant (p<0.001). Abbreviations: AHI, apnea–hypopnea index; ODI, oxygen desaturation index; LSpO2, lowest pulse oxygen saturation; HOMA-IR, homeostasis model assessment of insulin resistance; TC, total cholesterol; TG, triglyceride; HDL, high-density lipoprotein cholesterol; LDL, low-density lipoprotein cholesterol. |
Relationships Between TG Waist Phenotypes and OSA
After adjusting for age, sex, BMI, smoking, alcohol use, hypertension, diabetes, LDL, HDL, and TC, the NTGW and HTGW phenotypes were significantly associated with OSA (OR = 2.51, 95% CI = 1.91–3.31; OR = 3.76, 95% CI = 2.67–5.31, respectively), defined as AHI>5 events/h, compared to the NTNW phenotype (Table 2).
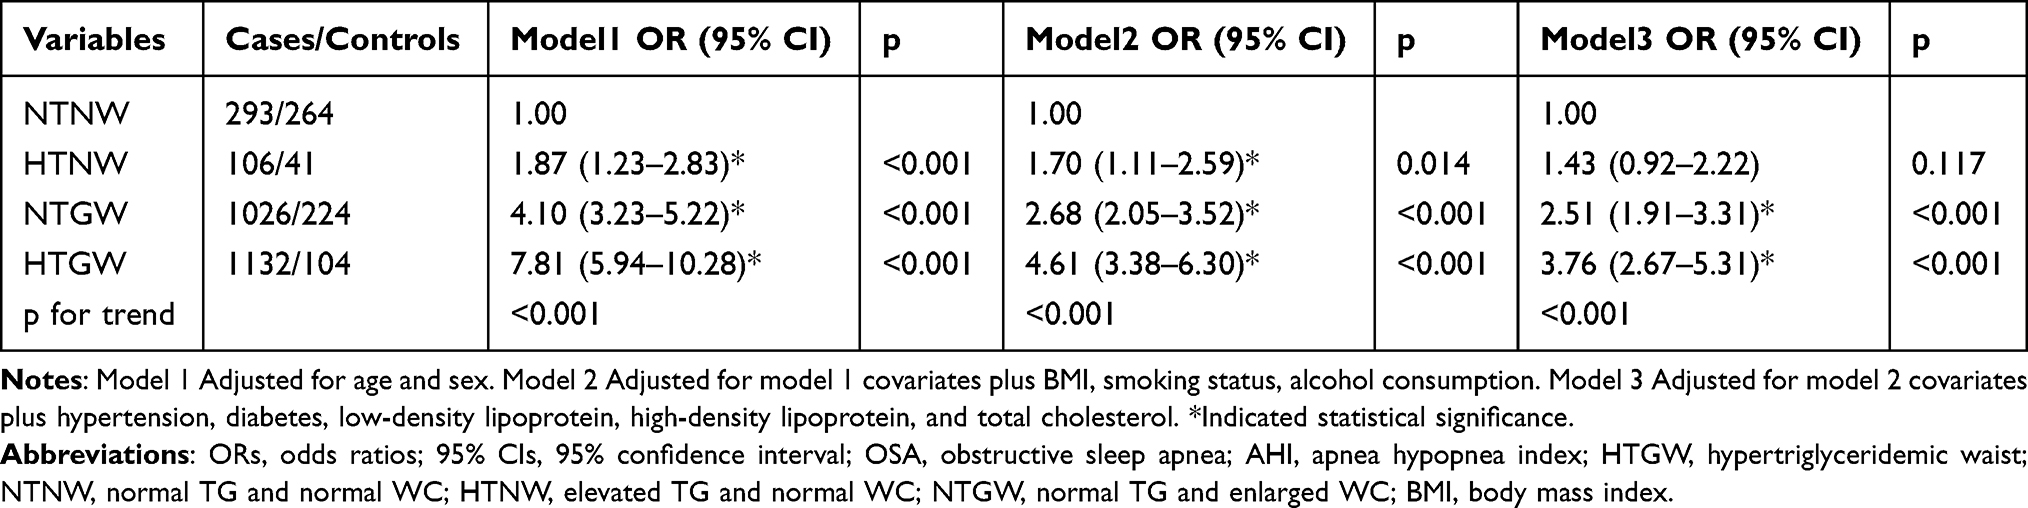 |
Table 2 Adjusted ORs and 95% CIs for OSA (AHI>5 Events/h) Risk According to HTGW Phenotypes |
We performed subgroup analyses of the associations between TG waist phenotypes and OSA by age (< or ≥ 60 years), sex (male or female), and BMI (< or ≥ 24 kg/m2). The associations of HTNW, NTGW, and HTGW phenotypes with OSA risk were significant across all subgroups after adjustments (Table 3).
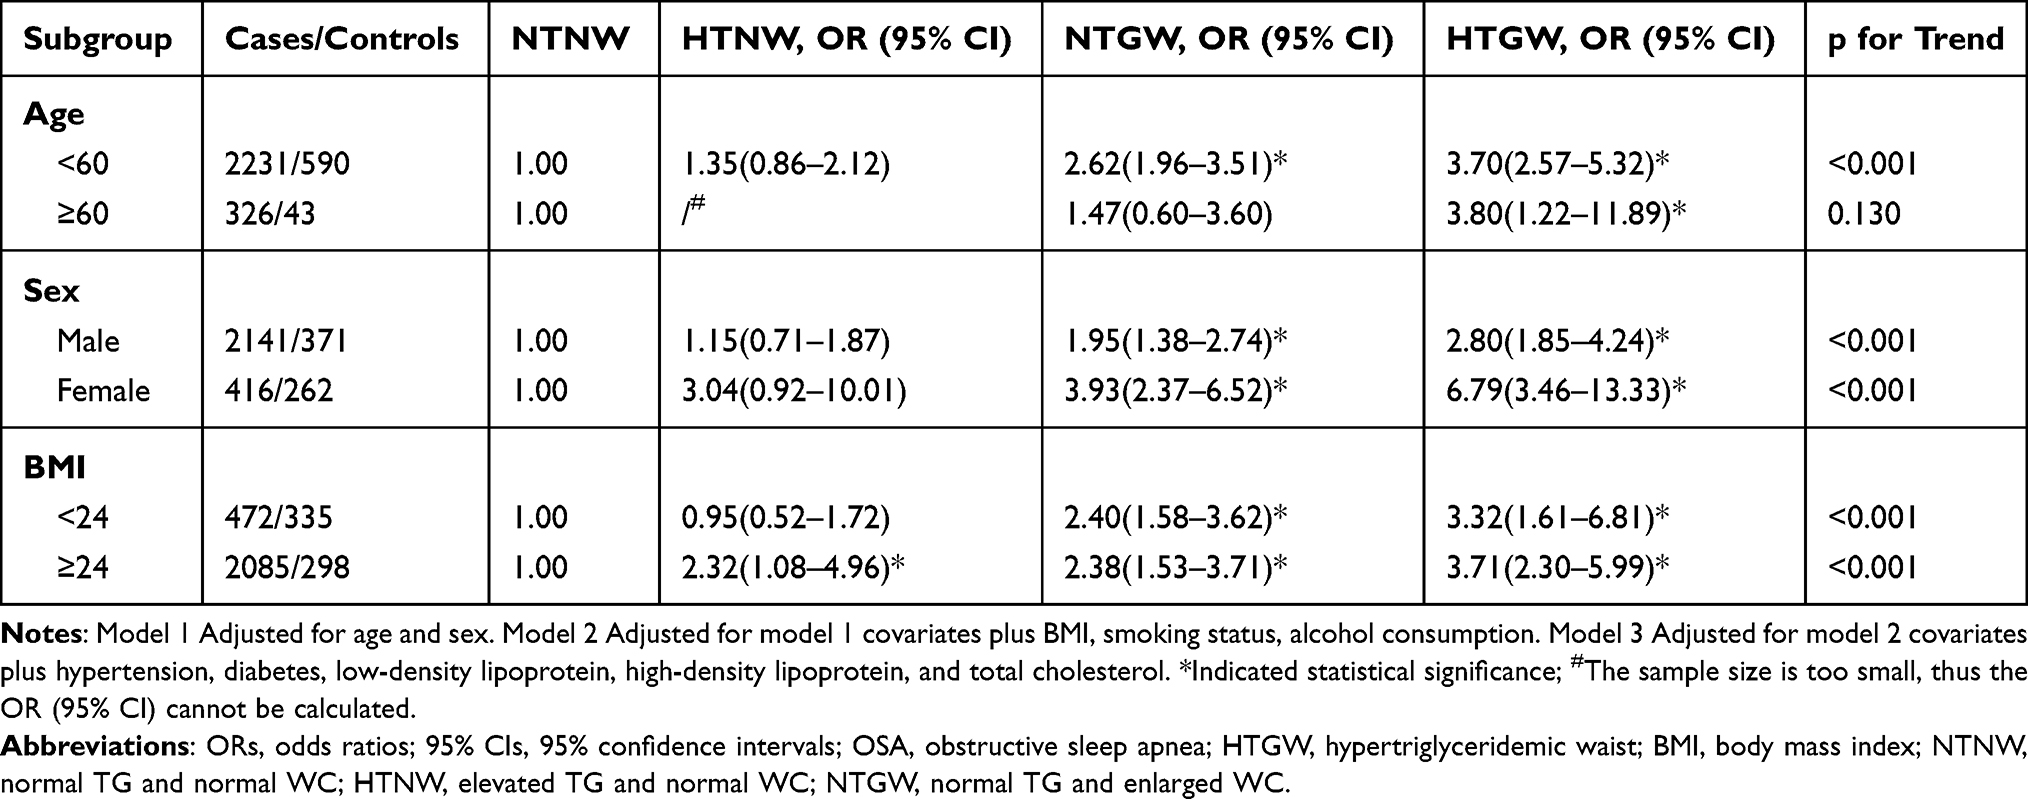 |
Table 3 Adjusted ORs and 95% CIs for OSA (AHI>5 Events/h) Risk According to HTGW Phenotypes Categorised by Age, Sex and BMI |
Multinomial logistic regression for mild, moderate, and severe OSA patients are presented in Table 4 according to TG waist phenotypes. Compared to the NTNW phenotype, the HTGW phenotype was positively associated with OSA risk across all severity groups, especially in severe OSA subjects (OR = 1.63, 95% CI = 1.07–2.50; OR = 1.88, 95% CI = 1.22–2.88; OR = 3.18, 95% CI = 2.14–4.73, respectively).
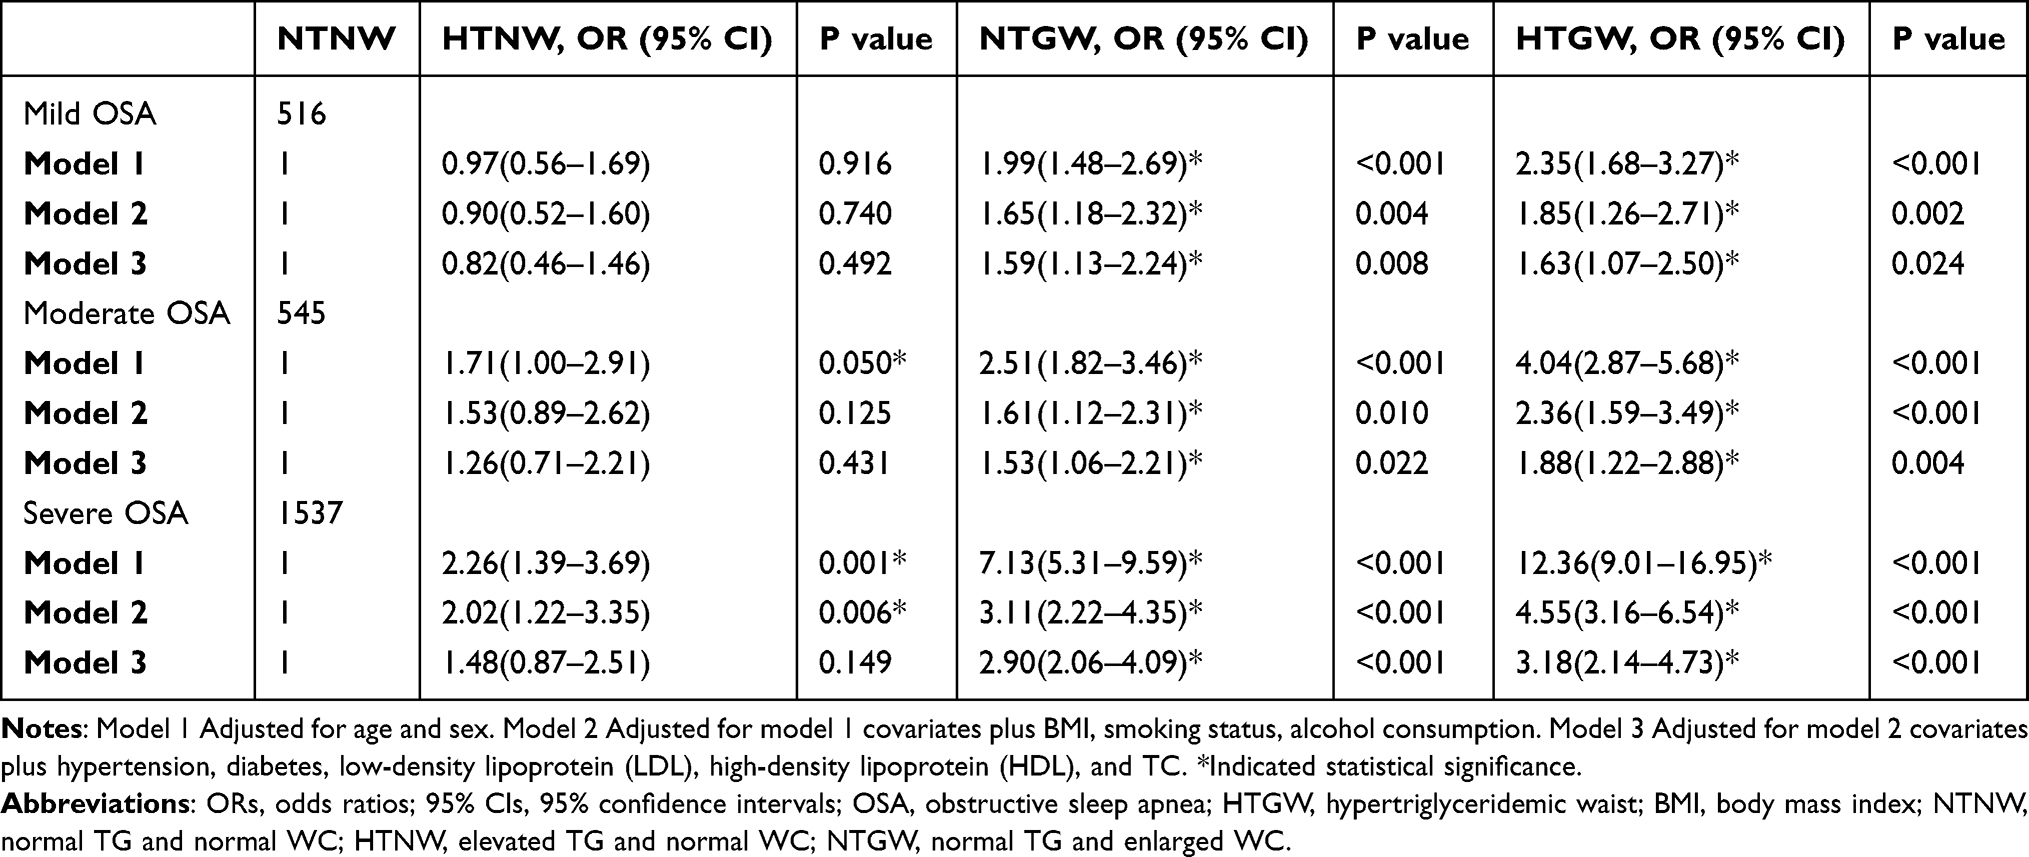 |
Table 4 Odds Ratios for Different Severity of OSA (AHI>5 Events/h) Risk According to TG Waist Phenotypes by Multinomial Logistic Regression |
Discussion
To the best of our knowledge, no previous study has explored the association between HTGW phenotype and OSA. In this study, we observed that the HTGW phenotype was significantly associated with an increased OSA risk in all patients, as well as in patient subgroups. These findings remained significant after full model adjustment.
During sleep, OSA patients experience nocturnal IH and sleep fragmentation. IH is independently associated with dyslipidemia,28 and sleep fragmentation with raised TC levels.29 Several mechanisms may underlie the associations of IH and sleep fragmentation with lipid disorders, especially elevated TG levels, such as IH and activation of the hypothalamic-pituitary-adrenal axis, leading to elevated adrenocorticotropic hormone and cortisol levels, and ultimately lipolysis.30 IH and sleep fragmentation cause systemic inflammation, resulting in abnormal lipid homeostasis.31 In addition to dyslipidemia, OSA is also accompanied by increased WC. Previous studies reported that abdominal obesity is more strongly correlated with OSA than general obesity.32 In the elderly population, visceral adiposity is strongly associated with OSA, independent of general obesity.33 Therefore, the current evidence supports the associations of OSA with elevated TG levels and increased WC. And abdominal obesity or visceral fat is considered as a predominant driving factor of the MS.27 It has been proposed that visceral fat and systemic free fatty acid concentrations are found to affect muscle, pancreatic β cells, and vascular functions at molecular level portending greater risk for diabetes and cardiovascular disease.34 OSA could promote the development of central obesity directly or indirectly.35,36 The increased obesity would in turn result in progressive deterioration of sleep apnea, and thus sleep apnea and metabolic disturbances may run into a vicious cycle.37 Through HTGW phenotype, we may discriminate OSA risk in subjects with low BMI (<24 kg/m2). Despite the healthy weight, the subjects with HTGW are at high risk of OSA and MS.
In this study, despite controlling for multiple potential confounders, we observed an association between HTGW and OSA. Importantly, this association remained significant in the subgroup analyses as well as multinomial logistic regression subgroup analysis. Clear correlations between the PSG indicators and metabolomic profiles were demonstrated by Spearman correlation. Women with the HTGW phenotype were more likely to have OSA compared to men with the NTNW phenotype, suggesting that sex differences modulate this association. Previous studies also reported gender differences in the association between HTGW phenotype and diabetes.17
The strengths of this study included its relatively large sample size (n = 3190), adequate adjustment for potential confounders (such as smoking and alcohol use), and use of standard PSG to diagnose OSA. However, several potential limitations of our study should be considered. First, this was a cross-sectional study; therefore, conclusions cannot be drawn regarding causality. Second, participants were recruited from East China, and all participants were Han Chinese, which limits the generalizability of the results to other populations. Third, we attempted to control for most potential confounders. However, some residual confounding factors, such as diet, lifestyle, and genetic factors, were not controlled. Finally, this is a high selected population and the proportion of individuals with OSA was very high; therefore, this is a high selected population and the proportion of individuals with OSA was very high; therefore, the results are not extrapolable to a general population.
In summary, both the NTGW and HTGW phenotype were associated with an increased risk of OSA in the overall population, as well as with the OSA severity groups and all subgroups. These results suggest that both the NTGW and HTGW phenotype increased the risk of OSA. These findings highlight the importance of preventing and controlling the NTGW and HTGW phenotype. Prevention of the NTGW and HTGW phenotype may the reduce risk, and slow the progression, of OSA.
Abbreviations
OSA, obstructive sleep apnea; IH, intermittent hypoxia; MS, metabolic syndrome; TG, triglycerides; TC, total cholesterol; LDL, low-density lipoprotein; HDL, high-density lipoprotein; WC, waist circumferences; HTGW, hypertriglyceridemic waist; SBP, systolic blood pressure; DBP, diastolic blood pressure; PSG, polysomnography; BMI, body mass index; NTNW, normal TG with normal WC; NTGW, normal TG with enlarged WC; HTNW, elevated TG with normal WC; AHI, apnea hypopnea index; ODI, oxygen desaturation index; SaO2, oxygen saturation; LSaO2, lowest oxygen saturation; ArI, micro-arousal index; ORs, odds ratios; Cis, confidence intervals; SSHS, Shanghai Sleep Health Study.
Data Sharing Statement
The datasets used and analyzed in this study are available from Ting Chen, the corresponding author, on reasonable request.
Ethics Approval and Consent to Participate
This study was performed in accordance with the Declaration of Helsinki. The study protocol was approved by the Ethics Committee of Shanghai Jiao Tong University Affiliated Sixth People’s Hospital (Approval No: 2019-KY-050[K]) and was registered at the Chinese Clinical Trial Registry (No. ChiCTR1900025714). We obtained informed consent from all subjects.
Acknowledgment
We are grateful to the Shanghai Sleep Health Study (SSHS) from Shanghai Jiao Tong University Affiliated Sixth People’s Hospital for providing the database.
Author Contributions
The corresponding authors are responsible for the authenticity of the data. All authors made a significant contribution to the work reported, whether that is in the conception, study design, execution, acquisition of data, analysis and interpretation, or in all these areas; took part in drafting, revising or critically reviewing the article; gave final approval of the version to be published; have agreed on the journal to which the article has been submitted; and agree to be accountable for all aspects of the work.
Funding
This study was supported by grants-in-aid from National Natural Science Foundation of China (82071029) and Shanghai Municipal Commission of Science and Technology (Grant No.18DZ2260200).
Disclosure
The authors declare that there is no conflict of interest in the study.
References
1. Heinzer R, Vat S, Marques-Vidal P, et al. Prevalence of sleep-disordered breathing in the general population: the HypnoLaus study. Lancet Respir Med. 2015;3(4):310–318. doi:10.1016/S2213-2600(15)00043-0
2. Benjafield AV, Ayas NT, Eastwood PR, et al. Estimation of the global prevalence and burden of obstructive sleep apnoea: a literature-based analysis. Lancet Respir Med. 2019;7(8):687–698. doi:10.1016/S2213-2600(19)30198-5
3. Drager LF, Togeiro SM, Polotsky VY, Lorenzi-Filho G. Obstructive sleep apnea: a cardiometabolic risk in obesity and the metabolic syndrome. J Am Coll Cardiol. 2013;62(7):569–576. doi:10.1016/j.jacc.2013.05.045
4. Bakker JP, Montesi SB, Malhotra A. Obstructive sleep apnoea: new associations and approaches. Lancet Respir Med. 2013;1(1):e15–16. doi:10.1016/S2213-2600(12)70059-0
5. Aurora RN, Punjabi NM. Obstructive sleep apnoea and type 2 diabetes mellitus: a bidirectional association. Lancet Respir Med. 2013;1(4):329–338. doi:10.1016/S2213-2600(13)70039-0
6. Sanchez-de-la-torre M, Campos-Rodriguez F, Barbe F. Obstructive sleep apnoea and cardiovascular disease. Lancet Respir Med. 2013;1(1):61–72. doi:10.1016/S2213-2600(12)70051-6
7. Wang F, Xiong X, Xu H, et al. The association between obstructive sleep apnea syndrome and metabolic syndrome: a confirmatory factor analysis. Sleep Breath. 2019;23(3):1011–1019. doi:10.1007/s11325-019-01804-8
8. Lam JC, Mak JC, Ip MS. Obesity, obstructive sleep apnoea and metabolic syndrome. Respirology. 2012;17(2):223–236. doi:10.1111/j.1440-1843.2011.02081.x
9. Wei R, Gao Z, Xu H, et al. Body Fat indices as effective predictors of insulin resistance in obstructive sleep apnea: evidence from a cross-sectional and longitudinal study: BFI as predictors of IR in OSA. Obes Surg. 2021;31(5):2219–2230. doi:10.1007/s11695-021-05261-9
10. Zou J, Wang Y, Xu H, et al. The use of visceral adiposity variables in the prediction of obstructive sleep apnea: evidence from a large cross-sectional study. Sleep Breath. 2020;24(4):1373–1382. doi:10.1007/s11325-019-01980-7
11. Xu H, Zhao X, Shi Y, et al. Development and validation of a simple-to-use clinical nomogram for predicting obstructive sleep apnea. BMC Pulm Med. 2019;19(1):18. doi:10.1186/s12890-019-0782-1
12. Xu H, Guan J, Yi H, et al.; Shanghai Sleep Health Study Research G. Elevated low-density lipoprotein cholesterol is independently associated with obstructive sleep apnea: evidence from a large-scale cross-sectional study. Sleep Breath. 2016;20(2):627–634. doi:10.1007/s11325-015-1262-3
13. Gündüz C, Basoglu OK, Hedner J, et al. Obstructive sleep apnoea independently predicts lipid levels: data from the European sleep apnea database. Respirology. 2018;23(12):1180–1189. doi:10.1111/resp.13372
14. Lin QC, Zhang XB, Chen GP, Huang DY, Din HB, Tang AZ. Obstructive sleep apnea syndrome is associated with some components of metabolic syndrome in nonobese adults. Sleep Breath. 2012;16(2):571–578. doi:10.1007/s11325-011-0544-7
15. Akahoshi T, Uematsu A, Akashiba T, et al. Obstructive sleep apnoea is associated with risk factors comprising the metabolic syndrome. Respirology. 2010;15(7):1122–1126. doi:10.1111/j.1440-1843.2010.01818.x
16. Jia XJ, Wang JX, Bai LW, Hua TS, Han ZH, Lu Q. The relationship between hypertriglyceridemic waist circumference phenotype and gestational diabetes mellitus. Gynecol Endocrinol. 2021;37(4):328–331. doi:10.1080/09513590.2021.1875428
17. Ren Y, Zhang M, Zhao J, et al. Association of the hypertriglyceridemic waist phenotype and type 2 diabetes mellitus among adults in China. J Diabetes Investig. 2016;7(5):689–694. doi:10.1111/jdi.12489
18. Janghorbani M, Salamat MR, Aminorroaya A, Amini M. Utility of the visceral adiposity index and hypertriglyceridemic waist phenotype for predicting incident hypertension. Endocrinol Metab. 2017;32(2):221–229. doi:10.3803/EnM.2017.32.2.221
19. Su W, Wang J, Mu Y. Association between hypertriglyceridemic waist phenotype and increased urinary albumin-creatinine ratio in Chinese adults: the REACTION study. Diabetes Metab Syndr Obes. 2020;13:2965–2974. doi:10.2147/DMSO.S257736
20. Liu PJ, Lou HP, Zhu YN. Identification of hepatic steatosis in premenopausal and postmenopausal women based on phenotypes combining triglyceride levels and anthropometric indices: a cross-sectional study. Diabetes Metab Syndr Obes. 2021;14:1339–1347. doi:10.2147/DMSO.S302297
21. Wang A, Li Z, Zhou Y, et al. Hypertriglyceridemic waist phenotype and risk of cardiovascular diseases in China: results from the Kailuan Study. Int J Cardiol. 2014;174(1):106–109. doi:10.1016/j.ijcard.2014.03.177
22. Chaput JP, McNeil J, Despres JP, Bouchard C, Tremblay A. Short sleep duration as a risk factor for the development of the metabolic syndrome in adults. Prev Med. 2013;57(6):872–877. doi:10.1016/j.ypmed.2013.09.022
23. Guan J, Yi H, Zou J, et al.; Shanghai Sleep Health Study Research G. Distinct severity stages of obstructive sleep apnoea are correlated with unique dyslipidaemia: large-scale observational study. Thorax. 2016;71(4):347–355. doi:10.1136/thoraxjnl-2015-207403
24. Ho V, Crainiceanu CM, Punjabi NM, Redline S, Gottlieb DJ. Calibration model for apnea-hypopnea indices: impact of alternative criteria for hypopneas. Sleep. 2015;38(12):1887–1892.
25. Chobanian AV, Bakris GL, Black HR, et al.; Joint National Committee on Prevention DE, Treatment of High Blood Pressure. National Heart L, Blood I, National High Blood Pressure Education Program Coordinating C. Seventh report of the joint national committee on prevention, detection, evaluation, and treatment of high blood pressure. Hypertension. 2003;42(6):1206–1252. doi:10.1161/01.HYP.0000107251.49515.c2
26. American Diabetes A. Executive summary: standards of medical care in diabetes–2014. Diabetes Care. 2014;37(Suppl Supplement_1):S5–13. doi:10.2337/dc14-S005
27. Grundy SM, Cleeman JI, Daniels SR, et al. Diagnosis and management of the metabolic syndrome: an American Heart Association/National Heart, Lung, and Blood Institute Scientific Statement. Circulation. 2005;112(17):2735–2752. doi:10.1161/CIRCULATIONAHA.105.169404
28. Trzepizur W, Le Vaillant M, Meslier N, et al.; Institut de Recherche en Sante Respiratoire des Pays de la Loire Sleep Cohort G. Independent association between nocturnal intermittent hypoxemia and metabolic dyslipidemia. Chest. 2013;143(6):1584–1589. doi:10.1378/chest.12-1652
29. Ekstedt M, Akerstedt T, Soderstrom M. Microarousals during sleep are associated with increased levels of lipids, cortisol, and blood pressure. Psychosom Med. 2004;66(6):925–931. doi:10.1097/01.psy.0000145821.25453.f7
30. Adedayo AM, Olafiranye O, Smith D, et al. Obstructive sleep apnea and dyslipidemia: evidence and underlying mechanism. Sleep Breath. 2014;18(1):13–18. doi:10.1007/s11325-012-0760-9
31. Barros D, Garcia-Rio F. Obstructive sleep apnea and dyslipidemia: from animal models to clinical evidence. Sleep. 2019;42;zsy236.
32. Zhao X, Xu H, Qian Y, et al. Abdominal obesity is more strongly correlated with obstructive sleep apnea than general obesity in china: results from two separated observational and longitudinal studies. Obes Surg. 2019;29(8):2535–2547. doi:10.1007/s11695-019-03870-z
33. Zhang Z, Wang Y, Li H, Ni L, Liu X. Age-specific markers of adiposity in patients with obstructive sleep apnea. Sleep Med. 2021;83:196–203. doi:10.1016/j.sleep.2021.02.051
34. Jensen MD. Is visceral fat involved in the pathogenesis of the metabolic syndrome? Human model. Obesity. 2006;14 Suppl 1(2S):20s–24s. doi:10.1038/oby.2006.278
35. Tasali E, Van Cauter E. Sleep-disordered breathing and the current epidemic of obesity: consequence or contributing factor? Am J Respir Crit Care Med. 2002;165(5):562–563. doi:10.1164/ajrccm.165.5.2201001b
36. Vgontzas AN. Does obesity play a major role in the pathogenesis of sleep apnoea and its associated manifestations via inflammation, visceral adiposity, and insulin resistance? Arch Physiol Biochem. 2008;114(4):211–223. doi:10.1080/13813450802364627
37. Vgontzas AN, Bixler EO, Chrousos GP. Sleep apnea is a manifestation of the metabolic syndrome. Sleep Med Rev. 2005;9:211–224.
 © 2021 The Author(s). This work is published and licensed by Dove Medical Press Limited. The full terms of this license are available at https://www.dovepress.com/terms.php and incorporate the Creative Commons Attribution - Non Commercial (unported, v3.0) License.
By accessing the work you hereby accept the Terms. Non-commercial uses of the work are permitted without any further permission from Dove Medical Press Limited, provided the work is properly attributed. For permission for commercial use of this work, please see paragraphs 4.2 and 5 of our Terms.
© 2021 The Author(s). This work is published and licensed by Dove Medical Press Limited. The full terms of this license are available at https://www.dovepress.com/terms.php and incorporate the Creative Commons Attribution - Non Commercial (unported, v3.0) License.
By accessing the work you hereby accept the Terms. Non-commercial uses of the work are permitted without any further permission from Dove Medical Press Limited, provided the work is properly attributed. For permission for commercial use of this work, please see paragraphs 4.2 and 5 of our Terms.