")
Back to Journals » Diabetes, Metabolic Syndrome and Obesity » Volume 16
Association of HOMA-IR with Ovarian Sensitivity Index in Women Undergoing IVF/ICSI: A Retrospective Cohort Study
Authors Li Y, Jiang Y, Zhang S, Liu H, Zhang C
Received 25 November 2022
Accepted for publication 24 January 2023
Published 2 February 2023 Volume 2023:16 Pages 309—320
DOI https://doi.org/10.2147/DMSO.S399105
Checked for plagiarism Yes
Review by Single anonymous peer review
Peer reviewer comments 2
Editor who approved publication: Professor Gian Paolo Fadini
Yan Li,1,* Yilin Jiang,1,* Shaodi Zhang,1 Hai Liu,2 Cuilian Zhang1
1Reproductive Medicine Center, People’s Hospital of Zhengzhou University, Henan Provincial People’s Hospital, Zhengzhou, Henan, 450003, People’s Republic of China; 2Department of Gynaecology and Obstetrics, Xinjiang Production and Construction Corps 13 Division Red Star Hospital, Hami, Xinjiang, 839000, People’s Republic of China
*These authors contributed equally to this work
Correspondence: Cuilian Zhang, Reproductive Medicine Center, People’s Hospital of Zhengzhou University, Henan Provincial People’s Hospital, 7 Weiwu Road, Zhengzhou, People’s Republic of China, Tel +86 371 65580852, Email [email protected]
Background: Insulin resistance (IR) may adversely impact the in vitro fertilization (IVF) or intracytoplasmic sperm injection (ICSI) outcomes. However, the association of IR with ovarian sensitivity during controlled ovarian hyperstimulation (COH) remains controversial.
Purpose: We aimed to explore the association between homeostasis model assessment of insulin resistance (HOMA-IR) and ovarian sensitivity index (OSI).
Patients and Methods: In this retrospective cohort study, 7836 patients aged between 20 and 39 years with good ovarian reserve were included consecutively between June 2018 and May 2022. HOMA-IR was calculated to evaluate the degree of IR and OSI was used to measure ovarian sensitivity. Owing to skewed distribution, HOMA-IR and OSI were log e transformed to Ln HOMA-IR and Ln OSI. Smoothing splines were generated by generalized additive models to explore the correlation between Ln HOMA-IR and Ln OSI. Then, the relationship between Ln HOMA-IR and Ln OSI was tested with multivariable linear regression model after adjustments for the potential confounders.
Results: We observed negative association between Ln HOMA-IR and Ln OSI after adjustment for potential confounders by using smoothing spline fitting curves in generalized additive model. In the multivariable linear regression model, after full adjustments, each one unit increase in Ln HOMA-IR was related to reduced Ln OSI values (β = − 0.12, 95% CI, − 0.15, − 0.09). As sensitivity analysis, those who had HOMA-IR of quartile 3 (HOMA-IR 2.33– 3.43) and quartile 4 (HOMA-IR ≥ 3.43) had decreases in Ln OSI values (β = − 0.07, 95% CI − 0.11, − 0.03 and β = − 0.18, 95% CI − 0.22, − 0.13, respectively) when compared with patients in the quartile 1 (HOMA-IR < 1.63). Furthermore, stratified and interaction analysis showed a strong inverse association of Ln HOMA-IR with Ln OSI in subgroups of PCOS patients and overweight/obese populations (P-value for interaction < 0.0001).
Conclusion: HOMA-IR value was negatively associated with the ovarian sensitivity assessed by OSI. Among the PCOS and overweight/obese populations, this inverse relationship may be strong. These findings will increase the understanding of the contribution of IR to the development of decreased ovarian sensitivity within the assisted reproductive technology (ART) setting. It may have implications for optimizing gonadotropin dose manipulation in patients with IR undergoing IVF/ICSI.
Keywords: insulin resistance, HOMA-IR, ovarian sensitivity, OSI, in vitro fertilization
Introduction
Insulin resistance (IR) refers to an impairment in insulin-mediated control of glucose homeostasis, which is characterized by hyperinsulinemia and defective response of target cells or a whole organism to the insulin exposure.1,2 IR is associated with metabolic syndrome, cardiovascular disease, and typically type 2 diabetes.3–6 Sub-fertile women with polycystic ovary syndrome (PCOS) had higher levels of fasting insulin, and the resultant hyperinsulinemia plays a role in the pathogenesis of reproductive disorders.7–9 IR is also encountered in various conditions, such as obesity and sedentary lifestyle, which frequently exist in infertile women, suggesting a pathogenic role of IR even in non-PCOS patients.10–12 Moreover, IR may adversely impact the in vitro fertilization (IVF) or intracytoplasmic sperm injection (ICSI) outcomes.13
In the setting of IVF and ICSI, the homeostasis model assessment of IR (HOMA-IR) has been widely used as an important surrogate measure of IR. Direct, dynamic methods for measuring IR are accurate but inconvenient for clinical practice in large populations.14 Currently, HOMA-IR is suggested to be associated with IVF/ICSI outcomes in infertile patients undergoing IVF/ICSI cycles.15 It is reported that, in non PCOS and PCOS women, clinical pregnancy rate in IVF/ICSI was decreased as the HOMA-IR increased.16
Ovarian response is one of the cornerstones of IVF success.17 In the literature, poor ovarian responses (POR) are reported in 9−24% of all IVF cycles.18 The ovarian response to controlled ovarian hyperstimulation (COH) during IVF is often difficult to predict and dependent on multiple factors such as age, body mass index (BMI), ovarian reserve and endocrinopathy.19–22 Ovarian sensitivity to gonadotropin (Gn) may play a determinant role on ovarian response and appears as a key element to improve IVF success.23 Ovarian sensitivity index (OSI) has been suggested as an evaluation of ovarian sensitivity in IVF procedure, which could reflect the potential of follicles to produce oocytes in response to exogenous Gn stimulation.24,25 The OSI improves the definition of ovarian response patterns. For instance, among young women, OSI showed a log-normal distribution with levels for poor and high response at 1.697 and 10.07, respectively.25 Among older women, an OSI higher than 0.83 was associated with greater odds of pregnancy.26 In general population, the OSI of more than 1.59 was associated with a significantly higher clinical pregnancy rate.27
The relationship of IR with ovarian sensitivity is still controversial. In non-PCOS women, it is suggested that the higher level of IR and androgen can positively affect short-term follicle development and benefit responses to exogenous Gn stimulation.28 In contrast, some researchers showed that, in non-PCOS women, IR is associated with the decreased percentage of mature eggs and poor embryo quality.29 In PCOS women, it was demonstrated that basal insulin level does not correlate with ovarian response to Gn administration.30 On the contrary, a previous study showed PCOS women with IR required more Gn and a longer time to achieve follicular maturation.31
To sum up, the available studies failed to draw firm conclusions in the relationship between IR and ovarian sensitivity in infertile individuals undergoing IVF/ICSI cycles. Indeed, the validation of association between IR and ovarian sensitivity is not a minor issue. Early identification of patients with decreased ovarian sensitivity may be of importance in an attempt to prevent the future development of POR during COH. Therefore, the present study was undertaken to investigate the relationship between HOMA-IR and OSI in a relatively large cohort of young population with or without PCOS in different BMI categories. We hypothesized that IR is negatively associated with ovarian sensitivity in infertile women undergoing IVF/ICSI. Findings from the present study may provide deeper insights to elucidate the link between IR and ovarian sensitivity.
Materials and Methods
Patients
This study was a retrospective cohort analysis. All individuals who received their first complete oocyte pickup cycles between June 2018 and May 2022 were consecutively included in the analysis at reproductive medical center of Henan Provincial People’s Hospital, China. We included individuals aged between 20 and 39 years with body mass index (BMI) of ≥18.5 kg/m2 who underwent a standard Gonadotropin releasing hormone (GnRH) agonist or GnRH antagonist protocols in the first IVF/ICSI treatment cycle with complete data on ovarian reserve and insulin resistance, including anti-mullerian hormone (AMH), antral follicle count (AFC), fasting plasma glucose (FPG), fasting serum insulin (FINS).
The exclusion criteria were as follows: women with poor ovarian reserve (AMH < 1.2 ng/mL or AFC < 5), diabetes mellitus, hyperprolactinemia, untreated thyroid dysfunction, congenital adrenal hyperplasia, or had a history of ovariectomy and hypoglycemic medications within three months before undergoing the assisted reproductive technology (ART); other severe systemic diseases, such as prethrombotic conditions, autoimmune diseases and malignant tumor. Moreover, cycle canceling, oocyte freezing, cycles of oocyte donation and preimplantation genetic testing (PGT) were also excluded.
The primary objective was to study the association between HOMA-IR and OSI in general populations. The secondary objective was to analyze the relationship between HOMA-IR and OSI in stratification analysis. This study was approved by the Ethics Committee of the Henan Provincial People’s Hospital (No. 2022139). The need for individual consent was waived by the committee due to the retrospective character of the study. The study was conducted in accordance with the Helsinki Declaration, and patients’ records were anonymized prior to analysis.
HOMA-IR and Ovarian Sensitivity Index (OSI) Calculation
Patients’ characteristics of interest (including age, BMI, infertility type and duration, infertility factors, AFC, AMH, basal follicle stimulating hormone (FSH), FINS, FPG), and COH characteristics (protocols, initial and total dose of Gn, duration of Gn, dominant follicle count and endometrium thickness on the trigger day, retrieved oocytes, metaphase II (MII) oocytes and embryos) were retrospectively collected from medical records. HOMA-IR and OSI were assessed by formula as follows: HOMA-IR = FBG (mmol/L) × FINS (μU/mL)/22.5;32 OSI = [(Number of retrieved oocytes/Total gonadotropin dose) × 1000];25 PCOS was diagnosed according to the Rotterdam Consensus criteria (2 out of 3) as follows: 1) oligo- or anovulation; 2) clinical and/or biochemical signs of hyperandrogenism; and 3) polycystic ovaries and exclusion of other etiologies (congenital adrenal hyperplasia, androgen secreting tumors, Cushing’s syndrome).33 BMI was calculated according to the formula, weight (kg)/height (m)2.
FPG and FINS Measurement
All baseline blood sampling including FSH, total testosterone (TT), estradiol, luteinizing hormone (LH), total testosterone (T) and prolactin (PRL) were done during cycle day 2–4 of the menstrual cycle. Fasted blood samples were collected to measure biochemical markers, including insulin, glucose and thyroid-stimulating hormone (TSH). The inter-assay laboratory coefficient of variation (CV) of FPG testing was lower than 3.5%, which was detected by ADVIA2400ChemistrySystem (ADVIA 2400, SIEMENS, Germany). FINS concentration was determined by the electro-chemiluminescence immunoassay method (CV < 3.2%) on the fully automatic chemiluminescence immunoassay analyzer (Cobas 8000 e602; Roche Diagnostics GmbH, Mannheim, Germany) in the laboratory of the Department of Reproductive Endocrinology at Henan Provincial People’s Hospital. Our laboratory is checked for qualification by the External Quality Assessment of Clinical Laboratory Center annually (Ministry of Health of the People’s Republic of China, Beijing, China).
Ovarian Stimulation Protocol
The COH protocols were individualized according to women’s age and ovarian reserve with dose step-up regimen in the stimulation phase of Gn treatment. In short-acting GnRH agonist protocol, subcutaneously injected 0.1 mg triptorelin was scheduled for patients from the 6th-8th day after ovulation to the 14th-18th day after ovulation until sufficient downregulation of the pituitary was achieved. After that, exogenous Gn and 0.05 mg triptorelin were administered simultaneously until the day of human chorionic gonadotropin (HCG) triggering. In the long-acting GnRH agonist protocol, patients received a single dose of triptorelin acetate (Diphereline; 3.75mg) on day 2–4 of the menstrual cycle. If downregulation of the pituitary was satisfactory after 30–35 days, exogenous Gn was injected to initiate the cycle. In the GnRH antagonist protocol, Gn was administrated on the 2–3 days of the menstrual cycle, and GnRH antagonist (Cetrotide; 0.25 mg) was added daily from day six to seven of stimulation until the day of HCG triggering. High-quality embryos meant day 3 embryos that reached 6 to 8 cell stage with cytoplasmic fragmentation less than 10% and equal size blastomeres. Follicles of ≥16 mm diameter were defined as dominant follicles. Retrieved mature oocytes were classified into MII oocytes.
Statistical Analyses
Owing to skewed distribution, the HOMA-IR and OSI values were log e transformed to Ln HOMA-IR and Ln OSI. Continuous variables are presented as the means ± standard deviations, whereas categorical variables are expressed as frequencies and percentages. For patient demographics and clinical characteristics, the differences between the HOMA-IR quartile groups were compared using the one-way analysis of variance (normal distribution), Kruskal–Wallis test (skewed distribution) for continuous variables and Pearson’s chi-squared test, or Fisher’s exact test for the categorical variables. Multiple comparison posttest was conducted by using Bonferroni correction.
The association of Ln HOMA-IR with Ln OSI was fitted and presented as smoothing splines which was generated by generalized additive model (GAM) after adjustments for age, BMI, AFC, AMH, initial Gn dose, basal FSH, infertility type, PCOS diagnosis and COH protocol.
The Ln HOMA-IR was treated as a continuous independent variable and the association between Ln HOMA-IR and Ln OSI was estimated using multivariable linear regression models including the non-adjusted model, adjusted model I (only age, BMI, AFC, AMH and initial Gn dose were adjusted), and fully adjusted model II (age, BMI, AFC, AMH, initial Gn dose, basal FSH, infertility type, PCOS diagnosis and COH protocol were adjusted). HOMA-IR was then divided into quartiles and treated as a categorical variable, with the lowest quartile used as the reference. We performed linear trend tests by entering the median value of each HOMA-IR category as a continuous variable in the models. These results are presented as regression coefficient (β) and 95% confidence intervals (CI).
Stratified analysis was performed for examination of the association of Ln HOMA-IR with Ln OSI in the strata of PCOS, age, BMI, COH protocol. Next, we use Log likelihood ratio test to obtain a P-value for interaction for examining statistical significance of the difference in each subgroup.
Statistical analysis was undertaken by using software packages R (http://www.R-project.org, the R Foundation) and Empower (R) (www.empowerstats.com; X&Y Solutions, Inc., Boston, MA). A two-tailed P-value <0.05 was considered statistically significant.
Results
Patient Disposition
A total of 16,297 medical records of first oocyte retrieval cycles between June 2018 and May 2022 were screened and 7836 IVF/ICSI cycles were finally included in the analysis (Figure 1).
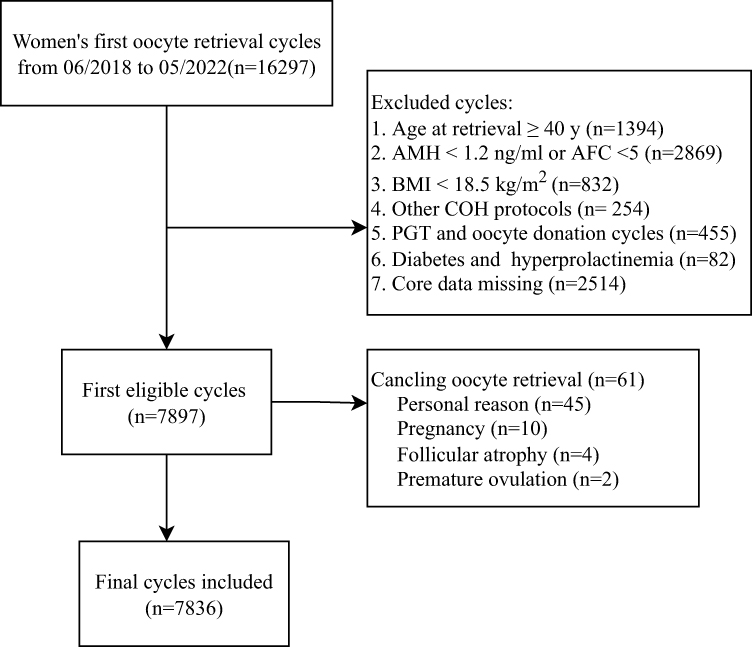 |
Figure 1 Flowchart of data collection process. Abbreviations: AMH, anti-mullerian hormone; AFC, antral follicle count; BMI, body mass index; COH, controlled ovarian hyperstimulation; PGT, preimplantation genetic testing. |
Demographic and Clinical Characteristics
Baseline characteristics of all subjects and the four groups classified by HOMA-IR quartiles are shown in Table 1. There was an increase in HOMA-IR levels across Q1 to Q4 groups, which were the lowest in Q1 group and highest in Q4 group. The Q4 and Q3 groups demonstrated lower levels for the average age, basal FSH level, number of retrieved oocytes, number of oocytes in metaphase II, number of viable embryos, number of high-quality embryos and OSI. Compared with Q1, levels of BMI, infertility duration, AMH, AFC, FINS, FPG, HOMA-IR, initial Gn dose, total Gn dose and Gn duration were significantly higher in Q4 group (Supplementary Figure S1). With regard to the infertility factors, Q4 group had the higher percentages of PCOS, followed by Q3 patients, and Q1 patients had the lowest (Supplementary Figure S2). Besides, no significant difference was detected for COH protocols, dominant follicle count and endometrium thickness on trigger day (P > 0.05).
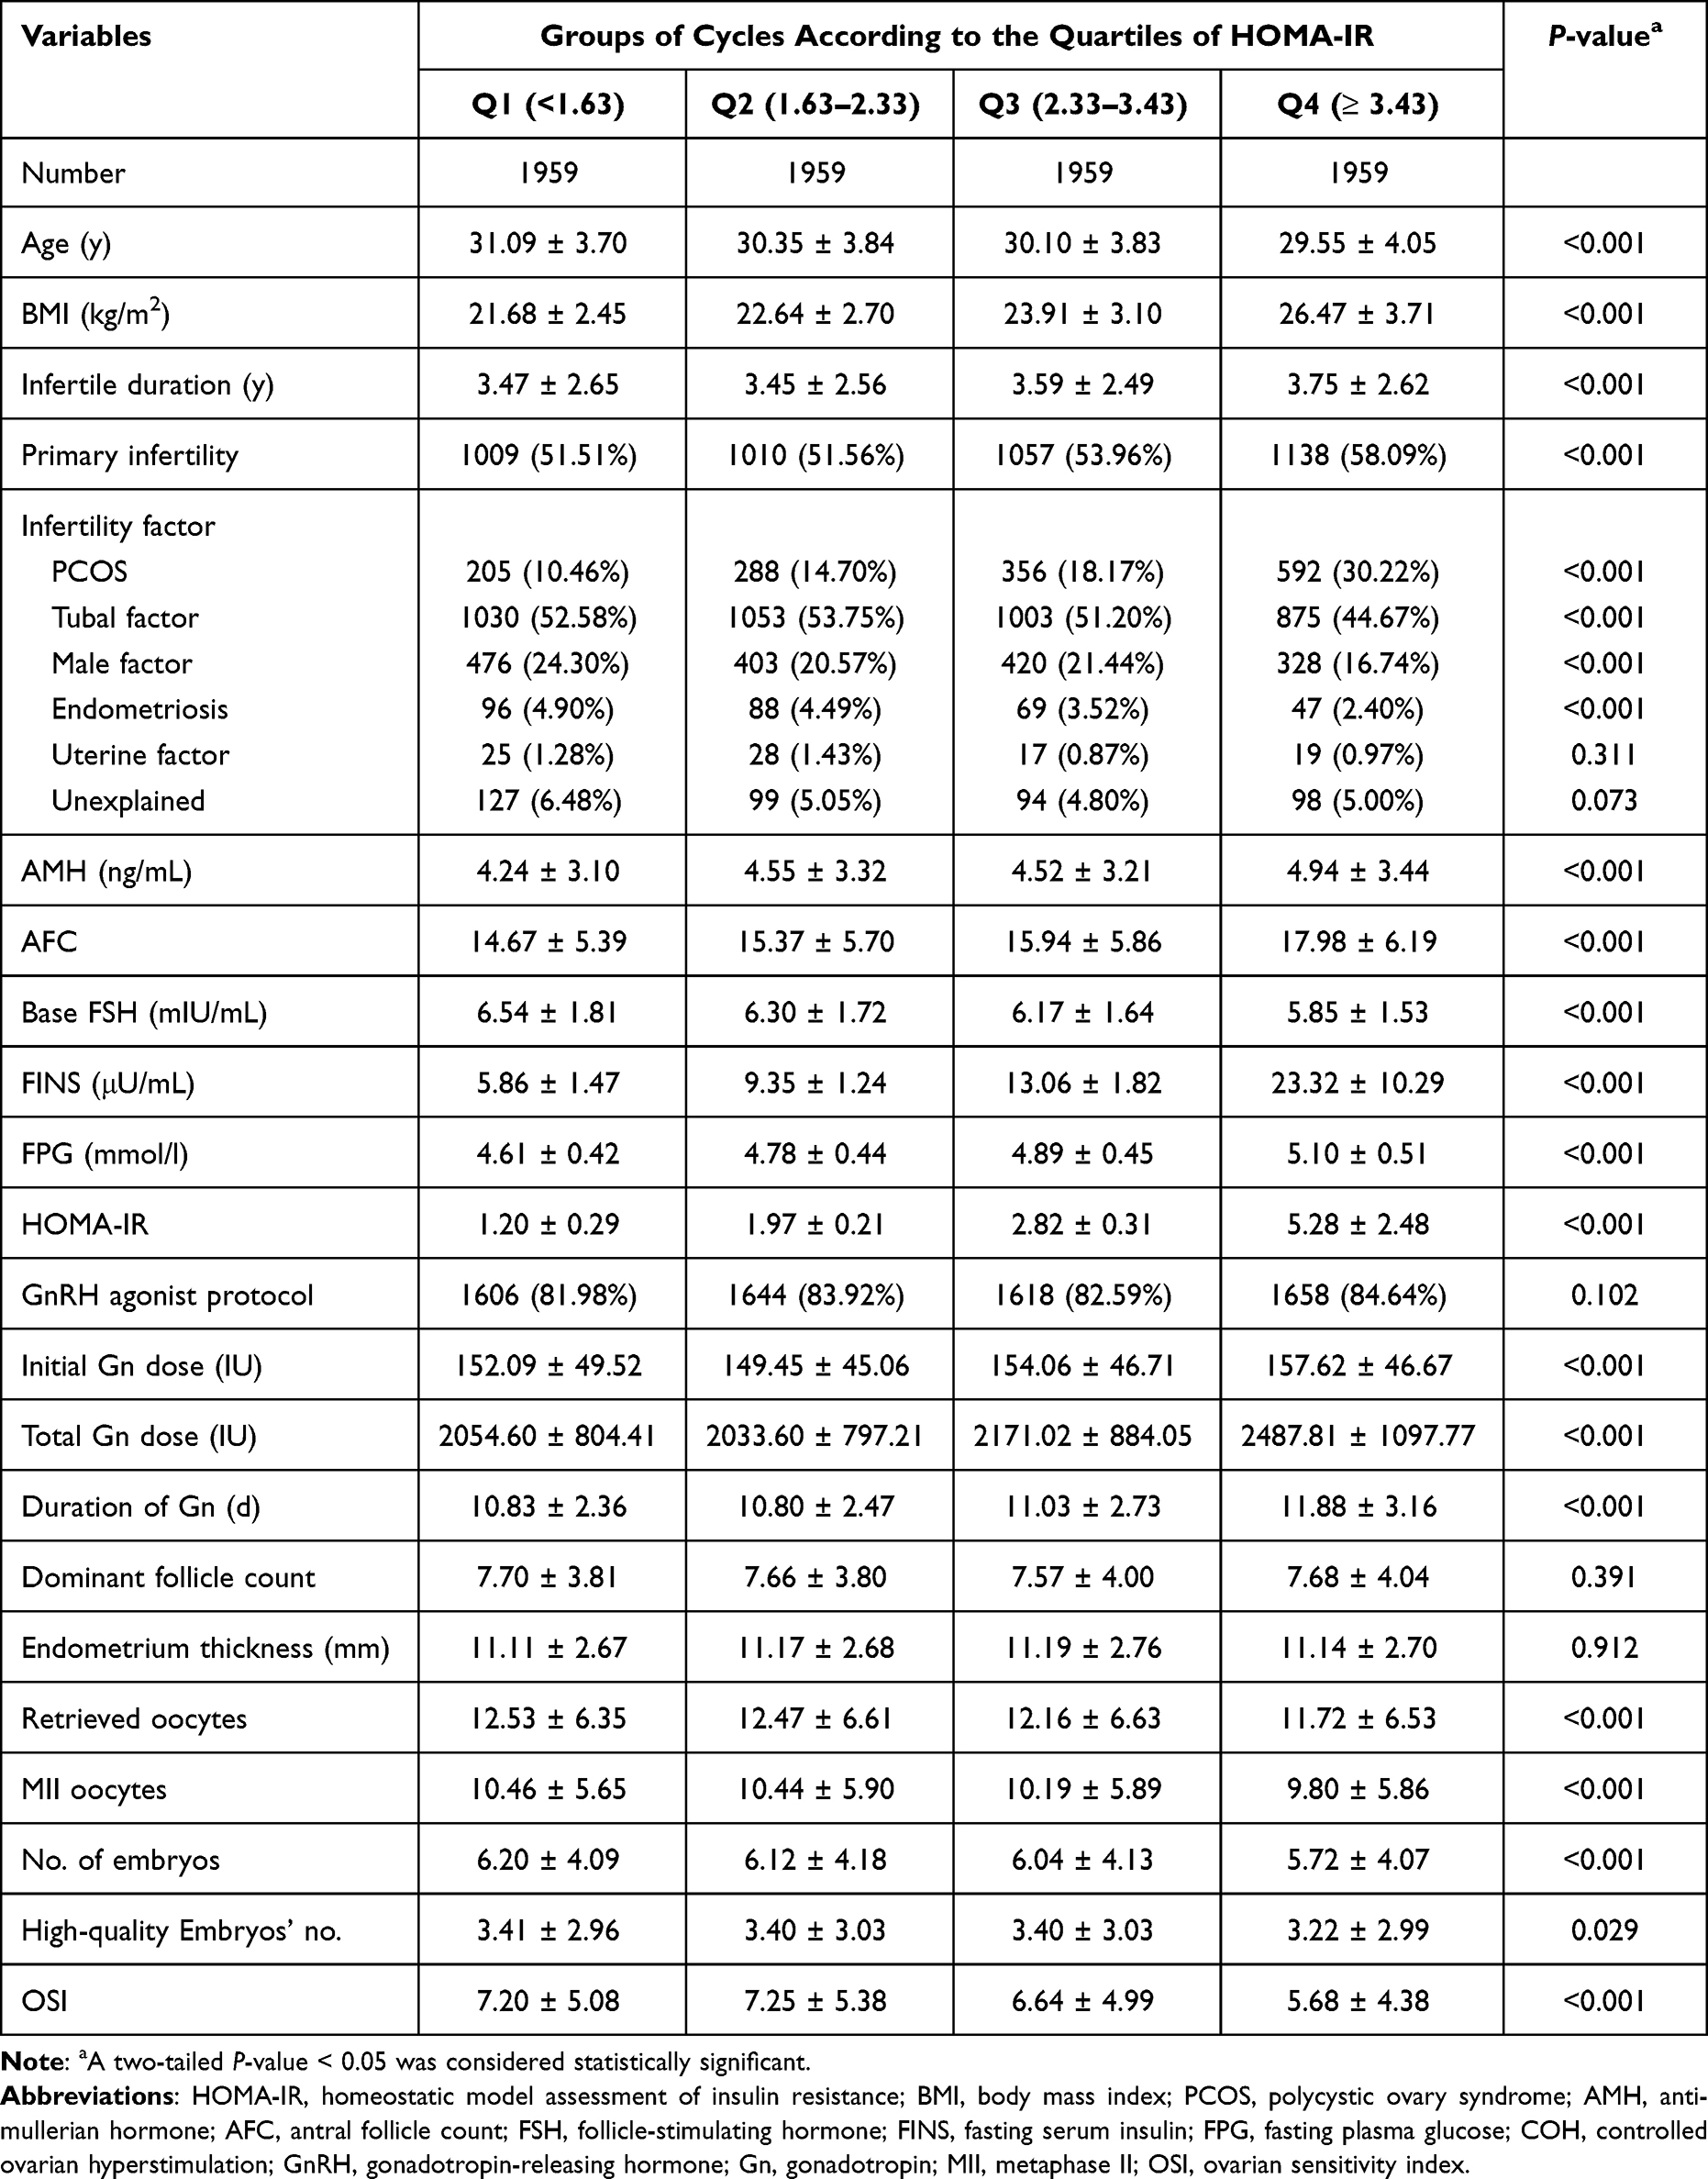 |
Table 1 The Clinical Parameters of the Study Population |
Relationships Between HOMA-IR and OSI
The data distribution of HOMA-IR and OSI was strongly skewed. Thus, we performed log e transformation (Ln HOMA-IR and Ln OSI) before analysis. First, we observed negative associations between Ln HOMA-IR and Ln OSI after adjustment for potential confounders by using smoothing spline fitting curves in generalized additive model (Figure 2). Then, a multivariable linear regression model was performed to analyze the association of Ln HOMA-IR with Ln OSI levels. In addition, we performed sensitivity analysis where HOMA-IR was divided into four groups based on quartiles.
 |
Figure 2 Association between Ln HOMA-IR and Ln OSI. All adjusted for age, BMI, AMH, AFC, initial Gn dose, basal FSH, PCOS, COH protocol, infertility type. Red line represents the smooth curve fit between variables and the blue dotted curves represents the 95% of confidence interval. |
As displayed in Table 2, univariable linear regression analysis showed that, the level of Ln HOMA-IR was negatively associated with Ln OSI level (β = −0.18, 95% CI −0.21, −0.16, P < 0.0001). The relationship remained statistically significant after adjusting for potential confounders, as shown in model I (β = −0.09, 95% CI −0.12, −0.07, P < 0.001) and model II (β = −0.12, 95% CI −0.15, −0.09, P < 0.001) by multivariable linear regression analysis. As sensitivity analysis, HOMA-IR was then divided into quartiles and treated as a categorical variable, with the lowest quartile used as the reference. When HOMA-IR was deemed as categorical variables by quartiles, a graded negative relationship was discovered across the quartile groups (P for trend <0.001). Compared with participants who had HOMA-IR in quartile 1 (HOMA-IR <1.63), those with HOMA-IR in quartile 3 (HOMA-IR 2.33–3.43) and quartile 4 (HOMA-IR ≥3.43) had lower Ln OSI (β = −0.10, 95% CI −0.15, −0.06, P < 0.0001 and β = −0.27, 95% CI −0.31, −0.22, P < 0.0001, respectively). After adjusting for the potential confounders, the Ln OSI remained significantly lower in quartile 3 and quartile 4 compared with quartile 1, as shown in model I (β = −0.04, 95% CI −0.08, −0.00, P = 0.0358 and β = −0.14, 95% CI −0.19, −0.10, P < 0.0001, respectively) and model II (β = −0.07, 95% CI −0.11, −0.03, P = 0.0007 and β = −0.18, 95% CI −0.22, −0.13, P < 0.0001, respectively).
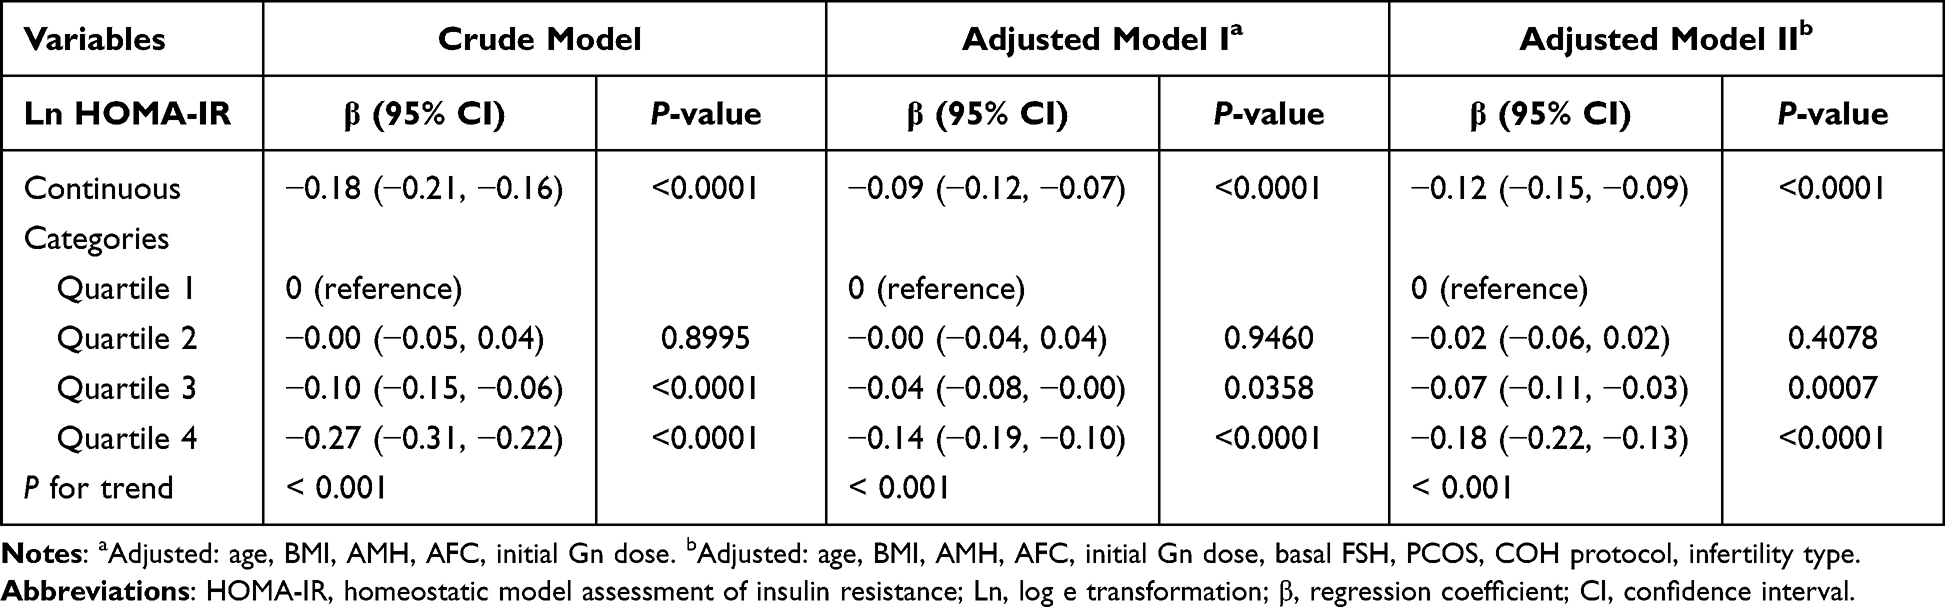 |
Table 2 Association of Ln HOMA-IR with Ln OSI |
Subgroups Analysis and Effect Modification
Subgroup analysis was performed to explore whether the other variables including PCOS status, age, BMI and COH protocol, tubal factor and male factors might influence the relationship between HOMA-IR and OSI. Factors of age and BMI were stratified according to the clinical cutoff point.34 As presented in Table 3, the negative association between Ln HOMA-IR and Ln OSI was consistent in all stratification subgroups, tested by multivariate linear regression analysis.
 |
Table 3 Subgroup Analysis of the Relationship Between Ln HOMA-IR and Ln OSI |
We further conducted interaction analysis by Log likelihood ratio test to assess whether the stratifications of PCOS, age, BMI and COH protocol would modify the relationship between Ln HOMA-IR and Ln OSI. Subsequent results showed stratification of PCOS and BMI modified the association of Ln HOMA-IR and Ln OSI (PCOS vs non-PCOS, P-value for interaction <0.0001). That is to say, among women with PCOS or overweight/obese, the adverse association of Ln HOMA-IR on Ln OSI was strong (P-value for interaction <0.0001). No other interactions were observed in subgroups of age (<35 y vs ≥35 y, P-value for interaction = 0.0798), tubal factor (with tubal factor vs without tubal factor, P-value for interaction = 0.6371), male factor (with male factor vs without male factor, P-value for interaction = 0.5504) and COH protocol (GnRH agonist protocol vs GnRH antagonist protocol, P-value for interaction = 0.1935) (Table 3).
Discussion
Early identification of individuals with decreased ovarian sensitivity in the ART attempt has always been important because it may affect clinical decision-making. Although IR is a well-established phenomenon associated with different morbidities, the relationship of IR with ovarian sensitivity has been controversial. In this study, we assessed the associations of IR evaluated by HOMA-IR with ovarian sensitivity based on OSI in women of reproductive age undergoing IVF/ICSI. Our results showed that the rise in HOMA-IR value was related to the decrease of OSI after adjusting for the potential confounders.
OSI was associated with markers of ovarian reserve currently used, such as AFC and AMH.35 It has been considered that, although both the number of oocytes retrieved and the total gonadotrophin dose are important measures of ovarian responsiveness, a ratio of them, OSI is a better representation of ovarian responsiveness rather than either parameter on its own.36 Previously, in a case–control study, Zheng et al reported that a limited number of PCOS patients with IR had lower OSI levels than that of PCOS individuals without IR undergoing ART.24 However, they found no statistical difference in OSI levels between the IR and non-IR groups in non-PCOS patients which was probably due to the small sample size. In our cohort study, the inverse relationship between HOMA-IR and OSI remained significant in all subgroups after careful adjustments, including the stratifications of age, BMI, COH protocol PCOS and other main infertility factors.
HOMA-IR is a measurement frequently used to assess insulin sensitivity and has high sensitivity and specificity for measuring insulin resistance.37 Many studies selected HOMA-IR of 2.5 as an indicator of IR based on the original study by Matthews et al.32 Similarly, our results indicated that those who had HOMA-IR of quartile 3 (HOMA-IR 2.33–3.43) and quartile 4 (HOMA-IR ≥3.43) had significant decreases in Ln OSI values. Thus, we suggested that IR may be negatively associated with ovarian sensitivity.
The pathophysiology mechanisms explaining the decreased ovarian sensitivity to Gn stimulation are not fully understood. Our findings provided evidence for the negative association of IR with the ovarian sensitivity. Physiologically, insulin may play an important role in the ovarian functional system and this may be involved in promoting the development of follicles.38 However, when IR is existed, it has been suggested that there is decreased follicle activity, increased oxidative stress and ovarian dysfunction.39,40
In addition, our study showed that the negative association between HOMA-IR and OSI was strong in PCOS patients and overweight/obese populations. IR is known to play a pivotal role in the pathogenesis of PCOS. Various studies have put estimates of IR and hyperinsulinemia at approximately 40% to 70% of women with PCOS.41–43 Several studies have reported that IR and hyperinsulinemia in women with PCOS have direct effects on oocyte maturation and ovulation.44,45 De Leo et al showed that the response of the polycystic ovary to gonadotropin stimulation is rather slow.46 Additionally, as HOMA-IR and insulin levels increase, the maximum follicle diameter decreases in the group with PCOS patients.47 Previous studies also demonstrated that overweight and obesity may impair the ovarian response to stimulation during IVF/ICSI treatment.48 Studies demonstrated obesity was associated with decreases in the number of retrieved oocytes.49–51 Reduced ovarian sensitivity to Gn in terms of weight gain of overweight and obese women was probably related to action of hyperinsulinemia, which can affect follicle growth and result in prolonged ovarian stimulation.12,52 Individuals with normal weight and insulin resistance are not uncommon.53 Our results showed that, even in subjects with normal weight, the negative association between HOMA-IR and OSI was still exist.
Therefore, we suggested that the initial or total dose of Gn could be increased appropriately when IR occurs considering for the possibility of reduced ovarian sensitivity. It helps clinicians for individualized COH management in the context of ovarian sensitivity. For instance, women with PCOS are usually given lowered dose of Gn in case of ovarian hyperstimulation syndrome (OHSS). Thus, some would become unexpected poor ovarian responders. In this regard, by taking into account the HOMA-IR levels and hence adjusting the gonadotropin dose in time, the value of OSI may be increased and the IVF outcome may be improved.
The major strengths of our study are the relatively large sample size and the use of OSI for evaluating ovarian sensitivity. In addition, we included patients with different BMI categories, including normal weight, overweight and obesity.54 Those with advanced age and poor ovarian reserve were excluded. One of the most important limitations of our single-center study is its retrospective design that does not allow us to establish causality for the observed association between HOMA-IR and OSI. Moreover, the Chinese ethnicity of our participants may preclude the generalizability of these findings to different ethnic groups. Another limitation of this study was the concern about sensitivity and accuracy of HOMA-IR to assess IR compared with the gold standard technique for measuring IR. However, due to convenience and cost-saving, HOMA-IR is considered, appropriate for large scale and epidemiological studies with cross-sectional design.55
Conclusion
In conclusion, HOMA-IR value was negatively associated with the decreased ovarian sensitivity assessed by OSI. Among the PCOS and overweight/obese populations, this inverse relationship may be strong. These findings will increase understanding of the contribution of IR to the development of decreased ovarian sensitivity within the ART setting. It may have implications for optimizing gonadotropin dose manipulation in patients with IR undergoing IVF/ICSI. Further studies are required to corroborate these findings in other ethnic populations and to better understand the mechanistic links between IR and ovarian sensitivity.
Acknowledgments
We are grateful to Dr Ying Zhang (Department of Gynaecology and Obstetrics, Xinjiang Production and Construction Corps 13 division Red Star Hospital) for their support on providing useful advice on the writing of the paper.
Funding
This research was funded by the Science and Technology Program Beneficial to People of Zhengzhou (2021KJHM0021).
Disclosure
The authors report no conflicts of interest in this work.
References
1. James DE, Stockli J, Birnbaum MJ. The aetiology and molecular landscape of insulin resistance. Nat Rev Mol Cell Biol. 2021;22(11):751–771. doi:10.1038/s41580-021-00390-6
2. Shanik MH, Xu Y, Skrha J, Dankner R, Zick Y, Roth J. Insulin resistance and hyperinsulinemia: is hyperinsulinemia the cart or the horse? Diabetes Care. 2008;31(Suppl 2):S262–S268. doi:10.2337/dc08-s264
3. Mongraw-Chaffin M, Hairston KG, Hanley A, et al. Association of visceral adipose tissue and insulin resistance with incident metabolic syndrome independent of obesity status: the IRAS family study. Obesity. 2021;29(7):1195–1202. doi:10.1002/oby.23177
4. Xu Z-R, Du H-W, Cui L-W, et al. Association of β-cell function and insulin resistance with pediatric type 2 diabetes among Chinese children. World J Diabetes. 2021;12(8):1292–1303. doi:10.4239/wjd.v12.i8.1292
5. Banerjee D, Biggs ML, Mercer L, et al. Insulin resistance and risk of incident heart failure: cardiovascular health study. Circ Heart Fail. 2013;6(3):364–370. doi:10.1161/CIRCHEARTFAILURE.112.000022
6. Oka R, Yagi K, Sakurai M, et al. Impact of visceral adipose tissue and subcutaneous adipose tissue on insulin resistance in middle-aged Japanese. J Atheroscler Thromb. 2012;19(9):814–822. doi:10.5551/jat.12294
7. Sadeghi A, Fadaei R, Moradi N, et al. Circulating levels of c1q/tnf-alpha-related protein 6 (ctrp6) in polycystic ovary syndrome. Iubmb Life. 2020;72(7):1449–1459. doi:10.1002/iub.2272
8. Dunaif A, Segal KR, Futterweit W, Dobrjansky A. Profound peripheral insulin resistance, independent of obesity, in polycystic ovary syndrome. Diabetes. 1989;38(9):1165–1174. doi:10.2337/diab.38.9.1165
9. Burghen GA, Givens JR, Kitabchi AE. Correlation of hyperandrogenism with hyperinsulinism in polycystic ovarian disease. J Clin Endocrinol Metab. 1980;50(1):113–116. doi:10.1210/jcem-50-1-113
10. Rosenthal M, Haskell WL, Solomon R, Widstrom A, Reaven GM. Demonstration of a relationship between level of physical training and insulin-stimulated glucose utilization in normal humans. Diabetes. 1983;32(5):408–411. doi:10.2337/diab.32.5.408
11. Jinno M, Kondou K, Teruya K. Low-dose metformin improves pregnancy rate in in vitro fertilization repeaters without polycystic ovary syndrome: prediction of effectiveness by multiple parameters related to insulin resistance. Hormones. 2010;9(2):161–170. doi:10.14310/horm.2002.1266
12. Pasquali R, Pelusi C, Genghini S, Cacciari M, Gambineri A. Obesity and reproductive disorders in women. Hum Reprod Update. 2003;9(4):359–372. doi:10.1093/humupd/dmg024
13. Yang T, Yang Y, Zhang Q, et al. Homeostatic model assessment for insulin resistance is associated with late miscarriage in non-dyslipidemic women undergoing fresh IVF/ICSI embryo transfer. Front Endocrinol. 2022;13:880518. doi:10.3389/fendo.2022.880518
14. Diamanti-Kandarakis E, Dunaif A. Insulin resistance and the polycystic ovary syndrome revisited: an update on mechanisms and implications. Endocr Rev. 2012;33(6):981–1030. doi:10.1210/er.2011-1034
15. Alebic MS, Bulum T, Stojanovic N, Duvnjak L. Definition of insulin resistance using the homeostasis model assessment (HOMA-IR) in IVF patients diagnosed with polycystic ovary syndrome (PCOS) according to the Rotterdam criteria. Endocrine. 2014;47(2):625–630. doi:10.1007/s12020-014-0182-5
16. Song H, Yu Z, Li P, Wang Y, Shi Y. Homa-ir for predicting clinical pregnancy rate during IVF. Gynecol Endocrinol. 2022;38(1):33–38. doi:10.1080/09513590.2021.1952976
17. Vural F, Vural B, Cakiroglu Y. The role of overweight and obesity in in vitro fertilization outcomes of poor ovarian responders. Biomed Res Int. 2015;2015:781543. doi:10.1155/2015/781543
18. Ubaldi F, Vaiarelli A, D’Anna R, Rienzi L. Management of poor responders in IVF: is there anything new? Biomed Res Int. 2014;2014:352098. doi:10.1155/2014/352098
19. Balen AH, Platteau P, Andersen AN, et al. The influence of body weight on response to ovulation induction with gonadotrophins in 335 women with world health organization group ii anovulatory infertility. BJOG. 2006;113(10):1195–1202. doi:10.1111/j.1471-0528.2006.01034.x
20. Mulders AG, Laven JS, Eijkemans MJ, Hughes EG, Fauser BC. Patient predictors for outcome of gonadotrophin ovulation induction in women with normogonadotrophic anovulatory infertility: a meta-analysis. Hum Reprod Update. 2003;9(5):429–449. doi:10.1093/humupd/dmg035
21. Homburg R. The management of infertility associated with polycystic ovary syndrome. Reprod Biol Endocrinol. 2003;1:109. doi:10.1186/1477-7827-1-109
22. Engmann L, Maconochie N, Bekir JS, Jacobs HS, Tan SL. Cumulative probability of clinical pregnancy and live birth after a multiple cycle IVF package: a more realistic assessment of overall and age-specific success rates? Br J Obstet Gynaecol. 1999;106(2):165–170. doi:10.1111/j.1471-0528.1999.tb08217.x
23. Grynberg M, Labrosse J. Understanding follicular output rate (fort) and its implications for Poseidon criteria. Front Endocrinol. 2019;10:246. doi:10.3389/fendo.2019.00246
24. Zheng Y, Pan Y, Li P, Wang Z, Wang Z, Shi Y. Ovarian sensitivity decreased significantly in patients with insulin resistance undergoing in vitro fertilization and embryo transfer. Front Physiol. 2021;12:809419. doi:10.3389/fphys.2021.809419
25. Huber M, Hadziosmanovic N, Berglund L, Holte J. Using the ovarian sensitivity index to define poor, normal, and high response after controlled ovarian hyperstimulation in the long gonadotropin-releasing hormone-agonist protocol: suggestions for a new principle to solve an old problem. Fertil Steril. 2013;100(5):1270–1276. doi:10.1016/j.fertnstert.2013.06.049
26. Weghofer A, Barad DH, Darmon SK, Kushnir VA, Albertini DF, Gleicher N. The ovarian sensitivity index is predictive of live birth chances after IVF in infertile patients. Hum Reprod Open. 2020;2020(4):a49. doi:10.1093/hropen/hoaa049
27. Revelli A, Gennarelli G, Biasoni V, et al. The ovarian sensitivity index (osi) significantly correlates with ovarian reserve biomarkers, is more predictive of clinical pregnancy than the total number of oocytes, and is consistent in consecutive IVF cycles. J Clin Med. 2020;9:6. doi:10.3390/jcm9061914
28. Dickerson EH, Cho LW, Maguiness SD, Killick SL, Robinson J, Atkin SL. Insulin resistance and free androgen index correlate with the outcome of controlled ovarian hyperstimulation in non-pcos women undergoing IVF. Hum Reprod. 2010;25(2):504–509. doi:10.1093/humrep/dep393
29. Wang H, Zhang Y, Fang X, Kwak-Kim J, Wu L. Insulin resistance adversely affect IVF outcomes in lean women without pcos. Front Endocrinol. 2021;12:734638. doi:10.3389/fendo.2021.734638
30. La Marca A, Pati M, Giulini S, Levratti P, Caretto S, Volpe A. Does plasma insulin level affect ovarian response to exogenous administration of follicle-stimulating hormone in women without polycystic ovary syndrome? Gynecol Endocrinol. 2005;21(5):292–294. doi:10.1080/09513590500386983
31. Dale PO, Tanbo T, Haug E, Abyholm T. The impact of insulin resistance on the outcome of ovulation induction with low-dose follicle stimulating hormone in women with polycystic ovary syndrome. Hum Reprod. 1998;13(3):567–570. doi:10.1093/humrep/13.3.567
32. Matthews DR, Hosker JP, Rudenski AS, Naylor BA, Treacher DF, Turner RC. Homeostasis model assessment: insulin resistance and beta-cell function from fasting plasma glucose and insulin concentrations in man. Diabetologia. 1985;28(7):412–419. doi:10.1007/BF00280883
33. Eshre TR. Revised 2003 consensus on diagnostic criteria and long-term health risks related to polycystic ovary syndrome. Fertil Steril. 2004;81(1):19–25. doi:10.1016/j.fertnstert.2003.10.004
34. Consultation WE. Appropriate body-mass index for asian populations and its implications for policy and intervention strategies. Lancet. 2004;363(9403):157–163. doi:10.1016/S0140-6736(03)15268-3
35. Biasoni V, Patriarca A, Dalmasso P, et al. Ovarian sensitivity index is strongly related to circulating amh and may be used to predict ovarian response to exogenous gonadotropins in IVF. Reprod Biol Endocrinol. 2011;9:112. doi:10.1186/1477-7827-9-112
36. Li HW, Lee VC, Ho PC, Ng EH. Ovarian sensitivity index is a better measure of ovarian responsiveness to gonadotrophin stimulation than the number of oocytes during in-vitro fertilization treatment. J Assist Reprod Genet. 2014;31(2):199–203. doi:10.1007/s10815-013-0144-5
37. Keskin M, Kurtoglu S, Kendirci M, Atabek ME, Yazici C. Homeostasis model assessment is more reliable than the fasting glucose/insulin ratio and quantitative insulin sensitivity check index for assessing insulin resistance among obese children and adolescents. Pediatrics. 2005;115(4):e500–e503. doi:10.1542/peds.2004-1921
38. Coffler MS, Patel K, Dahan MH, Yoo RY, Malcom PJ, Chang RJ. Enhanced granulosa cell responsiveness to follicle-stimulating hormone during insulin infusion in women with polycystic ovary syndrome treated with pioglitazone. J Clin Endocrinol Metab. 2003;88(12):5624–5631. doi:10.1210/jc.2003-030745
39. Belani M, Purohit N, Pillai P, Gupta S, Gupta S. Modulation of steroidogenic pathway in rat granulosa cells with subclinical cd exposure and insulin resistance: an impact on female fertility. Biomed Res Int. 2014;2014:460251. doi:10.1155/2014/460251
40. Macut D, Simic T, Lissounov A, et al. Insulin resistance in non-obese women with polycystic ovary syndrome: relation to byproducts of oxidative stress. Exp Clin Endocrinol Diabetes. 2011;119(7):451–455. doi:10.1055/s-0031-1279740
41. Safar FH, Mojiminiyi OA, Al-Rumaih HM, Diejomaoh MF. Computational methods are significant determinants of the associations and definitions of insulin resistance using the homeostasis model assessment in women of reproductive age. Clin Chem. 2011;57(2):279–285. doi:10.1373/clinchem.2010.152025
42. Legro RS, Castracane VD, Kauffman RP. Detecting insulin resistance in polycystic ovary syndrome: purposes and pitfalls. Obstet Gynecol Surv. 2004;59(2):141–154. doi:10.1097/01.OGX.0000109523.25076.E2
43. Ovalle F, Azziz R. Insulin resistance, polycystic ovary syndrome, and type 2 diabetes mellitus. Fertil Steril. 2002;77(6):1095–1105. doi:10.1016/s0015-0282(02)03111-4
44. Vandermolen DT, Ratts VS, Evans WS, Stovall DW, Kauma SW, Nestler JE. Metformin increases the ovulatory rate and pregnancy rate from clomiphene citrate in patients with polycystic ovary syndrome who are resistant to clomiphene citrate alone. Fertil Steril. 2001;75(2):310–315. doi:10.1016/s0015-0282(00)01675-7
45. Nestler JE, Jakubowicz DJ, Evans WS, Pasquali R. Effects of metformin on spontaneous and clomiphene-induced ovulation in the polycystic ovary syndrome. N Engl J Med. 1998;338(26):1876–1880. doi:10.1056/NEJM199806253382603
46. De Leo V, la Marca A, Ditto A, Morgante G, Cianci A. Effects of metformin on gonadotropin-induced ovulation in women with polycystic ovary syndrome. Fertil Steril. 1999;72(2):282–285. doi:10.1016/s0015-0282(99)00208-3
47. Nafiye Y, Sevtap K, Muammer D, Emre O, Senol K, Leyla M. The effect of serum and intrafollicular insulin resistance parameters and homocysteine levels of nonobese, nonhyperandrogenemic polycystic ovary syndrome patients on in vitro fertilization outcome. Fertil Steril. 2010;93(6):1864–1869. doi:10.1016/j.fertnstert.2008.12.024
48. Li Y, Yang D, Zhang Q. Impact of overweight and underweight on IVF treatment in Chinese women. Gynecol Endocrinol. 2010;26(6):416–422. doi:10.3109/09513591003632118
49. Spandorfer SD, Kump L, Goldschlag D, Brodkin T, Davis OK, Rosenwaks Z. Obesity and in vitro fertilization: negative influences on outcome. J Reprod Med. 2004;49(12):973–977.
50. van Swieten EC, van der Leeuw-Harmsen L, Badings EA, van der Linden PJ. Obesity and clomiphene challenge test as predictors of outcome of in vitro fertilization and intracytoplasmic sperm injection. Gynecol Obstet Invest. 2005;59(4):220–224. doi:10.1159/000084347
51. Wang JX, Davies MJ, Norman RJ. Obesity increases the risk of spontaneous abortion during infertility treatment. Obes Res. 2002;10(6):551–554. doi:10.1038/oby.2002.74
52. Petanovski Z, Dimitrov G, Ajdin B, et al. Impact of body mass index (BMI) and age on the outcome of the IVF process. Prilozi. 2011;32(1):155–171.
53. Chen S, Chen Y, Liu X, et al. Insulin resistance and metabolic syndrome in normal-weight individuals. Endocrine. 2014;46(3):496–504. doi:10.1007/s12020-013-0079-8
54. Zhou BF. Predictive values of body mass index and waist circumference for risk factors of certain related diseases in Chinese adults--study on optimal cut-off points of body mass index and waist circumference in Chinese adults. Biomed Environ Sci. 2002;15(1):83–96.
55. Buchanan TA, Watanabe RM, Xiang AH. Limitations in surrogate measures of insulin resistance. J Clin Endocrinol Metab. 2010;95(11):4874–4876. doi:10.1210/jc.2010-2167
 © 2023 The Author(s). This work is published and licensed by Dove Medical Press Limited. The full terms of this license are available at https://www.dovepress.com/terms.php and incorporate the Creative Commons Attribution - Non Commercial (unported, v3.0) License.
By accessing the work you hereby accept the Terms. Non-commercial uses of the work are permitted without any further permission from Dove Medical Press Limited, provided the work is properly attributed. For permission for commercial use of this work, please see paragraphs 4.2 and 5 of our Terms.
© 2023 The Author(s). This work is published and licensed by Dove Medical Press Limited. The full terms of this license are available at https://www.dovepress.com/terms.php and incorporate the Creative Commons Attribution - Non Commercial (unported, v3.0) License.
By accessing the work you hereby accept the Terms. Non-commercial uses of the work are permitted without any further permission from Dove Medical Press Limited, provided the work is properly attributed. For permission for commercial use of this work, please see paragraphs 4.2 and 5 of our Terms.