")
Back to Journals » International Journal of General Medicine » Volume 16
Association of Hemoglobin to Red Blood Cell Distribution Width-Standard Deviation (RDW-SD) Ratio and 3-Month Readmission in Elderly Chinese Patients with Heart Failure: A Retrospective Cohort Study
Authors Song J , Yu T , Yan Q , Zhang Q, Wang L
Received 9 November 2022
Accepted for publication 20 January 2023
Published 24 January 2023 Volume 2023:16 Pages 303—315
DOI https://doi.org/10.2147/IJGM.S396805
Checked for plagiarism Yes
Review by Single anonymous peer review
Peer reviewer comments 2
Editor who approved publication: Dr Scott Fraser
Jikai Song,1,* Tianhang Yu,2,* Qiqi Yan,1,* Qinggang Zhang,1,* Lihong Wang1
1Zhejiang Provincial People’s Hospital, Qingdao University, Hangzhou, Zhejiang Province, People’s Republic of China; 2North China University of Science and Technology, Tangshan, Hebei Province, People’s Republic of China
*These authors contributed equally to this work
Correspondence: Lihong Wang, Zhejiang Provincial People’s Hospital, Hangzhou, People’s Republic of China, Tel +86 13666690598, Email [email protected]
Purpose: Hemoglobin (Hb) and red blood cell distribution width-standard deviation (RDW-SD) have clinical significance in the prognosis of heart failure (HF). Little is known regarding the prognostic value of the Hb/RDW-SD ratio in patients with HF. This study sought to investigate the association between Hb/RDW-SD ratio and HF 3-month readmission in Chinese elderly patients.
Patients and Methods: The present study was a retrospective cohort study. A total of 1816 HF patients were extracted from the Chinese HF database. A generalized linear model was used to explore the association between Hb/RDW-SD and 3-month readmission in HF. The generalized additive model was used to explore the nonlinear relationship, and a two-piecewise linear regression model was used to find the inflection point. Subgroup analysis explored interactions and whether each subgroup was consistent with the primary outcome direction.
Results: Result showed Hb/RDW-SD was negatively associated with HF 3-month readmission (OR = 0.70, 95% CI: 0.55 to 0.89, P = 0.0031). A non-linear relationship was detected between Hb/RDW-SD and HF 3-month readmission with two inflection points (1.78 and 2.17). Both Hb/RDW-SD < 1.78 and Hb/RDW-SD > 2.17 showed a significant correlation between them, with corresponding effect values of (OR = 0.38, 95% CI: 0.17 to 0.87, P = 0.0209) and (OR = 0.44, 95% CI: 0.27 to 0.71, P = 0.0007), respectively.
Conclusion: Hb/RDW-SD is negatively associated with HF 3-month readmission. The relationship between Hb/RDW-SD and HF 3-month readmission is also non-linear. Both Hb/RDW-SD < 1.78 and Hb/RDW-SD > 2.17 were strong negatively associated with HF 3-month readmission.
Keywords: hemoglobin, red blood cell distribution width-standard deviation, readmission, nonlinearity
Introduction
Heart failure (HF) is a quintessential cardiovascular disease of the elderly, with the incidence increasing from 6% between the ages of 60 and 79 to 12% over the age of 80, while its incidence is likely to continue to rise in the future due to an aging population.1 However, China’s elderly population continues to grow and has gradually entered an aging society. According to the National Bureau of Statistics of China 2020, by the end of 2019, there were approximately 254 million people over the age of 60, accounting for 18.1% of the total population.2 Despite the effective treatment of HF patients, however, surprisingly, all-cause readmission rates for HF have been steadily increasing over the past decade.3 For the management of clinical patients, HF is a great challenge and requires the active identification of new risk factors and the development of appropriate treatment plans.
Up to now, there are many clinical variables that can be used to predict the clinical outcome of HF. Hemoglobin (Hb) is an easily detectable and widely used clinical parameter that has an important impact on the prognosis of patients with HF.4 Anemia status reflects the nutritional, inflammatory, and general condition of the HF patient.5 A study by Felker et al found that red blood cell distribution width (RDW) is a novel marker of HF prognosis.6 In recent years, it has been discovered that variations in RDW closely correlate with the inflammatory response of the human Body System.7,8 A previous study also found RDW to be predictive of various cardiovascular disorders.9 However, the prognostic impact of RDW on readmission in HF patients is not only related to their inflammatory response but is also influenced by complex clinical conditions. In recent years, several studies have revealed that the hemoglobin to red blood cell distribution width ratio (Hb/RDW) may be a better choice. This concept was first proposed by Sun et al and confirmed in patients with esophageal squamous cell carcinoma.10 Subsequently, Qu et al demonstrated that Hb/RDW is an independent risk factor for predicting frailty in patients with coronary heart disease.11 They both found Hb/RDW to be a better prognostic indicator than either Hb alone or RDW by itself. This is considered that Hb/RDW combining Hb and RDW can provide more information than a single variable.10
Considering the research advances mentioned above, perhaps Hb/RDW would be a good option to apply to the prognostic assessment of readmission for HF patients. However, the study by Hoffmann et al suggests that future studies on RDW should focus more on red blood cell distribution width-standard deviation (RDW-SD).12 On the one hand, there is an age dependence of RDW, and on the other hand, RDW is a parameter that lacks international standardization and may yield different RDW values on devices from different manufacturers.13,14 Besides, another potential problem with RDW must be mentioned. The calculation of RDW requires the use of mean red blood cell volume (MCV), which also has an age dependence, leading to another correlation that may be introduced in the calculation of RDW. Eliminating the impact of MCV on RDW would make sense. Fortunately, RDW-SD can easily overcome this problem. In conclusion, Hb/RDW-SD should be a better choice for HF patients when figuring out their risk of being readmitted. However, the study of the Hb/RDW-SD ratio in HF patients remains scarce, especially in the elderly. So, we analyzed the association between Hb/RDW-SD ratio and readmission in elderly patients with HF in a Chinese cohort.
Materials and Methods
Data Source
The study’s participants were selected from a Chinese population database that is accessible to the public on PhysioNet (https://physionet.org/content/heart-failure-zigong/1.3/).15,16 The databases were created in conformity with the ethical standards set forth by the Massachusetts Institute of Technology Institutional Review Board (Cambridge, MA, USA). Author Song, who successfully finished the training program at the National Institutes of Health and was allowed admission, gathered all the information for this essay (certification number: 42287940).
Study Population
Between December 2016 and June 2019, the study was carried out at the Fourth People’s Hospital in Zigong, Sichuan, China. The Zigong Fourth People’s Hospital’s Ethics Committee gave its approval to the study (Approval Number: 2020-010). Since this HF data was obtained from the international public database PhysioNet, the approval of the ethics committee of this study institution was not required. The informed consent requirement was waived since the patient’s identity remained anonymous. The study adheres to the Helsinki Declaration. The study reviewed the electronic medical records of patients with a consecutive diagnosis of HF. Heart failure was defined according to the criteria of the European Society of Cardiology (ESC).17 The study’s patients with HF had their diagnoses made at the time of admission, and they were entered into the electronic medical record system using International Classification of Diseases-9 (ICD-9) codes. A total of 2008 patients were included in the heart failure database. Only those who were 60 years of age or older were included in this study, and patients who died within three months were omitted.
Data Collection
The main categories of data collected include the following: demographic data, baseline clinical characteristics, laboratory results, comorbidities, and outcomes. If a patient was being admitted for the first time, a nurse manually entered their demographic data into the electronic medical record system. The patient’s age, gender, height, weight, admission ward, occupation, and date of admission were all listed on the first page of the medical record. Clinical baseline characteristics were measured on the day of admission, such as temperature, body mass index (BMI), systolic blood pressure (SBP), diastolic blood pressure (DBP), type of HF, and New York Heart Association (NYHA) cardiac function. Echocardiographic findings included left ventricular ejection fraction (LVEF). Data on the clinical baseline features was gathered from the initial hospitalization measurement. Results from laboratory tests were gathered on the day of admission. From the admission records, comorbidities were identified. Laboratory findings were obtained from day one of hospital admission, including urea, glomerular filtration rate, white blood cell count, moderate to severe chronic kidney disease with glomerular filtration rate < 60 mL/min (MSCKD), creatinine, red blood cell count, RDW, RDW-SD, mean corpuscular volume (MCV); mean hemoglobin volume (MCH); mean hemoglobin concentration (MCHC), hemoglobin, platelet, chloride, sodium, and so on. The target independent variable was Hb/RDW-SD, obtained at baseline and calculated as Hb divided by RDW-SD. Information on subsequent hospital admissions and mortality was gathered during mandated follow-up visits at 3 months (the follow-up visit was replaced by a phone call if the patient was unable to reach the clinical center).
Study Endpoints
The study’s outcome was 3-month readmission in elderly Chinese patients with HF who were older than 60. The first readmission within three months of hospital release was considered a readmission.
Statistical Analysis
First, the HF patients were stratified by quartiles of Hb/RDW-SD. For continuous variable data, the mean ± standard deviation was used for normal distributions, and the median (quartiles) was used for skewed distributions, while frequency or percentile was used for categorical variables. The means and proportions of the groups were compared to see if there were any significant differences using the one-way ANOVA (normal distribution), the Kruskal–Wallis H-test (skewed distribution), and the chi-square test (categorical variables). Generalized linear model was used to explore the association between Hb/RDW-SD and 3-month readmission in HF, and adjusted odds ratios (ORs) with 95% confidence intervals (CIs) were used to measure the risk of 3-month readmission. In accordance with the suggestion of the STROBE statement,18 we presented the results of unadjusted, minimally adjusted, and fully adjusted analyses concurrently. Whether covariates need to be adjusted at the statistical level was based on the following principles: we chose these confounding variables based on their associations with the outcomes of interest or a change in effect estimate of at least 10%.19 The associations between each confounding variable and the outcomes of interest are included in Supplemental Tables 1–3 To ensure the robustness of the data analysis, we continued with the following data analysis. We transformed Hb/RDW-SD into a categorical variable stratified to see the relationship with 3-month readmission and calculated the corresponding P for trend. The aim was to validate the stability of the results of Hb/RDW-SD as a continuous variable and to observe the possibility of nonlinearity. Since Hb/RDW-SD was a continuous variable, we also used a generalized additive model (GAM) and curve fitting to try to figure out its nonlinear relationship with 3-month readmission. A two-piecewise linear regression model was used to calculate the threshold effect of Hb/RDW-SD on 3-month readmission if a possible nonlinear relationship was observed for the curve-fit plots.20 The threshold level (ie, the inflection point) was found via trial and error, including the selection of turning points along a predefined interval, followed by the selection of the turning point that provided the greatest model likelihood. In addition, we compared the one-line linear regression model to a two-piecewise linear model using a log likelihood ratio test. The subgroup analyses according to age, gender, diabetes, MSCKD, DBP, SBP, BNP, and NYHA class were performed using stratified logistic regressions and presented in forest plots. Tests for effect modification by subgroup used interaction terms between subgroup indicators and Hb/RDW-SD, followed by the likelihood ratio test.
R version 4.2.0 (The R Foundation for Statistical Computing, Vienna, Austria) and the Empower Stats 4.0 (X&Y solutions, Inc. Boston MA) were applied for all statistical analysis. Two-sided P < 0.05 was considered statistically significant.
Sensitivity Analysis
To further ensure the stability of the statistical analysis, we did several sensitivity analyses as follows. To account for missing data, we employed multiple imputation (MI) based on five replications using a chained equation technique in the R MI procedure.21–23 Immediately afterwards, the original data sets were compared with the five sets of MI-generated data for population descriptions. Afterwards, we reanalyzed the unadjusted, minimally adjusted, and fully adjusted analyses as well as curve fitting and threshold effect analyses with these 6 data sets. The effect values derived from the five sets of MI interpolated data were combined to determine whether the interpolated data and the original data core results were consistent.24
We noticed that more than half of the patients in the cohort did not have LVEF values recorded (Supplemental Table 4). We would have had many missing values if we had utilized the LVEF values as the covariate directly. Instead, we used the LVEF values’ presence or absence as the covariate. As a result, a covariate that indicated whether LVEF was recorded was added to our models.25
Results
A total of 1816 patients (40.42% male and 59.58% female) were eventually extracted from the database. Patients aged 60–69 years accounted for 19.99%, those aged 70–79 years accounted for 39.21%, and those ≥80 years accounted for 40.80%. The mean value of Hb was 113.62 ± 23.91, the mean value of RDW-SD was 48.90 ± 6.28, and the mean value of Hb/RDW-SD was 2.37 ± 0.58. The occupational distribution of HF patients included 1520 (84.87%) urban residents, 173 (9.66%) farmers, and 98 (5.47%) in other occupations. At the 3-month follow-up, 458 (25.22%) people were readmitted.
Baseline Characteristics of the Study Participants
Table 1 describes the baseline characteristics of the HF population by quartiles of the Hb/RDW-SD. In this study, patients with HF were divided into different subgroups using Hb/RDW-SD quartiles (0.44–2.01, 2.01–2.42, 2.42–2.79, 2.79–4.14). We found that in the highest Hb/RDW-SD group, HF patients generally had higher DBP, GFR, Hb, albumin, total bilirubin, and lower creatinine, urea, RDW-SD, potassium, and BNP.
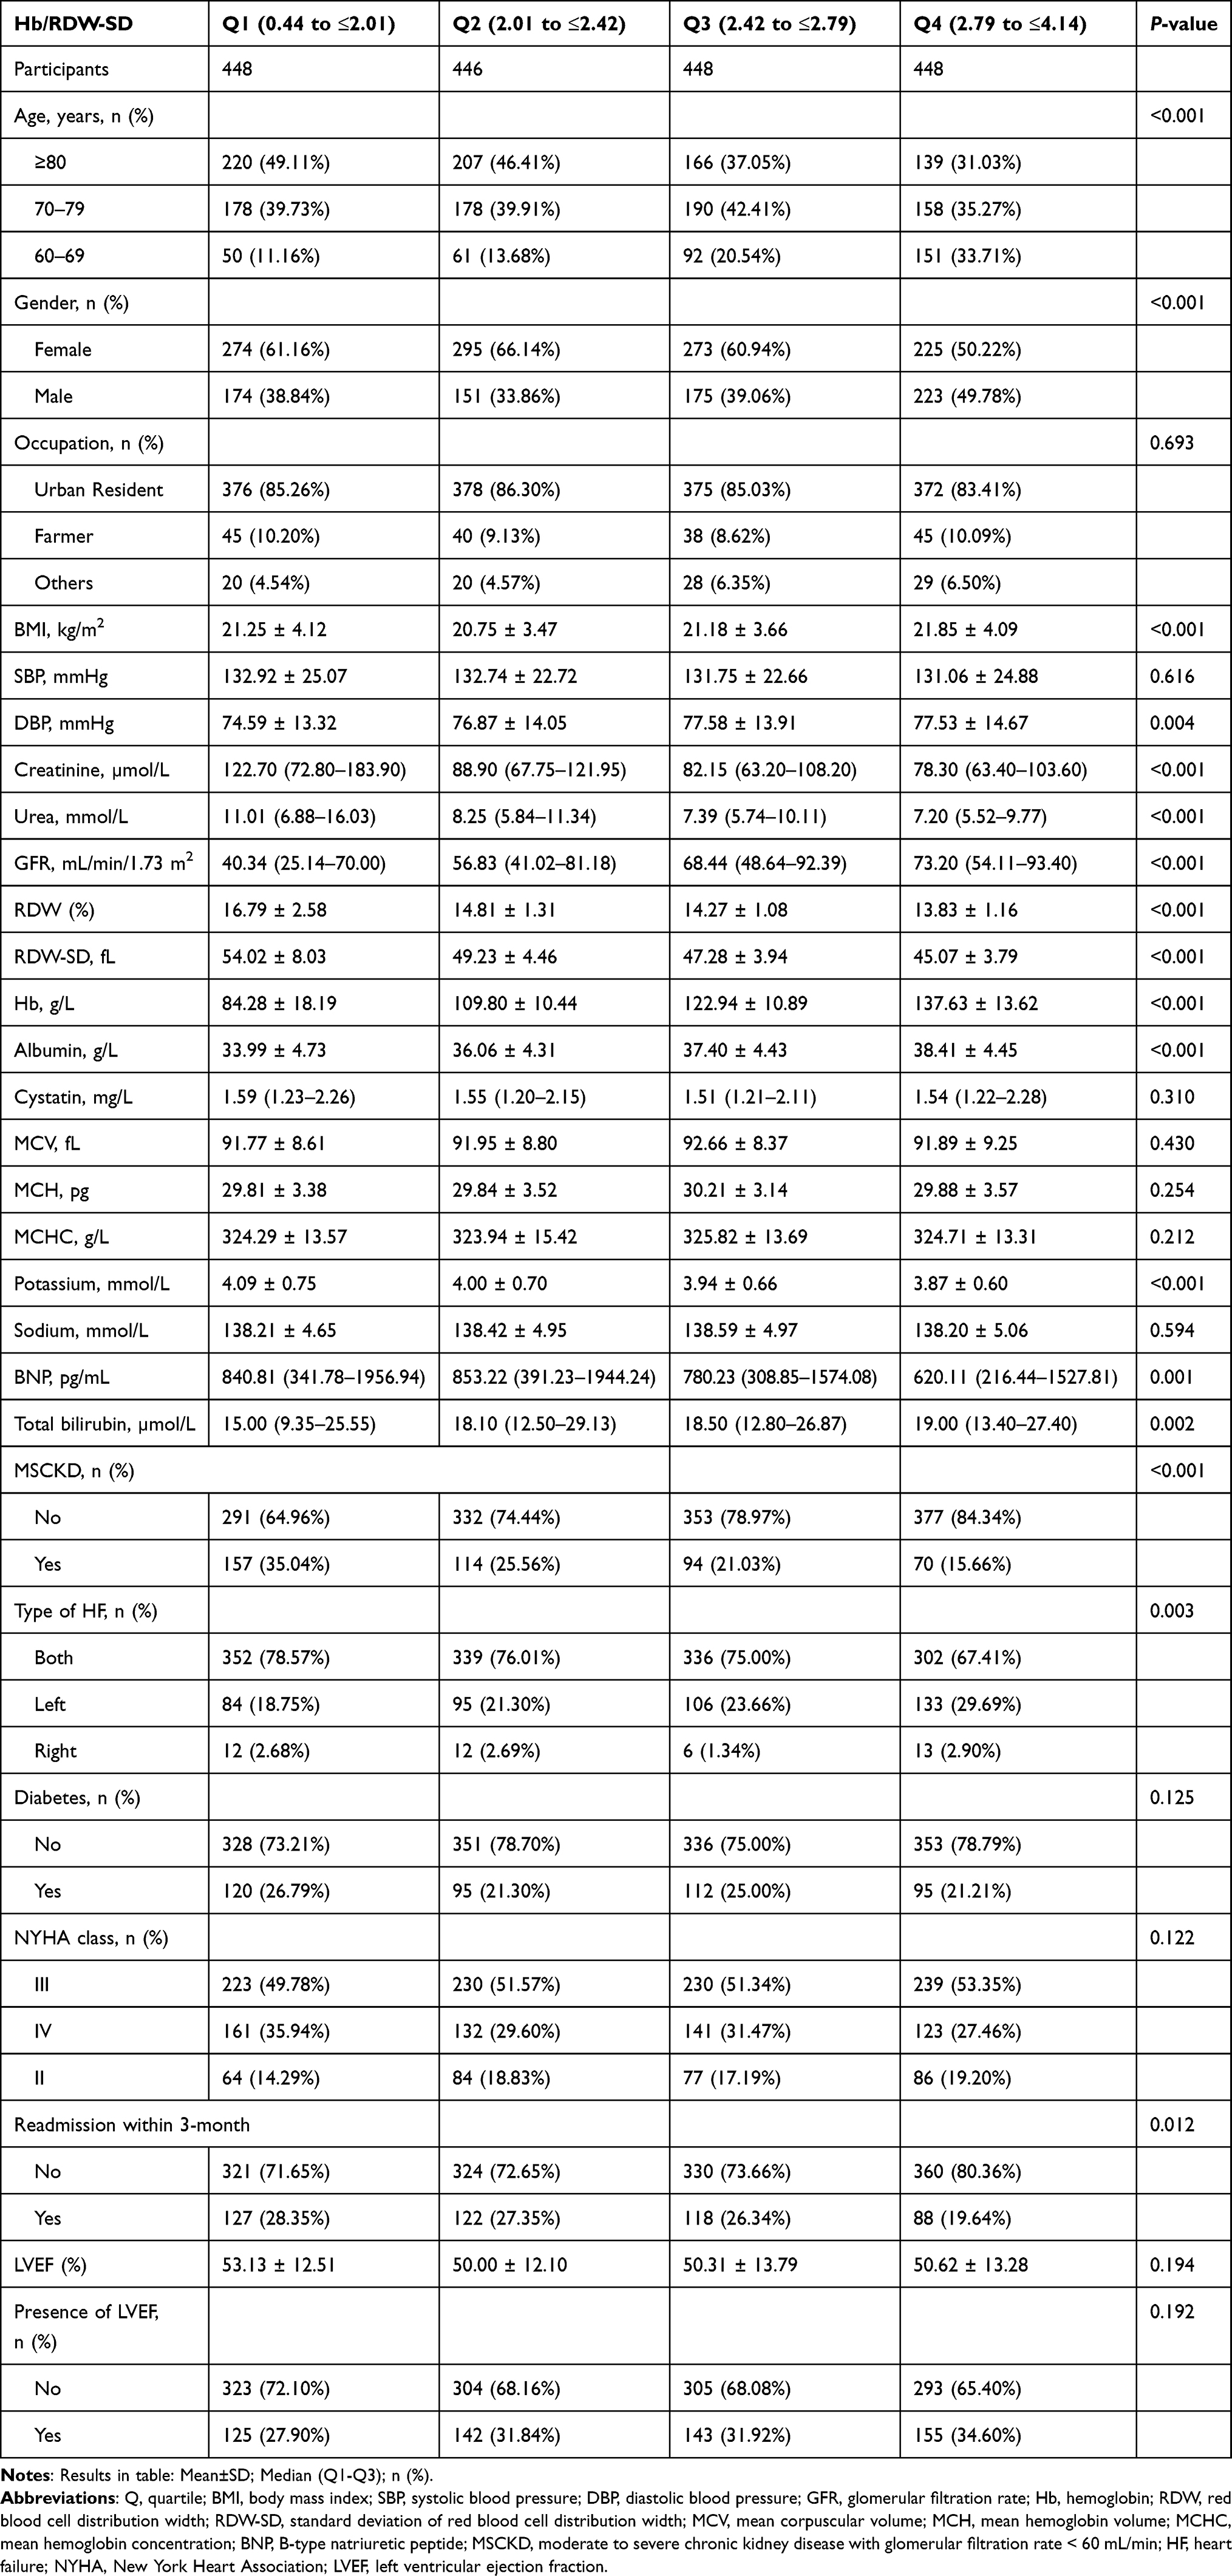 |
Table 1 The Baseline Characteristics of Participants |
Univariate Analysis
Table 2 presents the results of the univariate analysis. The results of univariate analysis showed that MSCKD, diabetes, creatinine, urea, potassium, and total bilirubin were positively associated with 3-month readmission. However, SBP, DBP, GFR, Hb/RDW-SD, and sodium were negatively associated with 3-month readmission. We also found that among age, 60–69 years was negatively associated with 3-month readmission compared with 80+ years; among occupation, farmer was negatively associated with 3-month readmission compared with urban residents; and among NYHA class, class IV was positively associated with outcome and class II was negatively associated with outcome compared with class III.
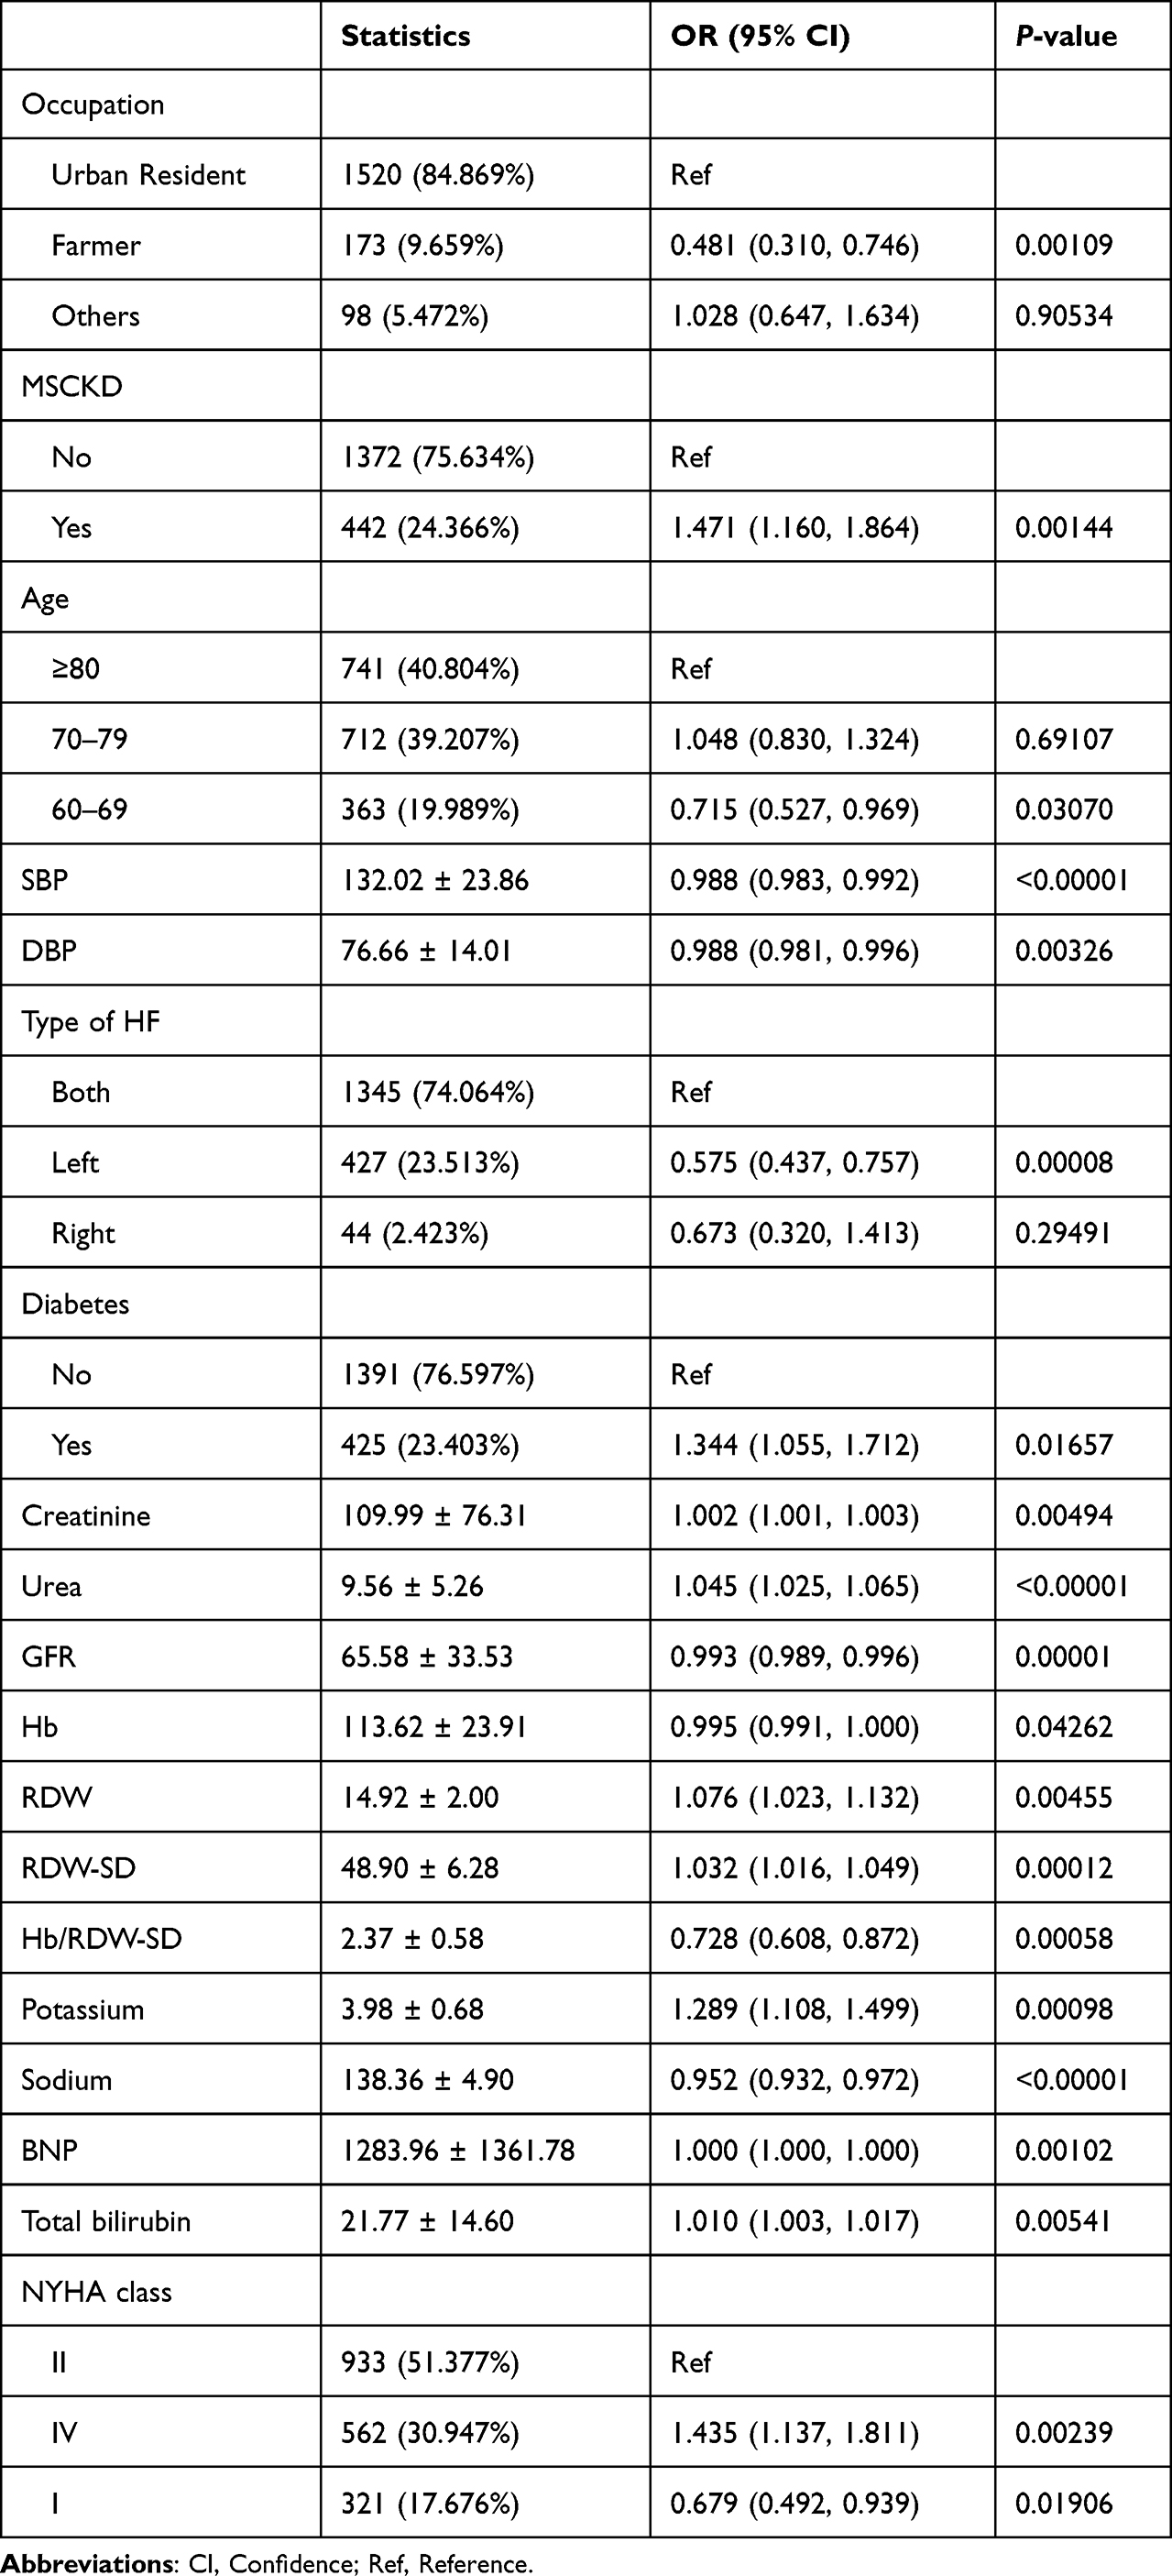 |
Table 2 The Results of Univariate Analysis |
The Results of Relationship Between Hb/RDW-SD and 3-Month Readmission
We used logistic regression model to evaluate the associations between Hb/RDW-SD and HF readmission within 3 months. Meanwhile, Table 3 shows the unadjusted, minimally adjusted, and fully adjusted models. In crude model, Hb/RDW-SD showed negative correlation with HF readmission within 3-month (OR = 0.73, 95% CI: 0.61 to 0.87, P = 0.0006). In minimally adjusted model (adjusted age and gender), the result did not have an obvious change (OR = 0.74, 95% CI: 0.62 to 0.89, P = 0.0017). In the fully adjusted model (adjusted age, gender, occupation, MSCKD, SBP, DBP, type of HF, diabetes, creatinine, urea, GFR, albumin, potassium, sodium, BNP, total bilirubin, NYHA class, presence of LVEF), we could also detect the association (OR = 0.70, 95% CI: 0.55 to 0.89, P = 0.0031). For the considerations of stability of the analysis, we used Hb/RDW-SD as a categorical variable (quartile), and in the fully adjusted model, the highest quartile reduced readmission by 35% compared with the lowest quartile. Meanwhile, we also found that the trend across the different models of the quartiles was significant (P for trend = 0.0033, 0.0097, and 0.0226, respectively).
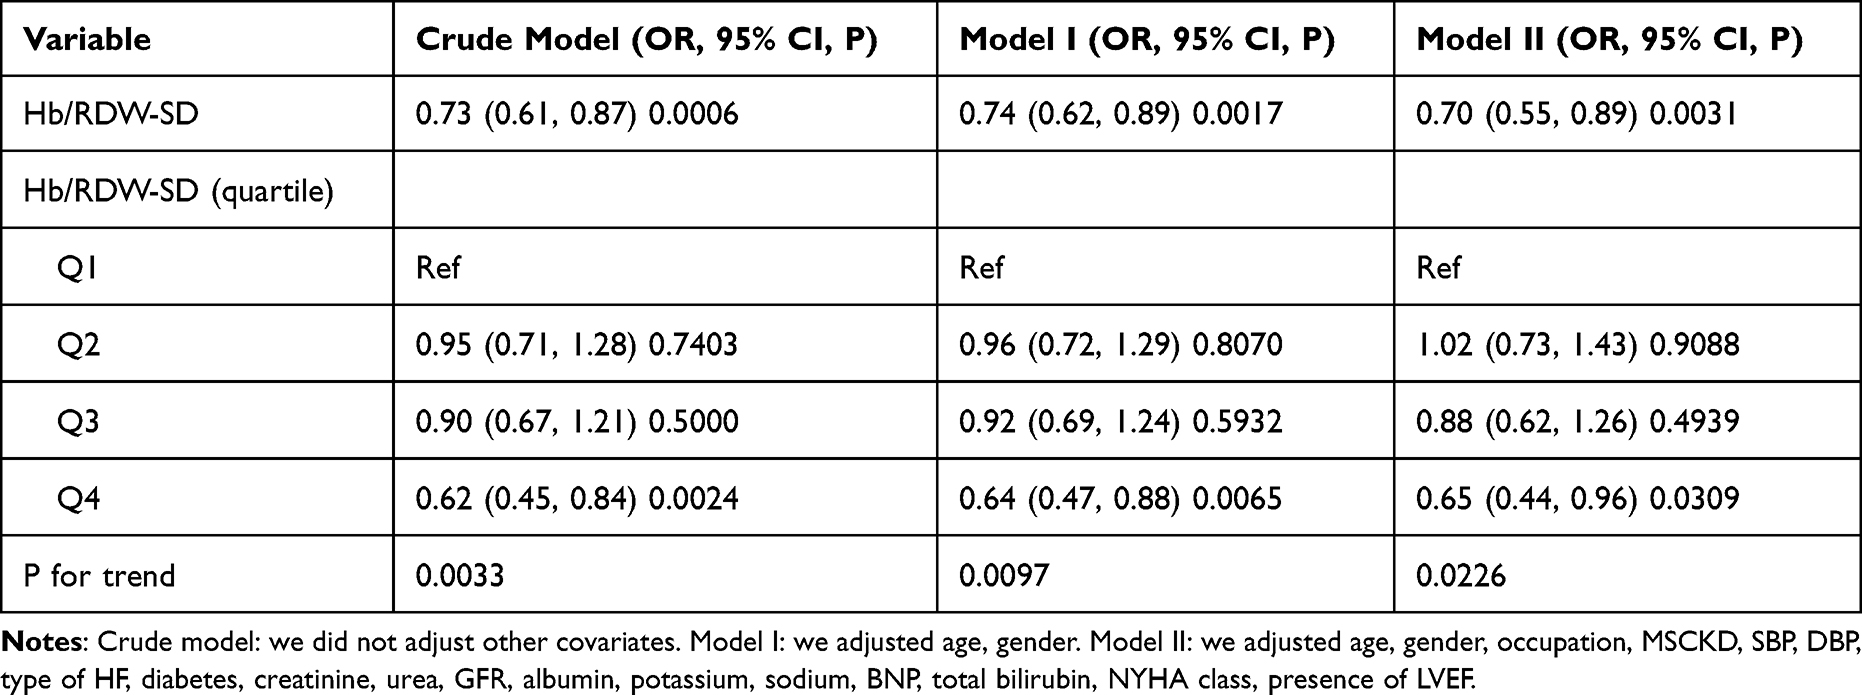 |
Table 3 Relationship Between Hb/RDW-SD and HF 3-Month Readmission in Different Models |
The Analyses of Non-Linear Relationship
The smooth curve was constructed by GAM to identify whether there is a nonlinear relationship between Hb/RDW-SD and HF readmission within 3 months. From Figure 1, we can see that there is a nonlinear relationship between Hb/RDW-SD and HF readmission within 3 months (after adjusting for age, gender, occupation, MSCKD, SBP, DBP, type of HF, diabetes, creatinine, urea, GFR, albumin, potassium, sodium, BNP, total bilirubin, and NYHA class). To find the possible inflection point, we performed the calculation by using a two-piecewise linear regression model. The results showed two inflection points for Hb/RDW-SD, 1.78 and 2.17, respectively (p-value of log-likelihood ratio is 0.002). Both Hb/RDW-SD < 1.78 and Hb/RDW-SD > 2.17 showed a significant correlation between Hb/RDW-SD and HF 3-month readmission, with corresponding effect values of (OR = 0.38, 95% CI: 0.17 to 0.87, P = 0.0209) and (OR = 0.44, 95% CI: 0.27 to 0.71, P = 0.0007), respectively (Table 4).
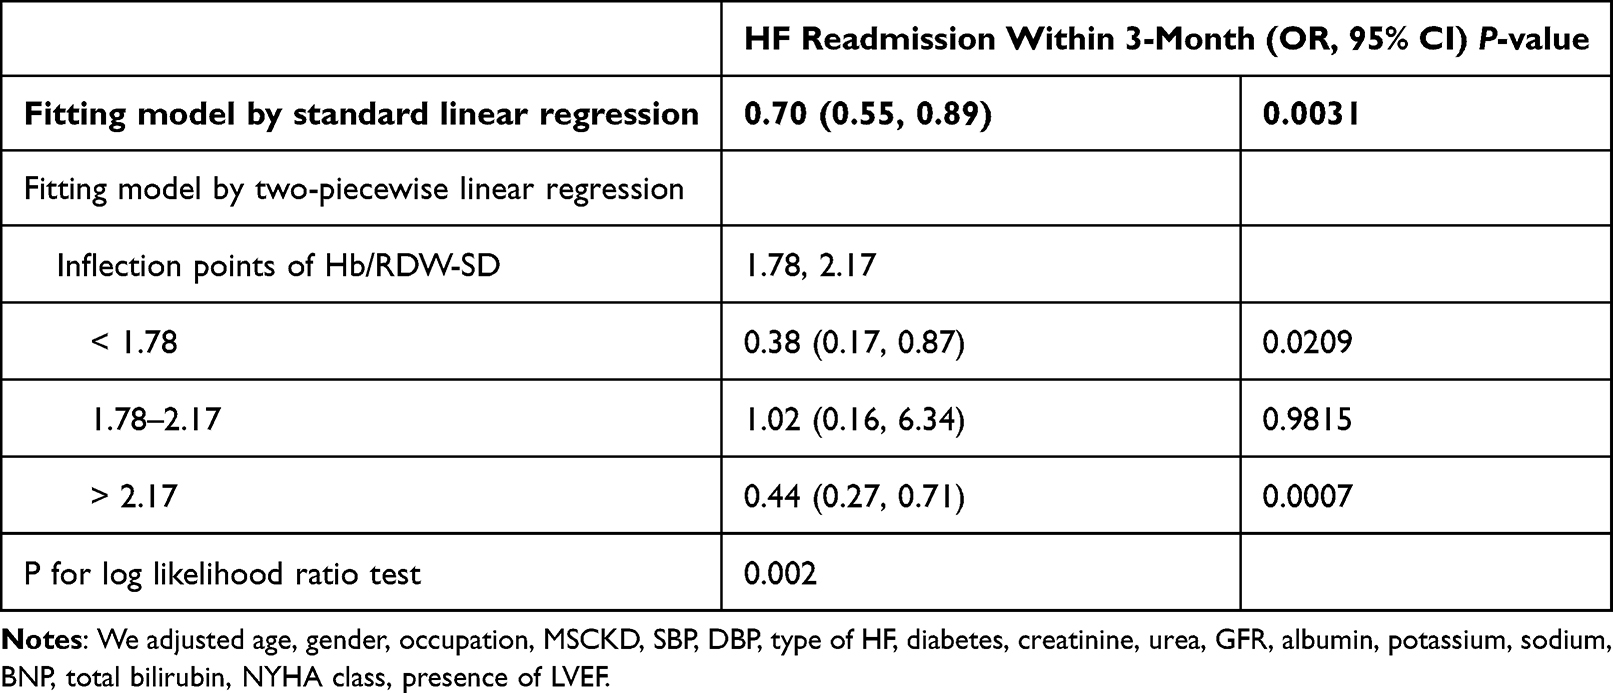 |
Table 4 Threshold Effect Analysis of Hb/RDW-SD on HF Readmission Within 3-Month Using Piece-Wise Linear Regression |
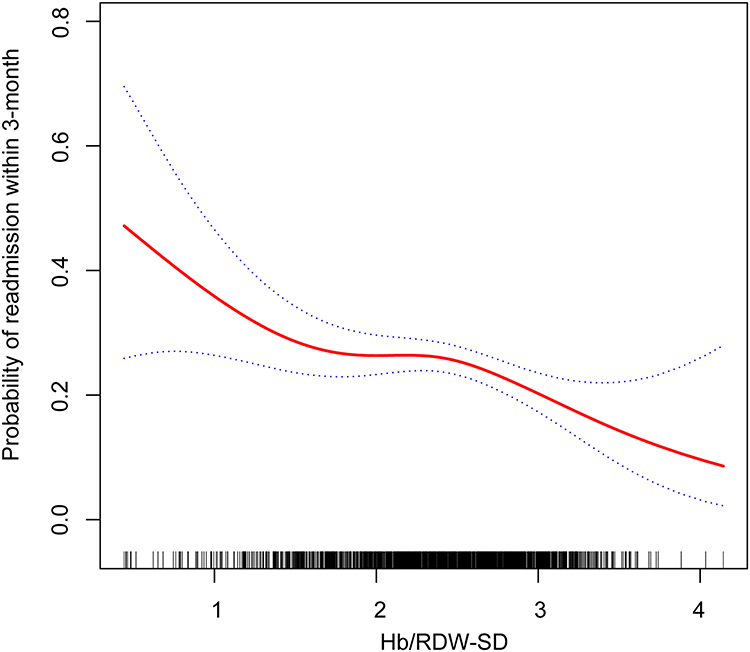 |
Figure 1 The non-linear relationship between Hb/RDW-SD and HF 3-month readmission. A non-linear relationship between them was detected after adjusting for age, gender, occupation, MSCKD, SBP, DBP, type of HF, diabetes, creatinine, urea, GFR, albumin, potassium, sodium, BNP, total bilirubin, NYHA class, presence of LVEF. |
The Results of Subgroup Analyses
By performing subgroup analysis, we further explored other risks between Hb/RDW-SD and HF readmission within 3 months to assess other factors that may affect the outcome (Figure 2). A significantly stronger negative association between Hb/RDW-SD and HF readmission within 3 months was found among those aged 70 to 79 (OR = 0.47, 95% CI: 0.32 to 0.67) than in those aged ≥80 (OR = 1.00, 95% CI: 0.68 to 1.46) and those aged 60 to 69 (OR = 0.83, 95% CI: 0.44 to 1.54) (P-interaction = 0.0145). Similar results were found when without MSCKD (OR = 0.60, 95% CI: 0.68 to 1.46) (P-interaction = 0.0166); DBP<90 (OR = 0.63, 95% CI: 0.49 to 0.81) (P-interaction = 0.0377); BNP≤400 (OR = 0.43, 95% CI: 0.29 to 0.63) (P-interaction = 0.0014); NYHA class III (OR = 0.52, 95% CI: 0.37 to 0.73) (P-interaction = 0.0119). In contrast, the weaker association were detected in the population with age (60–69 or ≥80), MSCKD, DBP≥90, BNP>400, and NYHA class (II or IV).
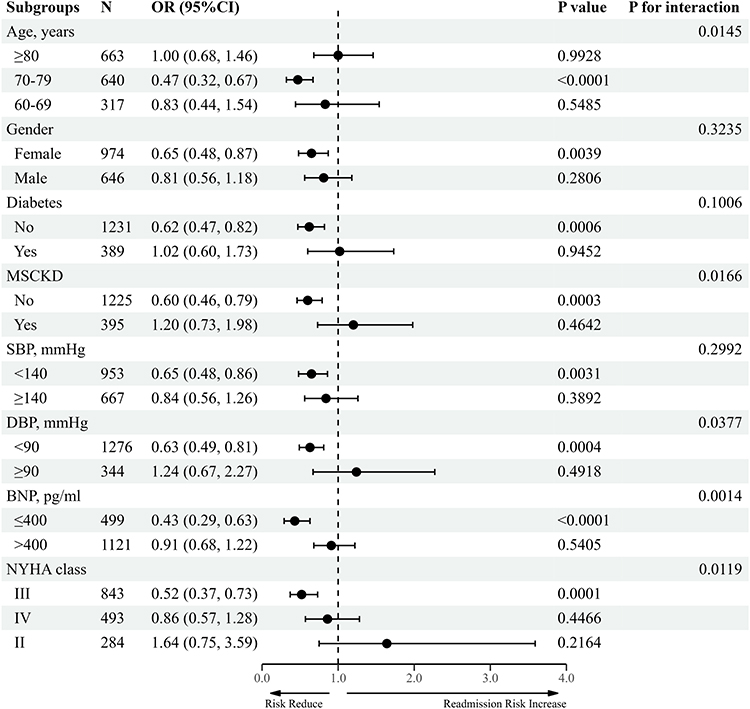 |
Figure 2 The association between Hb/RDW-SD and the risk of HF readmission within 3-month in various subgroups. Notes: Above model adjusted for age, gender, occupation, MSCKD, SBP, DBP, type of HF, diabetes, creatinine, urea, GFR, albumin, potassium, sodium, BNP, total bilirubin, NYHA class, presence of LVEF. In each case, the model is not adjusted for the stratification variable. |
Sensitivity Analysis
As can be seen in Supplemental Table 4, there is no missing data for the dependent variable. However, some of the other variables had missing data. For example, urea was missing in 21 cases, GFR 57 cases, RDW-SD 25 cases, Hb 23 cases, and total bilirubin 89 cases. To verify the stability of the data analysis, we employed MI based on five replications using a chained equation technique in the R MI procedure. Supplemental Table 5 shows a comparison of the population descriptions of the original data and the five sets of data made by interpolation. As can be seen from Supplemental Table 5, there is no statistical difference between the original data and the interpolated 5 sets of data for all the variables (P > 0.9). Supplemental Table 6 shows the variability of the data before and after MI for the multivariate analysis. The combined values of the effect values for the five sets of data generated by MI were approximately the same as the effect values for the three sets of models before interpolation. Supplemental Figure 1 shows that the trends of the smoothing curves for each of the six data sets are also approximately the same.
Discussion
Our study showed a negative relationship between Hb/RDW-SD and HF readmission within 3 months after adjusting for other covariates. Besides, through GAM, our study found a nonlinear relationship between Hb/RDW-SD and HF readmission within 3 months. A two-piecewise linear regression model found two inflection points at 1.78 and 2.17. Both Hb/RDW-SD < 1.78 and Hb/RDW-SD > 2.17 showed a significant negative correlation between Hb/RDW-SD and HF 3-month readmission. Subgroup analysis found that effect sizes were generally consistent across subgroups and consistent with the primary outcome of this study.
The global incidence and prevalence of heart failure is approaching an epidemic, as evidenced by rising HF hospitalizations, rising deaths, and rising costs associated with patient care. Globally, HF affects nearly 23 million people. In the United States, the latest epidemiological data indicates that 5.7 million Americans suffer from HF. It is estimated that by 2030, the prevalence will increase by 25% from current estimates.26 The estimated overall prevalence of symptomatic HF in the European population is similar to that in the United States, ranging from 0.4% to 2%.27 As China is the largest developing country in the world and will soon enter into an aging society, this value will only be higher, and the clinical pressure of managing HF patients will be heavier. From this perspective, it is very valuable to effectively identify and intervene in the risk factors of readmission in patients with HF after discharge. Timely intervention may prevent volume overload and readmissions in HF patients, and at least some HF readmissions appear to be avoidable.28
To our knowledge, this is the first use of Hb/RDW-SD to explore its association with HF readmission in a Chinese elderly population. The Hb/RDW-SD ratio combines information from both routine blood tests to measure the prognostic aspects of HF, which are readily available. Studies have shown that hemoglobin is an important predictor of HF prognosis. Low hemoglobin is common in HF patients and is often associated with poor clinical status and poor prognosis.29 Hemoglobin is a marker that can reflect the severity of HF, which can reflect malnutrition and inflammation in the body. However, the activation of proinflammatory cytokines observed in HF patients may have multiple deleterious consequences.5 RDW-SD is a quantitative measure of cellular heterogeneity independent of MCV and more accurately reflects changes in red blood cell size.12 The study by Felker et al found that higher red cell distribution width was associated with worse prognosis in HF.6 RDW-SD is usually elevated in the presence of ineffective erythropoiesis (eg, folate deficiency, iron deficiency) and increased red blood cell destruction (eg, hemolysis). Conceivably, RDW-SD may represent multiple pathological processes in HF (eg, nutritional deficiencies, inflammation) that could explain its association with clinical outcomes in HF. HF is not a single disease but a clinical syndrome with diverse manifestations. Thus, the pathophysiology of HF is complex and highly variable, with many overlapping pathogenic mechanisms that vary in importance. In patients with normal cardiac structure and function, substantial damage to the heart (eg, acute myocarditis) is required to cause clinical manifestations of HF. In patients with abnormal cardiac structure and function at baseline, minor changes (eg, atrial fibrillation or ischemia) may contribute to the onset of HF. Various “amplification mechanisms” persist and contribute to myocardial decompensation regardless of baseline cardiac conditions. These mechanisms include neurohormonal and inflammatory activation, among others. Taken together, we can see that hemoglobin, as well as RDW-SD, appears to be consistently on track with multiple “amplification mechanisms” impacting HF prognosis. This is exactly what we wanted to explore the relevance of Hb/RDW-SD ratio to HF readmission within 3 months.
Our study has a number of strengths. First, we not only used a generalized linear model to explore the linear relationship between Hb/RDW-SD and HF 3-month readmission, but we also used a generalized additive model to explore the nonlinear relationship between them. GAM has unique advantages in exploring the nonlinear relationship between exposure variables and dependent variables; it can not only handle nonparametric smoothing problems but also fit data through regression splines. Using GAM can help us better explore the true relationship between exposure and dependent variables. Second, this is an observational study, in which there are inevitably some confounding factors, so we screen and adjust the confounding factors through strict statistics, so as to reduce the impact of confounding factors on the results as much as possible. Third, by using effect modifier factor analysis, the data from this study can be used more fully. Subgroup analysis found a significantly stronger negative correlation between Hb/RDW-SD in people aged 70 to 79 years, without MSCKD, DBP < 90, BNP ≤ 400, and NYHA class III. Fourth, we performed sensitivity analysis by multiple interpolation. The interpolated five data sets did not differ from the original in terms of population description. In addition, the validation was also performed before and after interpolation on the generalized linear model, GAM, and smoothing curve, respectively, and the results were shown to be stable.
Patients with HF still have a high risk of readmission within 3 months after discharge. Therefore, prevention of readmission has been a focus of attention. As noted above, timely intervention in patients with HF can prevent readmissions, and at least some HF readmissions appear to be avoidable.28 A systematic evaluation showed that a quarter or more of the readmissions could have been avoided.30 Our study found that patients with HF had a reduced risk of readmission when Hb/RDW-SD < 1.78 and Hb/RDW-SD > 2.17. However, this characteristic was not found in those who were in the range of 1.78 to 2.17. Specifically, as seen in Figure 1, a large number of people are in the interval 1.78 to 2.17, suggesting that interventions for this population are necessary. Since Hb as well as RDW-SD are two very easily available indicators, they are very beneficial for the prognostic management of HF. Through this study, clinicians can be guided to keep the Hb/RDW-SD ratio of HF patients below 1.78 or above 2.17 as much as possible in the prognostic management and follow-up of HF. For patients in the range of 1.78 to 2.17, intensive intervention, follow-up, and guidance are necessary. It is conceivable that with the cooperation of physicians as well as patients, the risk of HF readmission can be improved to some extent, thus reducing the medical burden on the whole society.
Several limitations of the study should be mentioned. First, our findings may not be suitable for generalization to other populations, as the population included in this study included only the elderly population residing in Zigong, Sichuan Province, China. Second, some of the variables in our data have missing data, which may cause some bias in the results. However, we used multiple interpolation for validation, and the results showed that the results of this study were stable Third, due to the fact that our study is an observational study, we cannot exclude the effect of unmeasured confounding on the results. Large-scale clinical trials and mechanistic studies are needed to validate our findings. Fourth, some variables like valvular disease and the etiology of heart failure are missing, so it is hoped that they will be included in future studies.
Conclusions
Hb/RDW-SD is negatively associated with HF 3-month readmission. The relationship between Hb/RDW-SD and HF 3-month readmission is also non-linear. Both Hb/RDW-SD < 1.78 and Hb/RDW-SD > 2.17 were strong negatively associated with HF 3-month readmission.
Data Sharing Statement
Publicly available datasets were analyzed in this study. This data can be found here: https://doi.org/10.13026/8a9e-w734.
Ethics Statement
The studies involving human participants were reviewed and approved by the Ethics Committee of Zigong Fourth People’s Hospital. Written informed consent for participation was not required for this study in accordance with the national legislation and the institutional requirements.
Acknowledgments
The authors want to express their sincere gratitude to the creators and maintainers of this database. Moreover, we gratefully thank Pro. Changzhong Chen and Dr. Xinglin Chen of the Department of Epidemiology and Biostatistics, X&Y solutions Inc. in Boston for their contribution to the statistical support.
Funding
There is no funding to report.
Disclosure
The authors report no conflicts of interest in this work.
References
1. Benjamin EJ, Muntner P, Alonso A, et al. Heart disease and stroke statistics—2019 update: a report from the American heart association. Circulation. 2019;139(10):e56–e528. doi:10.1161/CIR.0000000000000659
2. Wei N, Sun D, Huang W. Effects of WeChat use on the subjective health of older adults. Front Psychol. 2022;13. doi:10.3389/fpsyg.2022.919889
3. Khera R, Dharmarajan K, Krumholz HM. Rising mortality in patients with heart failure in the United States. JACC Heart Fail. 2018;6(7):610–612. doi:10.1016/j.jchf.2018.02.011
4. Horwich TB, Fonarow GC, Hamilton MA, MacLellan WR, Borenstein J. Anemia is associated with worse symptoms, greater impairment in functional capacity and a significant increase in mortality in patients with advanced heart failure. J Am Coll Cardiol. 2002;39(11):1780–1786. doi:10.1016/s0735-1097(02)01854-5
5. Anand IS, Gupta P. Anemia and iron deficiency in heart failure. Circulation. 2018;138(1):80–98. doi:10.1161/CIRCULATIONAHA.118.030099
6. Felker GM, Allen LA, Pocock SJ, et al. Red cell distribution width as a novel prognostic marker in heart failure. J Am Coll Cardiol. 2007;50(1):40–47. doi:10.1016/j.jacc.2007.02.067
7. Cift A, Yucel MO. Comparison of inflammatory markers between Brucella and non-Brucella epididymo-orchitis. Int Braz J Urol. 2018;44(4):771–778. doi:10.1590/s1677-5538.ibju.2018.0004.0
8. Zhang Z, Xu X, Ni H, Deng H. Red cell distribution width is associated with hospital mortality in unselected critically ill patients. J Thorac Dis. 2013;5(6):730–736. doi:10.3978/j.issn.2072-1439.2013.11.14
9. Duchnowski P, Hryniewiecki T, Kuśmierczyk M, Szymański P. Anisocytosis predicts postoperative renal replacement therapy in patients undergoing heart valve surgery. Cardiol J. 2020;27(4):362–367. doi:10.5603/CJ.a2019.0020
10. Sun P, Zhang F, Chen C, et al. The ratio of hemoglobin to red cell distribution width as a novel prognostic parameter in esophageal squamous cell carcinoma: a retrospective study from southern China. Oncotarget. 2106;7(27):42650–42660. doi:10.18632/oncotarget.9516
11. Qu J, Zhou T, Xue M, et al. Correlation analysis of hemoglobin-to-red blood cell distribution width ratio and frailty in elderly patients with coronary heart disease. Front Cardiovasc Med. 2021;8:728800. doi:10.3389/fcvm.2021.728800
12. Hoffmann JJML, Nabbe KCAM, van den Broek NMA. Effect of age and gender on reference intervals of red blood cell distribution width (RDW) and mean red cell volume (MCV). Clin Chem Lab Med. 2015;53(12):2015–2019. doi:10.1515/cclm-2015-0155
13. Hoffmann JJML. Red cell distribution width and mortality risk. Clin Chim Acta. 2012;413(7–8):824–825. doi:10.1016/j.cca.2012.01.010
14. Lippi G, Pavesi F, Bardi M, Pipitone S. Lack of harmonization of red blood cell distribution width (RDW). Evaluation of four hematological analyzers. Clin Biochem. 2014;47(12):1100–1103. doi:10.1016/j.clinbiochem.2014.06.003
15. Goldberger AL, Amaral LAN, Glass L, et al. PhysioBank, PhysioToolkit, and PhysioNet. Circulation. 2000;101(23):E215–E220. doi:10.1161/01.cir.101.23.e215
16. Zhang Z, Cao L, Chen R, et al. Electronic healthcare records and external outcome data for hospitalized patients with heart failure. Sci Data. 2021;8(1):46. doi:10.1038/s41597-021-00835-9
17. Ponikowski P, Voors AA, Anker SD, et al. 2016 ESC guidelines for the diagnosis and treatment of acute and chronic heart failure. Eur J Heart Fail. 2016;18(8):891–975. doi:10.1002/ejhf.592
18. von Elm E, Altman DG, Egger M, Pocock SJ, Gøtzsche PC, Vandenbroucke JP. The Strengthening the Reporting of Observational Studies in Epidemiology (STROBE) statement: guidelines for reporting observational studies. Lancet. 2007;370(9596):1453–1457. doi:10.1016/S0140-6736(07)61602-X
19. Kernan WN, Viscoli CM, Brass LM, et al. Phenylpropanolamine and the risk of hemorrhagic stroke. N Engl J Med. 2000;343(25):1826–1832. doi:10.1056/NEJM200012213432501
20. Yu X, Cao L, Yu X. Elevated cord serum manganese level is associated with a neonatal high ponderal index. Environ Res. 2013;121:79–83. doi:10.1016/j.envres.2012.11.002
21. Newgard CD, Haukoos JS. Advanced statistics: missing data in clinical research-part 2: multiple imputation. Acad Emerg Med. 2007;14(7):669–678. doi:10.1111/j.1553-2712.2007.tb01856.x
22. Haukoos JS, Newgard CD. Advanced statistics: missing data in clinical research-part 1: an introduction and conceptual framework. Acad Emerg Med. 2007;14(7):662–668. doi:10.1111/j.1553-2712.2007.tb01855.x
23. Little RJ. Statistical Analysis with Missing Data. Statistics Wsipa, Editor. New York: John Wiley and Sons; 2002.
24. Su YS, Gelman A, Hill J, Yajima M. Multiple imputation with diagnostics (mi) inR: opening windows into the black box. J Stat Soft. 2011;45(2):1–31. doi:10.18637/jss.v045.i02
25. Fu Z, Zhang X, Zhao X, Wang Q. U-shaped relationship of sodium-to-chloride ratio on admission and mortality in elderly patients with heart failure. Curr Probl Cardiol. 2022;48(1):101419. doi:10.1016/j.cpcardiol.2022.101419
26. Mozaffarian D, Benjamin EJ, Go AS, et al. Heart disease and stroke statistics—2016 update. Circulation. 2016;133(4):e38–e360. doi:10.1161/CIR.0000000000000350
27. Ponikowski P, Anker SD, AlHabib KF, et al. Heart failure: preventing disease and death worldwide. ESC Heart Fail. 2014;1(1):4–25. doi:10.1002/ehf2.12005
28. van Walraven C, Bennett C, Jennings A, Austin PC, Forster AJ. Proportion of hospital readmissions deemed avoidable: a systematic review. CMAJ. 2011;183(7):E391–E402. doi:10.1503/cmaj.101860
29. Tang WHW, Tong W, Jain A, Francis GS, Harris CM, Young JB. Evaluation and long-term prognosis of new-onset, transient, and persistent anemia in ambulatory patients with chronic heart failure. J Am Coll Cardiol. 2008;51(5):569–576. doi:10.1016/j.jacc.2007.07.094
30. Fonarow GC, Abraham WT, Albert NM, et al. Association between performance measures and clinical outcomes for patients hospitalized with heart failure. JAMA. 2007;297(1):61. doi:10.1001/jama.297.1.61
 © 2023 The Author(s). This work is published and licensed by Dove Medical Press Limited. The full terms of this license are available at https://www.dovepress.com/terms.php and incorporate the Creative Commons Attribution - Non Commercial (unported, v3.0) License.
By accessing the work you hereby accept the Terms. Non-commercial uses of the work are permitted without any further permission from Dove Medical Press Limited, provided the work is properly attributed. For permission for commercial use of this work, please see paragraphs 4.2 and 5 of our Terms.
© 2023 The Author(s). This work is published and licensed by Dove Medical Press Limited. The full terms of this license are available at https://www.dovepress.com/terms.php and incorporate the Creative Commons Attribution - Non Commercial (unported, v3.0) License.
By accessing the work you hereby accept the Terms. Non-commercial uses of the work are permitted without any further permission from Dove Medical Press Limited, provided the work is properly attributed. For permission for commercial use of this work, please see paragraphs 4.2 and 5 of our Terms.