")
Back to Journals » Diabetes, Metabolic Syndrome and Obesity » Volume 15
Association of Body Composition with Pulmonary Function in Ningxia: The China Northwest Cohort
Authors Hou P , Pi Y, Jiao Z , Tian X , Hu W, Zhang Y, Zhao Y , Wang F
Received 24 July 2022
Accepted for publication 16 October 2022
Published 25 October 2022 Volume 2022:15 Pages 3243—3254
DOI https://doi.org/10.2147/DMSO.S383098
Checked for plagiarism Yes
Review by Single anonymous peer review
Peer reviewer comments 2
Editor who approved publication: Prof. Dr. Antonio Brunetti
Pengyi Hou,1,2 Yangyang Pi,1,2 Ziming Jiao,1 Xueyan Tian,1 Wenxuan Hu,1 Yuhong Zhang,1,2 Yi Zhao,1,2 Faxuan Wang1,2
1School of Public Health and Management, Ningxia Medical University, Yinchuan, People’s Republic of China; 2Laboratory of Environmental Factors and Chronic Disease Control, Ningxia Medical University, Yinchuan, People’s Republic of China
Correspondence: Faxuan Wang, Email [email protected]
Background: In recent decades, obesity has become an epidemic worldwide and is a risk factor for many chronic diseases. Lung function is also a predictor of various chronic diseases. However, research results on the association between obesity and lung function are inconsistent and few studies have evaluated the association between central obesity indicators and lung function. Therefore, this study explored the correlation between central obesity and lung function.
Methods: This study is a cross-sectional study. The basic participant characteristics were collected by questionnaire. A tape measure was used to measure waist circumference (WC) and hip circumference (HC). Body fat percentage was measured using an InBody370. Lung function parameters were measured using a digital spirometer connected to a computer (Chestgraph HI-101). R (R4.0.5) software was used for data analysis. A generalized linear model was used to analyze the association between obesity and lung function.
Results: This study found that body mass index (BMI) adjusted for WC was negatively correlated with forced vital capacity (FVC) (β=− 0.05 [− 0.06, − 0.03] in men, β=− 0.05 [− 0.07, − 0.04] in women) and forced expiratory volume in 1 s (FEV1)(β=− 0.02 [− 0.03, − 0.00] in men, β=− 0.03 [− 0.04, − 0.02] in women). Body fat percentage was negatively correlated with FVC (β=− 0.01 [− 0.01, − 0.01] in men, β=− 0.01 [− 0.01, − 0.00] in women).
Conclusion: Central obesity and combined central and general obesity were more strongly positively correlated with lung function. WC-adjusted BMI was negatively correlated with lung function. Body fat percentage was negatively correlated with lung function.
Keywords: lung function, central obesity, body mass index, waist circumference
Introduction
In recent decades, obesity has reached epidemic proportions globally and its prevalence is increasing worldwide.1 The global prevalence of obesity among adults in 2016 was 13%,2 based on world standards. In China, the estimated prevalence of obesity among adults was 16.4% from 2015 to 2019.3 Obesity is associated with many chronic diseases,4 including cardiovascular disease,5 type 2 diabetes,6 and metabolic diseases.7 Although body mass index (BMI) has been widely used to screen overweight and obese individuals, it does not accurately predict central obesity (ie, abdominal obesity).8 Abdominal obesity, a special type of obesity, is more associated with the disease than non-abdominal obesity.9 Waist circumference (WC) is a proven alternative method for defining central obesity and has a superior correlation with morbidities related to central obesity compared to BMI.10
Lung function is an objective indicator of respiratory health as well as a predictor of cardiorespiratory morbidity and mortality.11 The evaluation of lung function is primarily based on lung function tests (PFTs), which provide information about global lung function.12 PFTs measure forced expiratory volume in 1 s (FEV1) and forced vital capacity (FVC).13
Studies have reported a relationship between lung function and obesity.14–20 Most such studies have shown a relationship between lung function and central obesity and central obesity indicators.14–19 Some studies have suggested an inverse relationship between obesity and lung function.14,16,17 However, other studies have shown no or a weak association between obesity and lung function.20–22 Few studies have examined the relationship between lung function and different indicators of obesity, and these studies have been primarily based on Western populations.16,17 However, the distribution of central fat differs between Asians and Caucasians with the same BMI.23 Few studies have reported an independent association between obesity indicators and lung function.
Therefore, this study explored the relationship between obesity and lung function based on the Ningxia Cohort Study of the China Northwest Cohort. Based on these cohort data, our research group has conducted studies on lung function.24,25 The present study explored the relationship between obesity types and lung function by combining central obesity and obesity defined by BMI and analyzed the relationship between obesity indicators and lung function by combining BMI and central obesity indicators.
Methods
Study Population
This cross-sectional study obtained data from the baseline database of the China Northwest Natural Population Cohort: Ningxia Project, which was carried out in Qingtongxia City and Pingluo County of the Ningxia Hui Autonomous Region. A cluster sampling method was used to select the towns of the two cities (counties). Four towns were selected for inclusion in the study: Baofeng Town and Qukou Town in Pingluo County, and Xiakou Town and Qujing Town in Qingtongxia City. This study was approved by the Ethics Committee of Ningxia Medical University. All participants were aware of the significance of this study and provided signed informed consent.
The method for calculating the sample size of qualitative variables in cross-sectional studies was used to calculate the number of people required for this study. The calculation formula was as follows: 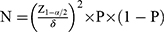
where N represents the required sample size, 1-α/2 represents the confidence, δ represents the allowable error, and P represents the overall rate. In the present study, Z was 1.96 when α was 0.05. δ was set to 1%. The prevalence of chronic obstructive pulmonary disease (COPD), used to represent the prevalence of pulmonary function decline, was 8.6% in China in 2015.26 Thus, the calculated sample size was 3020 participants. Considering a 20% loss to follow-up, the sample size for this study was 3775.
This study was conducted from April 2018 to April 2019 in a natural population of 15,802 people, among whom 5707 underwent lung function measurements. Participants with missing and outlier lung function results, missing questionnaires, lack of height and weight data, with asthma and tuberculosis, age <30 years, and BMI <18.5 kg/m2 were excluded.
Questionnaire Survey
After registering and signing the informed consent, each participant was assigned a fixed number, which was combined with the ID number as the identification for the questionnaire, physical examination, biological sample measurement, and database entry. The survey personnel comprised members of the research group, all of whom had undergone strict training and assessment. Basic epidemiological data were collected in the form of face-to-face questions and answers.
Adopting a unified semi-structured questionnaire, the data research content included personal general information, drinking tea, drinking alcohol, smoking, diet, passive smoking and indoor air pollution, personal and family health status, physical activity, female reproductive history, spirit-sleep-emotional state, and quality of life. Only general personal information (educational level, marital status, and economic status), tea consumption, alcohol consumption, smoking, fruit and vegetable intake, passive smoking, cooking, smoke extraction equipment, home heating, exercise, sleep, history of illness, and occupational exposure were considered in the analysis in this study.
The economic situation was grouped according to the annual family income in units of RMB yuan. The history of disease (diabetes, cardiovascular disease, cerebrovascular disease, hypertension, tuberculosis, chronic bronchitis, and asthma) was determined by the respondents’ self-reported experience with these diseases, definite diagnosis by hospitals at the community level or above, or taking relevant treatment drugs. The specific classification methods for the basic information of the rest of the population have been described previously by our research group.25
Obesity Indicators
After completing the questionnaire survey, height and weight were measured by qualified and experienced doctors and technicians, who instructed the participants to take off their shoes and hats, wear light clothes, and stand at attention on the scale. To ensure the accuracy of the physical examination measurements, a daily maintenance routine was performed according to the requirements of different instruments. A tape measure was used to determine the waist circumference (WC) and hip circumference (HC). Body fat percentage was measured using an InBody370 instrument (Seoul, Korea).
Body mass index (BMI) was calculated by dividing the weight by the height squared. The waist-to-hip ratio (WHR) was calculated by dividing the WC by the HC, and the waist-to-height ratio (WHtR) was calculated by dividing the WC by the height. Central obesity was defined as a WC ≥90 cm in men and ≥80 cm in women. According to the classification criteria of BMI in the Chinese population, BMI <18.5 kg/m2 was defined as underweight, 18–23.9 kg/m2 was defined as normal weight, 24–27.9 kg/m2 was defined as overweight, and ≥28 kg/m2 was defined as obesity. General obesity was defined as BMI ≥28 kg/m2.
Lung Function Test
Parameters related to lung function were measured using a digital spirometer connected to a computer (Chestgraph HI-101; Chest Ltd., Tokyo, Japan), including FEV1 and FVC. The spirometer determined the predicted FEV1 and FVC values using the prediction equation. The predicted FVC and FEV1 values varied with the characteristics of the particular population (age, height, sex, and race/ethnicity). According to the recommendations of the American Thoracic Society, calibration of the spirometer was performed before each measurement according to the manufacturer’s instructions. The participants were asked to wear a nose clip and to remain seated on a chair while completing all lung function tests through their lips. Three curves were created that fit the criteria, with the best values used for the analysis. The spirometer was used according to the manufacturer’s instructions after calibration. A decline in lung function was defined as a percentage of predicted FVC (FVC% pre) <80% and FEV1/FVC of ≥70% or FEV1/FVC<70%.
Statistical Analysis
Among the basic characteristics of the study population, continuous variables were represented as means ± standard deviations, and classification variables were represented as frequencies and percentages. T-tests, one-way analysis of variance (ANOVA), and rank-sum tests were used to evaluate the differences in characteristics between two or more groups for continuous variables, including age. Chi-square tests were used to evaluate differences between two or more groups, including variables such as town, education level, marital status, income situation, tea, drinking, smoking, intake of fruits and vegetables, passive smoking, cooking, exhaust equipment, indoor heating pollution, exercise, sleep, diabetes, cardiovascular disease, cerebrovascular disease, hypertension, and history of occupational exposure. Variables were screened using stepwise regression and a logistic regression model was used to analyze the relationship between lung function decline and obesity type. Multiple linear regression was used to analyze the relationship between obesity type, obesity indicators, and lung function. In the correlation analysis between lung function and obesity type, only obesity type was included in Model 1, and all influencing factors were included in Model 2. Model 3 included age, town education level, income, tea consumption, vegetable and fruit intake, cooking, smoke exhaust equipment, exercise, and sleep. Age, township, education level, income, tea consumption, alcohol consumption, vegetable and fruit intake, cooking, smoke extraction equipment, exercise, and sleep were used to adjust the correlation analysis between lung function and obesity indicators. R software (R4.0.5) was used for data analysis. All tests were two-sided and the test level (α) was 0.05.
Results
Basic Participant Characteristics
Figure 1 shows the process for screening the research population; in the natural population of 15,802 people, 5707 completed lung function measurements. Of these, 326 participants had missing lung function indicators and outliers, 146 participants had missing questionnaires, 40 participants had asthma and tuberculosis, 68 participants had missing height and weight data, 1 participant was <30 years old, and 67 participants had a BMI <18.5 kg/m2. Therefore, this study finally enrolled 5059 participants.
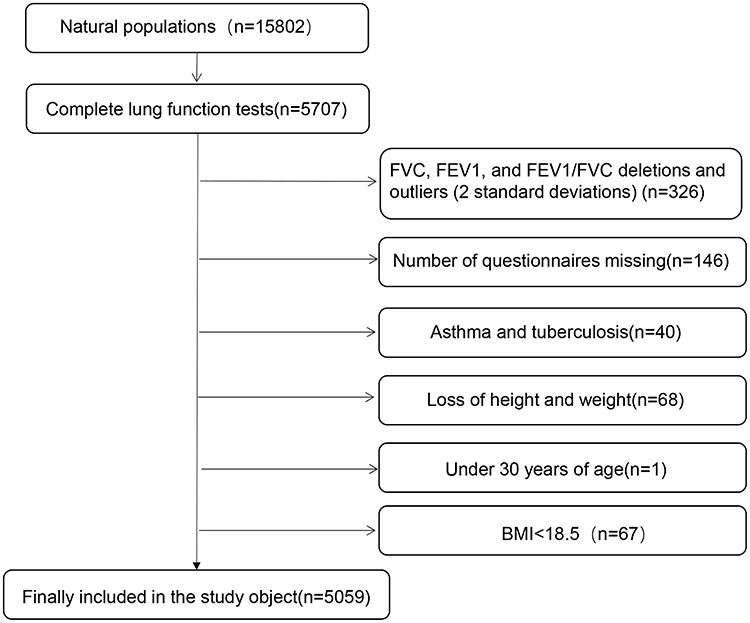 |
Figure 1 Illustrates the screening procedure of the research object population, which shows how the study object population entered the study. |
As shown in Table 1, among the included participants, 2296 were male, 1247 had a normal WC, and 1022 had central obesity. Among the 2763 female participants, 642 had a normal WC and 2121 had central obesity. Among men, the difference in mean (± standard deviation) ages of those with normal WC and central obesity differed significantly (59.01 ±8.53 years, vs 57.11 ±8.89 years, P<0.05). The number of people from town, education level, income, drinking, smoking, passive smoking, indoor heating pollution, cardiovascular disease, and hypertension also differed between men with normal WC and those with central obesity (P<0.05). In women, the mean (± standard deviation) ages of those with normal WC and central obesity were 54.01 ±8.89 years and 54.01 ±8.20 years, respectively. The number of people from town, smoke exhaust equipment, diabetes, cardiovascular disease, and hypertension differed significantly between women with normal WC and those with central obesity (P<0.05).
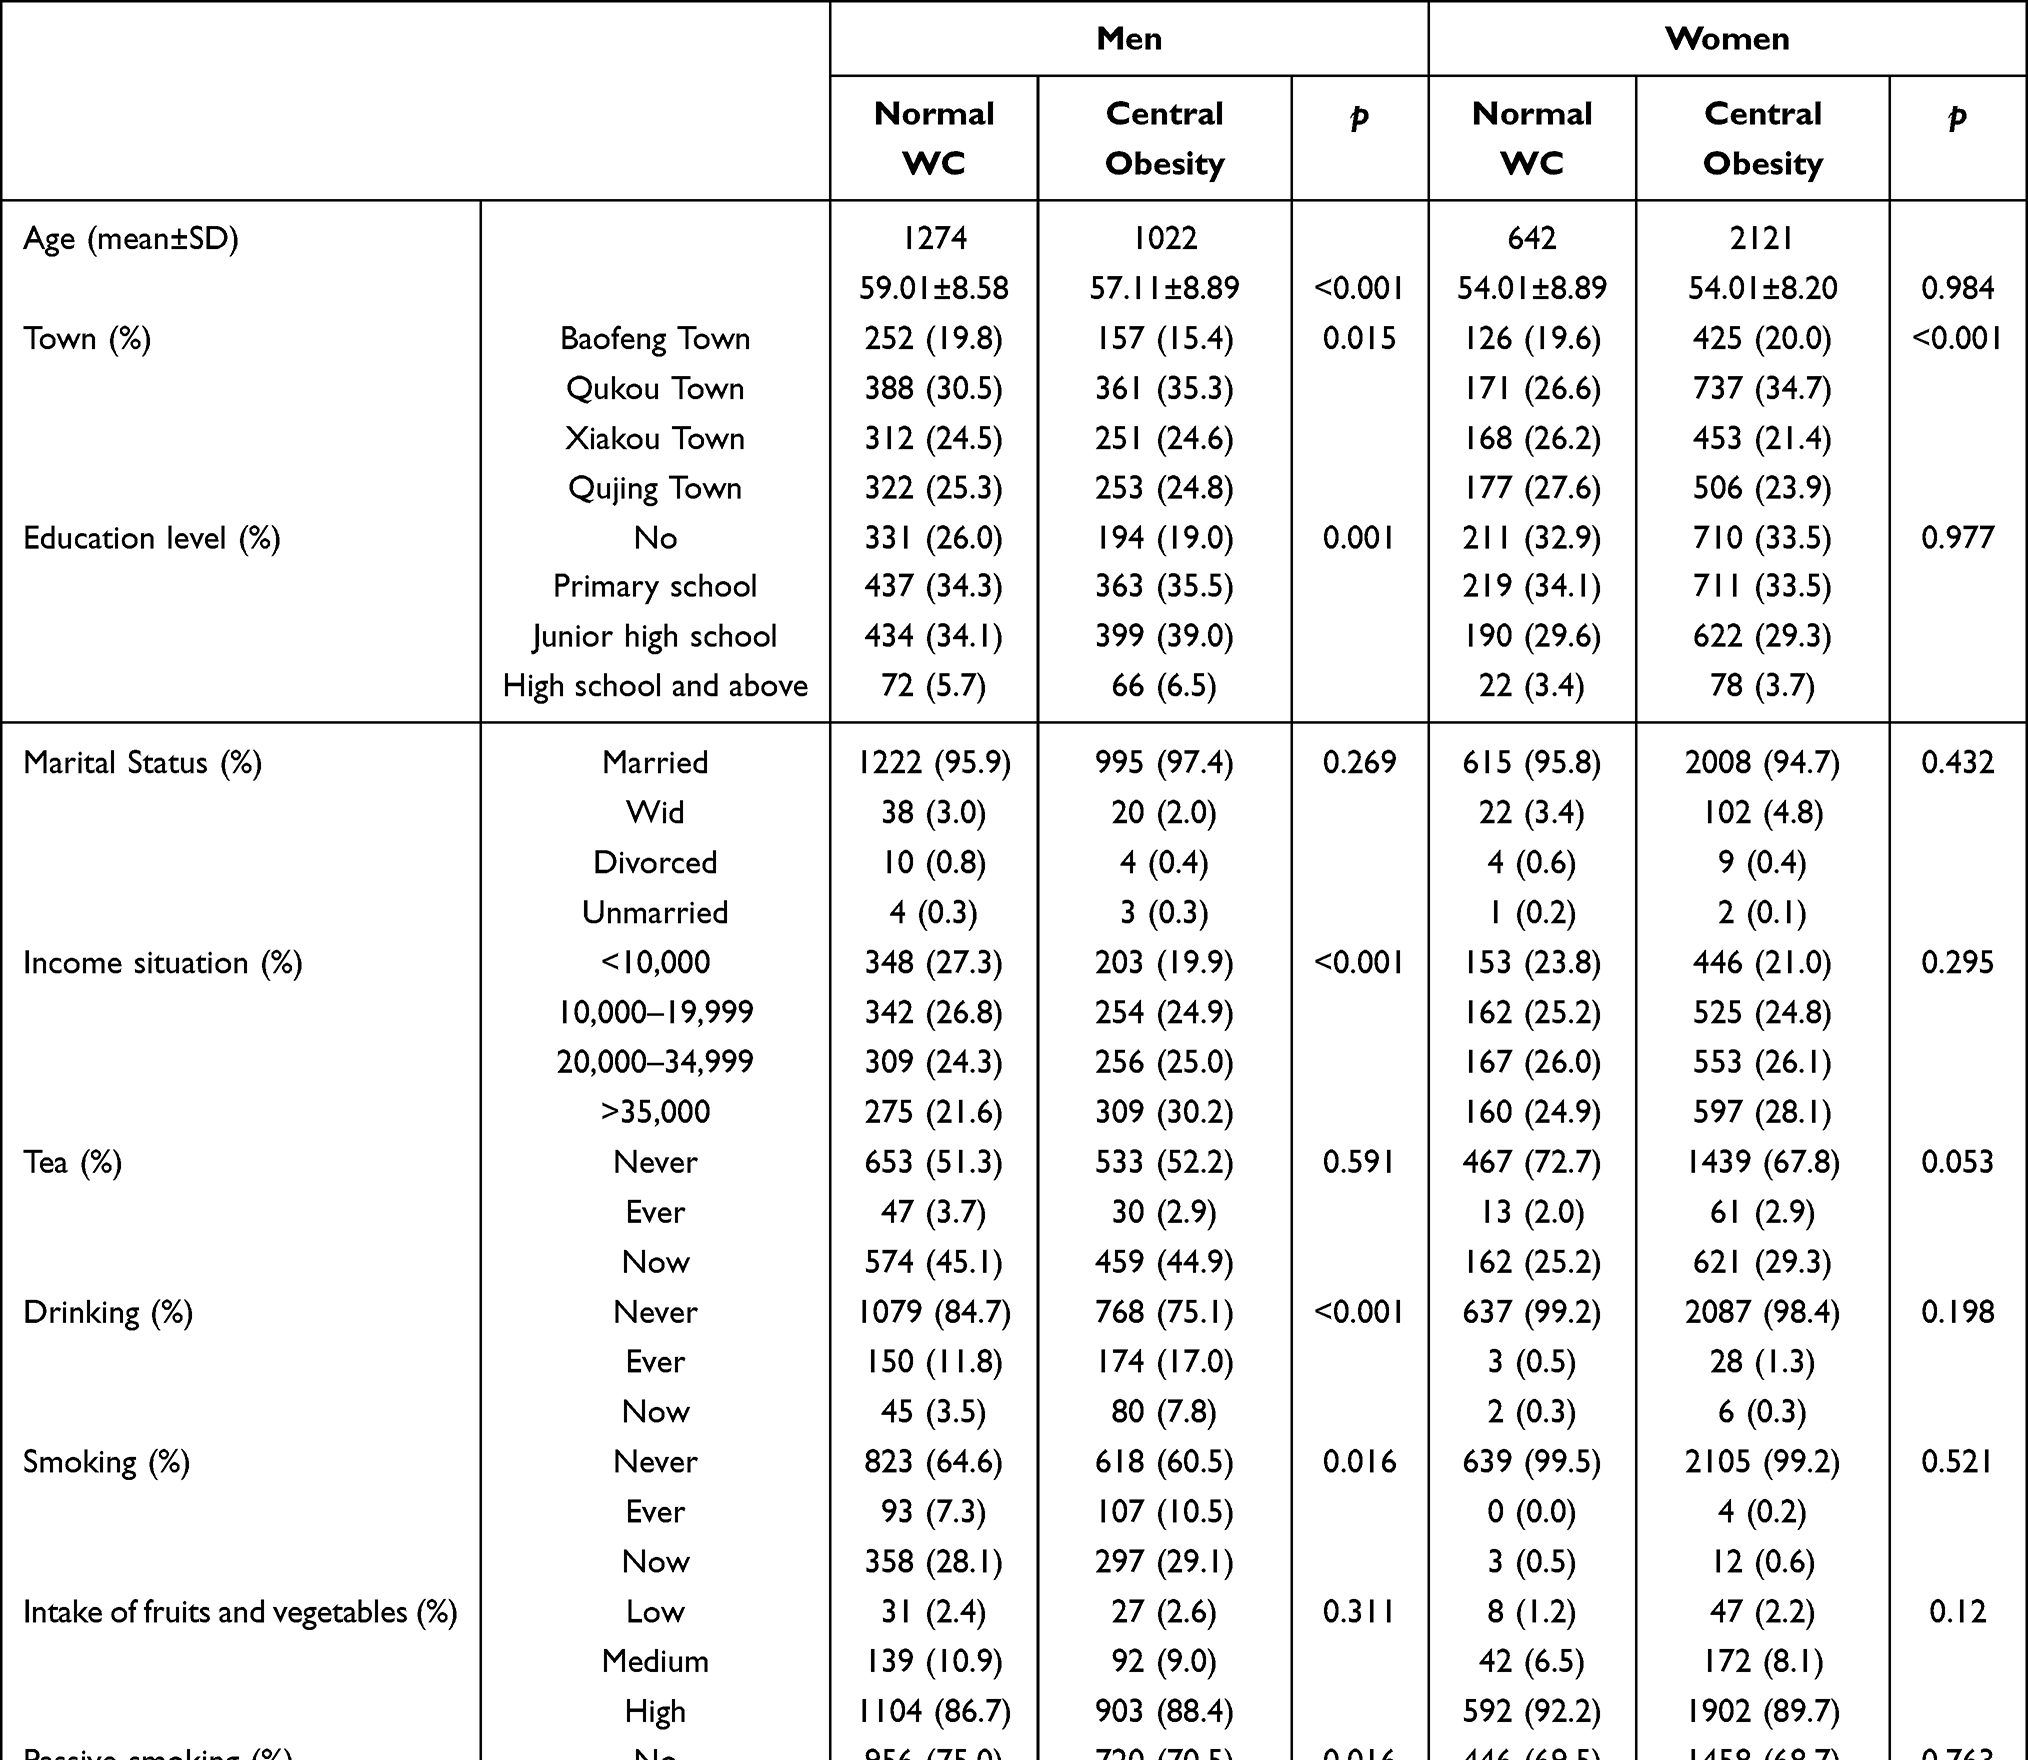 |
Table 1 Population Demographic Distribution |
Logistic Regression Analysis of Factors Influencing Lung Function Decline
Table 2 shows the results of the logistic regression analysis of the factors influencing lung function decline. In men, in the unadjusted model, compared to Baofeng town, the residents of the other three towns had higher risks of lung function decline (odds ratio [OR] (95% confidence interval [CI]) 1.79 [1.38, 2.31] in Qukou Town, 4.13 [3.07, 5.58] in Xiakou Town, and 4.55 [3.29, 6.31] in Qujing Town. P <0.05). The risk of lung function decline in men with incomes >35,000 yuan was less than that of men with incomes <10,000 yuan (OR 0.59 [0.43, 0.80], P < 0.05). In the adjusted model, compared to Baofeng town, residents of the other three towns had higher risks of lung function decline (OR 1.84 [1.37, 2.48] in Qukou Town, 4.32 [3.16, 5.93] in Xiakou Town, and 4.66 [3.27, 6.68] in Qujing Town, P< 0.05). The risk of lung function decline in men with incomes >35,000 yuan was less than that of men with incomes <10,000 yuan (OR 0.61 [0.44, 0.84], P <0.05). In women, in the unadjusted model, compared to Baofeng town, the residents of the other three towns had higher risks of lung function decline (OR 3.10 [2.41, 4.00] in Qukou Town, 10.95 [8.09, 14.92] in Xiakou Town, and 7.46 [5.51, 10.16] in Qujing Town, P < 0.05). The risk of lung function decline in women with income >35,000 yuan was less than that of women with income <10,000 yuan (OR 0.64 [0.49, 0.87], P < 0.05). Currently drinking tea was associated with a greater risk of decreased lung function compared to never having consumed tea (OR 1.32 [1.07, 1.62], P < 0.05). Cooking was associated with a lower risk of decreased lung function compared to not cooking (OR 0.61 [0.38, 0.94], P < 0.05). In the adjusted model, compared to Baofeng town, the residents of the other three towns had higher risks of lung function decline (OR 2.90 [2.29, 3.68] in Qukou Town, 10.95 [8.16, 14.80] in Xiakou Town, and 7.34 [5.53, 9.80] in Qujing Town, P < 0.05). The risk of lung function decline was lower in women with incomes >35,000 yuan compared to that of women with incomes <10,000 yuan (OR 0.63 [0.48, 0.84], P < 0.05). Currently drinking tea was associated with a greater risk of decreased lung function compared to having consumed tea (OR 1.30 [1.06, 1.60], P <0.05). Cooking was associated with a lower risk of decreased lung function compared to not cooking (OR 0.60 [0.38, 0.92], P <0.05). The risk of decreased lung function was lower for women with smoke exhaust equipment compared to that in women without smoke exhaust equipment (OR 0.78 [0.64, 0.95]). None of the models considered obesity type.
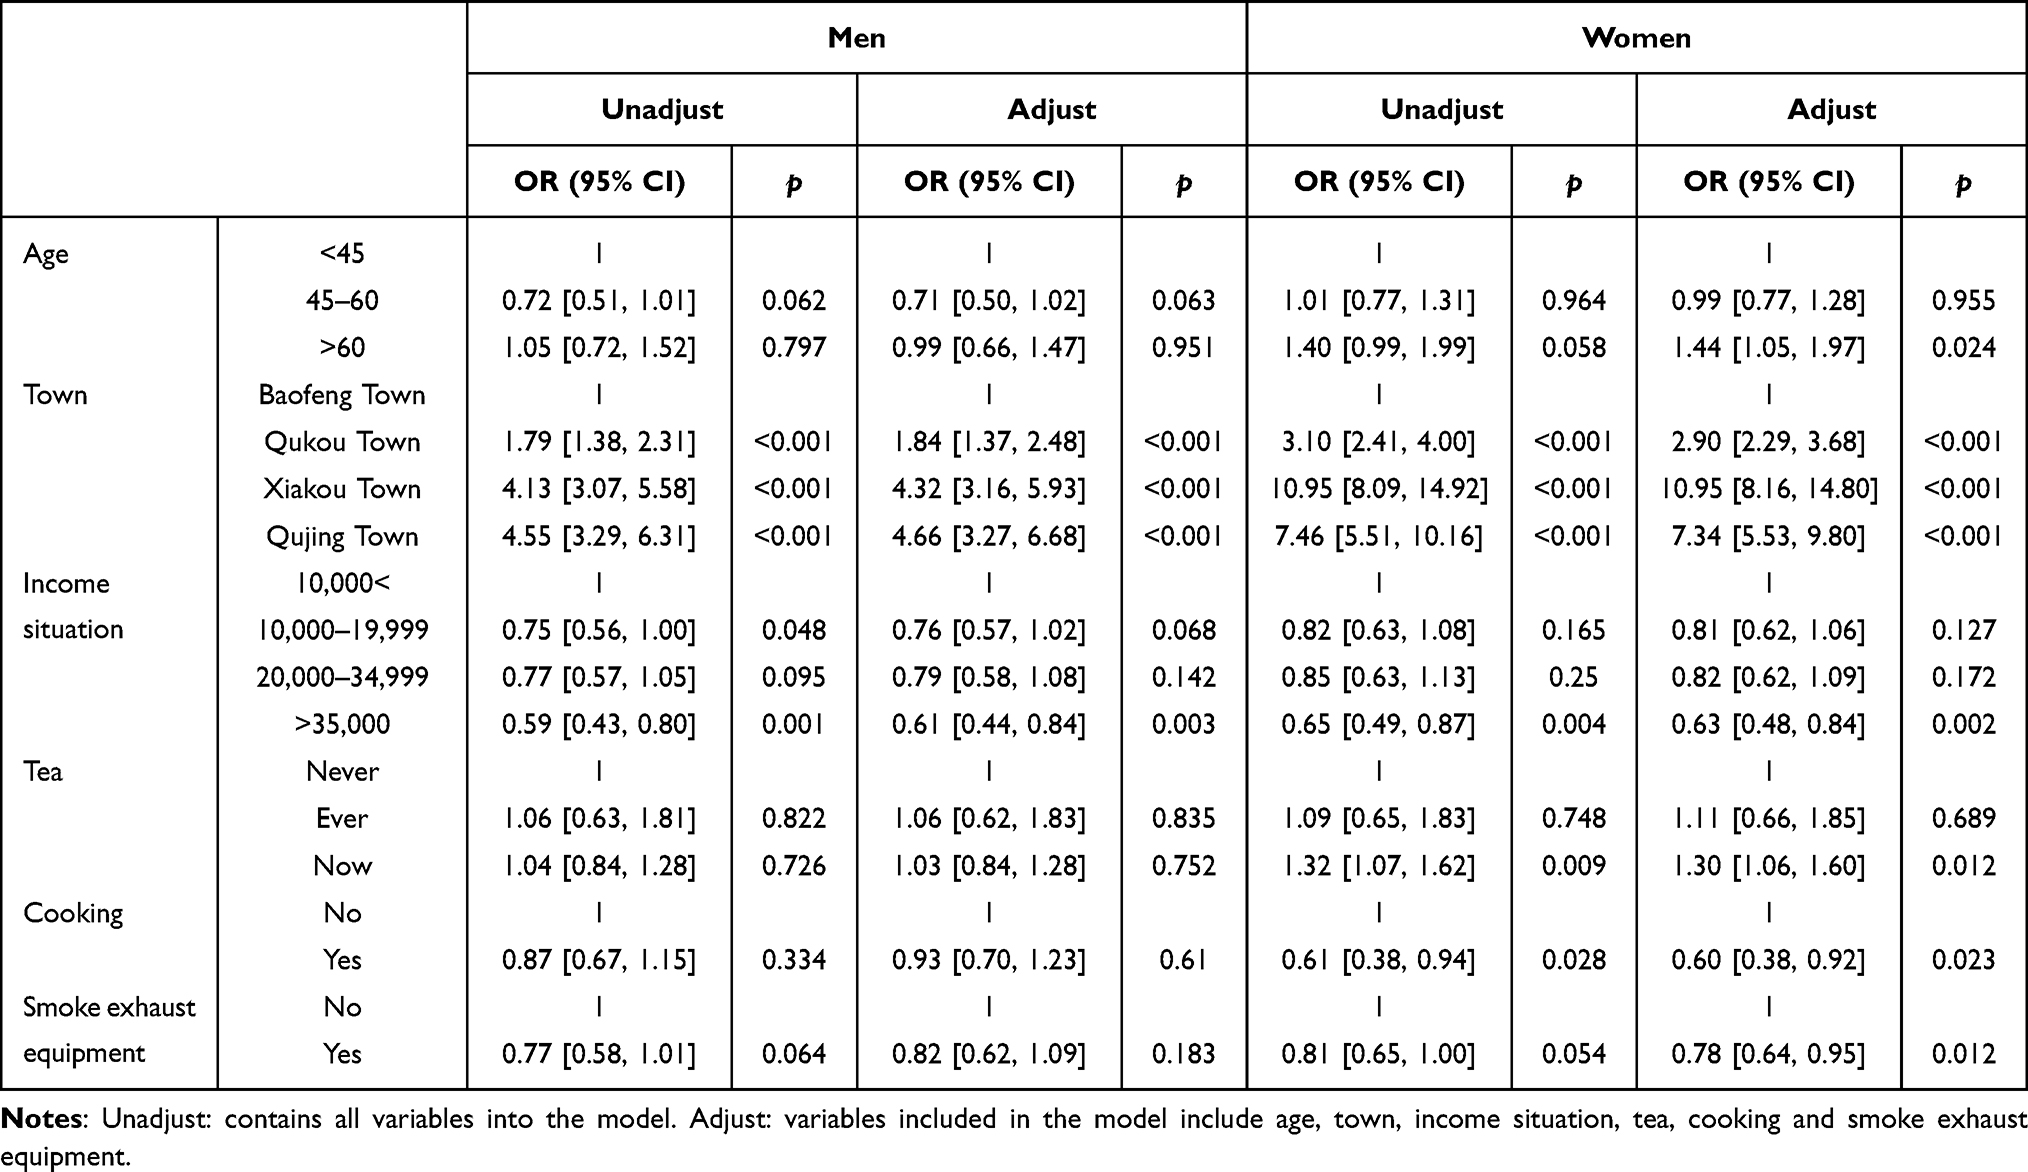 |
Table 2 Logistic Regression Analysis of Influencing Factors of Lung Function Decline |
Correlation Analysis of Obesity Type and Lung Function Indicators
Table 3 shows the results of the correlation analysis between obesity types and lung function indicators. Among men, in Model 1, the FVC of those with general obesity was lower than that of those with normal weight (β=−0.64[−1.10, −0.17], P< 0.05). The FVC was higher in men with central obesity compared to that in those with normal weight (β=0.12[0.05, 0.18], P < 0.05). The FEV1 of men with general obesity was lower than that in men with normal weight (β=−0.54[−0.92,-0.15], P < 0.05). FEV1 was higher in men with central obesity compared to that in men with normal weight (β=0.12[0.06, 0.17], P <0.05). The FEV1/FVC was higher in men with general and central obesity compared to that in men with normal weight (β=0.01[−0.00, 0.03], P< 0.05). In Model 2, the FVC of men with general and central obesity was lower than that in men with normal weight (β=−0.06[−0.13,-0.00], P< 0.05). FEV1 was higher in men with central obesity compared to that in men with normal weight (β=0.05[0.00, 0.09], P< 0.05). In Model 3, the FVC of men with general and central obesity people was lower than that in men with normal weight (β=−0.06[−0.13,-0.00], P < 0.05). FEV1 was higher in men with central obesity than that in men with normal weight (β=0.05[0.00, 0.09], P < 0.05). Among women, in all models, FVC and FEV1 were higher in those with central obesity than in those with normal weight (β0.08 to 0.12, P < 0.05). FVC and FEV1 were higher in women with general and central obesity compared to women with normal weight (β 0.06 to 0.11, P < 0.05).
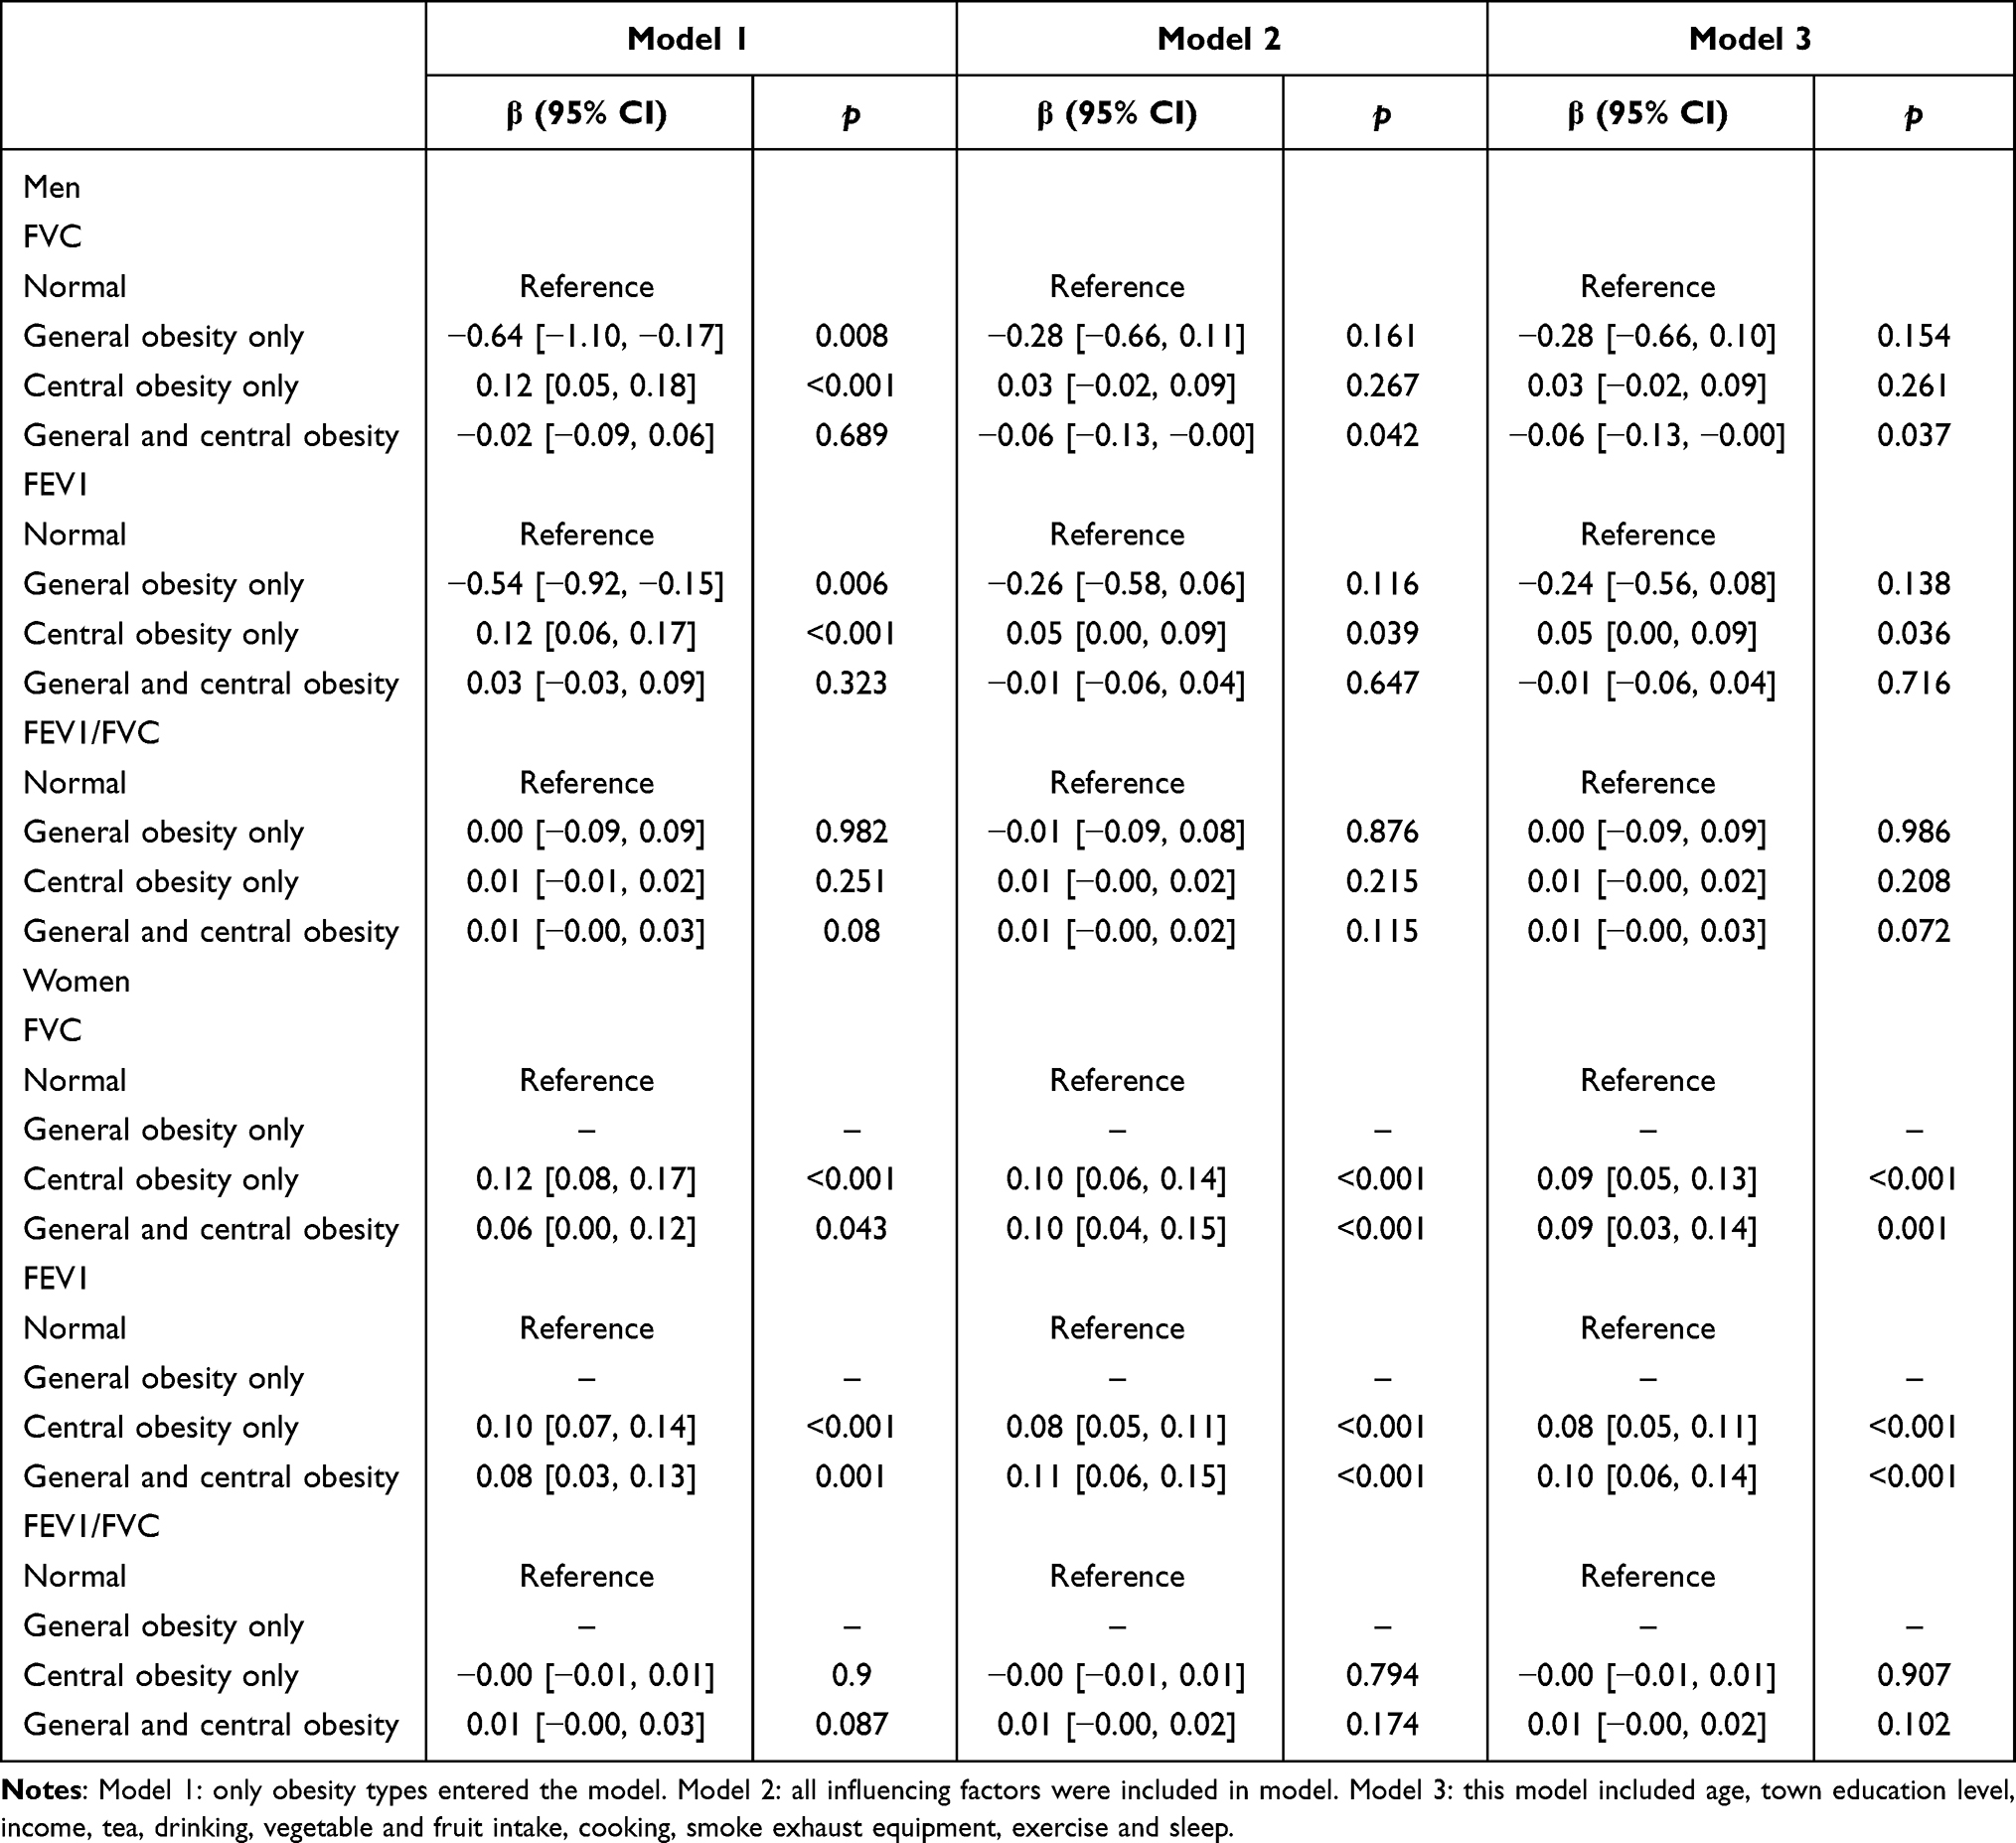 |
Table 3 Correlation Analysis of Obesity Type and Lung Function Index |
Correlation of Obesity and Lung Function Indicators
Table 4 shows the results of the correlation analyses between obesity and lung function indicators. In men, BMIb, WHtR, and body fat percentage were negatively correlated with FVC (β −0.63 to −0.01, P < 0.05). WCa was positively correlated with FVC (β=0.01 [0.01, 0.02], P < 0.05) and FEV1 (β=0.01 [0.00, 0.01], P < 0.05). BMIb and body fat percentage were negatively correlated with FEV1 (β-0.02 to −0.00, P <0.05). The correlation between WC and FEV1 was weak. BMIb and WHtR were positively correlated with FEV1/FVC (β0.01 to 0.15, P < 0.05). A weak correlation was observed between WC, WCa, BMI, and body fat percentage and FEV1/FVC. In women, WC, WCa, and WHR were positively correlated with FVC (β 0.01 to 0.80, P < 0.05). BMIb and body fat percentage were negatively correlated with FVC (β −0.05 to −0.00, P < 0.05). WC, WCa, BMI, WHR, and WHtR were positively correlated with FEV1 (β 0.01 to 0.69, P < 0.05). BMIb was negatively correlated with FEV1 (β=−0.03 [−0.04, −0.02], P < 0.05). BMIb and WHtR were positively correlated with FEV1/FVC (β 0.01 to 0.12, P < 0.05). A weak correlation was observed between WCa, BMI and body fat percentage, and FEV1/FVC.
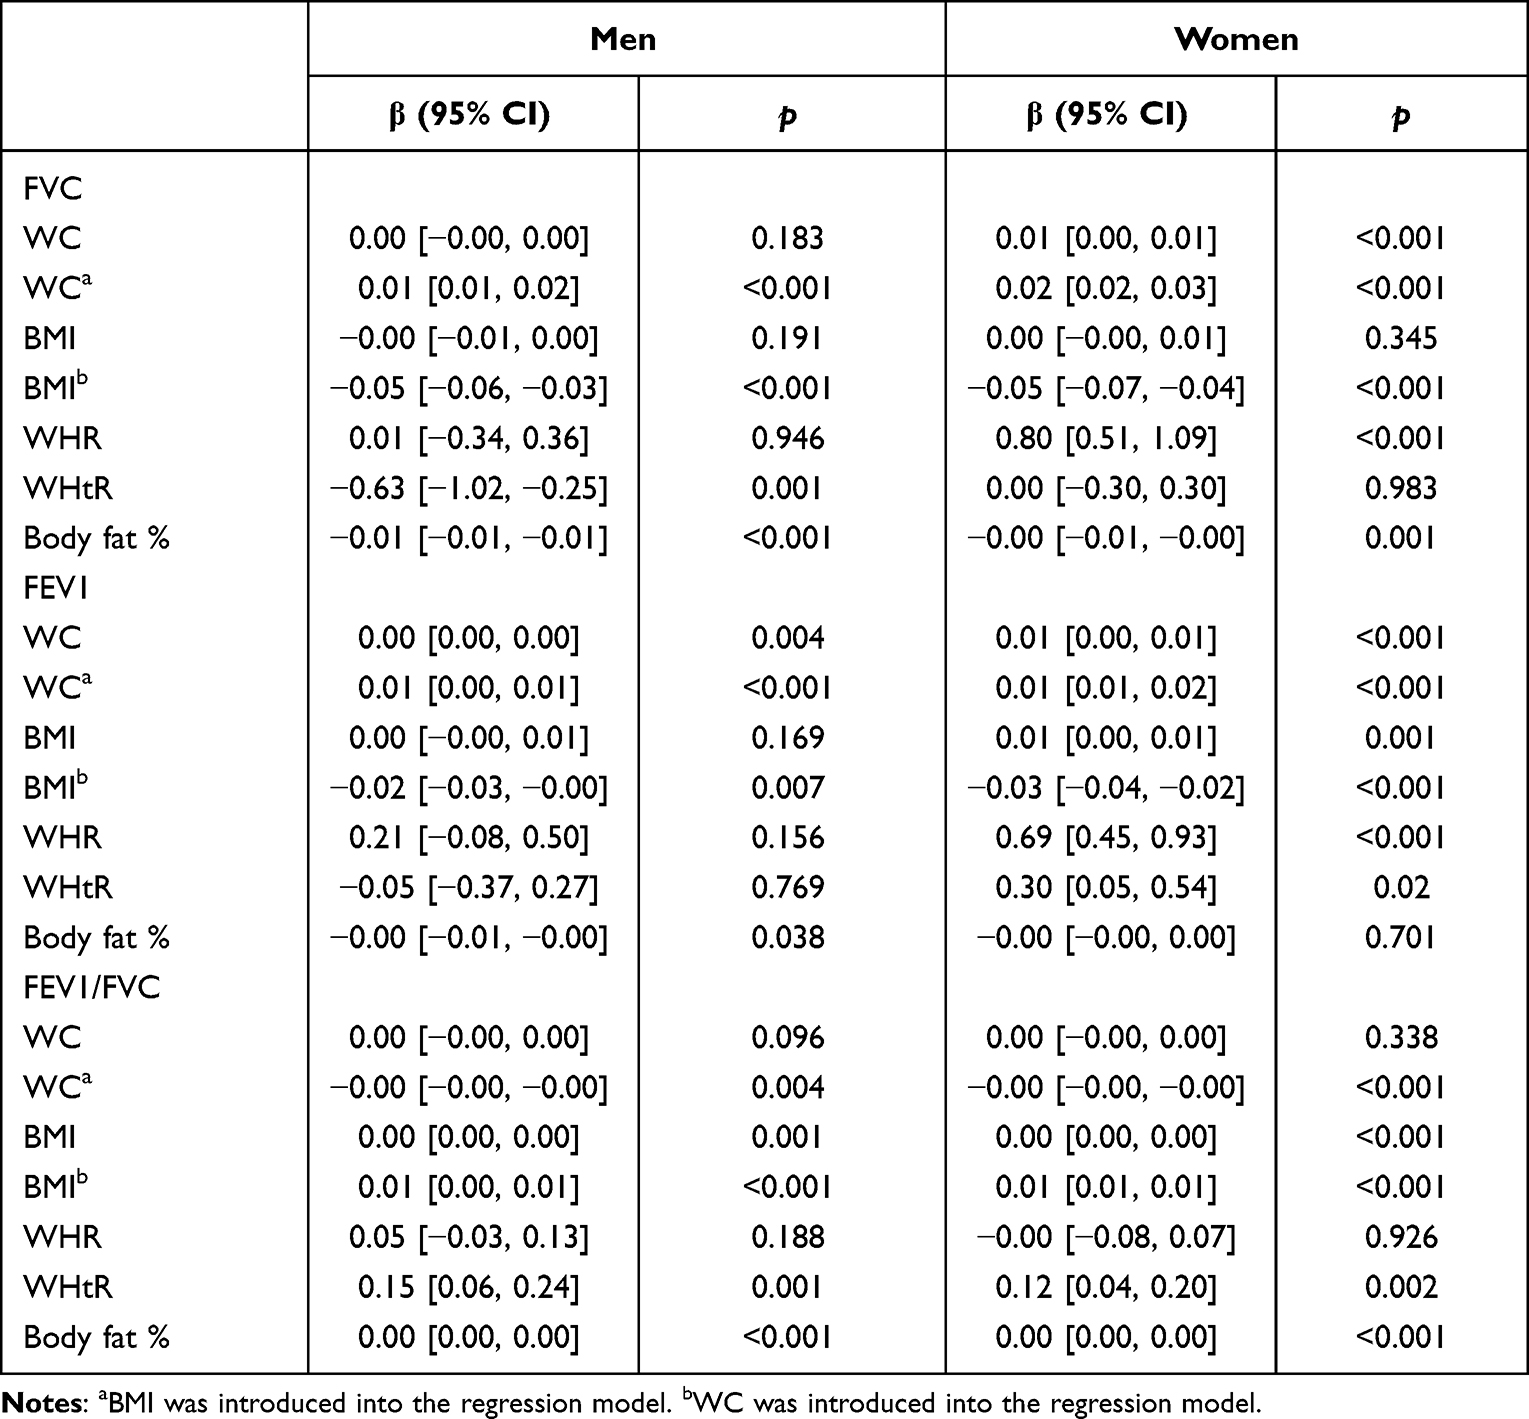 |
Table 4 Correlation Analysis of Obesity Indicators and Lung Function Indicators |
Discussion
In this study, the type of obesity was not included in the model and was not associated with reduced lung function. However, the analysis of lung function indicators and obesity types showed higher FVC and FEV1 in the group with central obesity compared to the normal population. FVC and FEV1 were also higher in women with general and central obesity, while FVC was lower in men with general obesity compared to the normal populations. In the evaluation of the correlation between central obesity indicators and lung function indicators, WC was weakly correlated with all lung function indicators. After adjusting for BMI, WC was positively correlated with FVC and FEV1 and weakly correlated with FEV1/FVC. BMI was also weakly correlated with all lung function indicators. BMI adjusted for WC was negatively correlated with FVC and FEV1 and positively correlated with FEV1/FVC. There was a weak negative correlation between body fat percentage and lung function index.
The multivariate analysis of factors affecting lung function showed a lower risk of lung function decline at a high economic level, which is consistent with previously reported results.27 Women aged > 60 years are at greater risk of declining lung function, and studies have shown that healthy non-smokers begin to lose lung function with age, starting at age 30.28,29 In the present study, women who drank tea had a greater risk of reduced lung function compared to that in women who did not, contrary to previous findings.30 This difference may be related to the frequency of tea consumption and the type of tea consumed.
Previous studies showed that both central and general obesity were negatively associated with pulmonary function.14 However, in the present study, most of the correlations between lung function and obesity classification were positive or non-relevant, with only a few indicators showing negative correlations. Compared to previous studies,14 the results of the present study showed contrary correlations. In the present study, WC and BMI-adjusted WC showed weak positive correlations with lung function. However, a review showed that WC was negatively correlated with FEV1 and FVC.15 Central obesity was defined by WC. The mechanism by which central obesity affects lung function may be that it restricts the movement of the diaphragm, thus limiting the respiratory function of the lung,31 leading to decreased lung function. Another possible mechanism is a decrease in functional surplus capacity due to increased loading of adipose tissue in the thorax, abdomen, and surrounding viscera.32 The discordant results in this study may be due to factors not included in the study, including social and environmental factors. The contrary results might also be caused by selection bias. In this study, the number of obesity types in groups was quite different, and there was no general obesity group among women. The evidence for the correlation between BMI, FEV1, and FVC is complex, with no definite conclusions.14,21,33,34 One study reported an inverted U-shaped relationship,33 some studies showed negative14 or no and even positive21,34 relationships; however, none of these studies had adjusted for WC. The BMI results in the present study showed a pattern similar to that of a previous study.21 While there was no correlation between BMI and lung function indicators, after adjusting for WC, a negative correlation between BMI, FVC, and FEV1 was observed. Although some obesity indicators in this study were positively correlated with lung function, the body fat percentage was negatively correlated with lung function. Studies have shown that fat distribution and quality significantly impact lung function.35 The relationship between obesity and lung function may be influenced by the distribution of receptor lipids.15
Our study had several strengths. First, to clarify the independent effects of different obesity indexes on lung function, we conducted mutual adjustment for BMI and WC, which was rarely performed in previous studies. Second, the measurement of the obesity index was more comprehensive. Third, we excluded underweight participants as they could have underlying diseases, for which the mechanisms and relationships with lung function could be different and complex. Pooling this population with normal-weight people as a reference group could lead to unclear results; however, few studies have excluded the underweight population.14,34,36 Fourth, group analysis was conducted according to sex, as studies have reported differences in body fat between sexes.37
However, this study has some limitations. First, the data in this study were from a cohort population, but only analyzed cross-sectional data from this population. Therefore, this was a cross-sectional study, and its causal reasoning ability was not strong. Second, the size of the study was not sufficiently large and some confounding factors may not have been considered. Third, the numbers of people with general obesity and with normal WC in this study were far lower than those of the other two groups, which may lead to insufficient power to detect significant differences.
Overall, although some obesity indicators in this study showed contrary results to those reported in other studies, BMI adjusted for WC was negatively correlated with lung function indicators. Body fat percentage was also negatively correlated with lung function indicators. These findings suggest that when BMI is used to predict lung function, adjustment for WC may increase the accuracy of the results. The percentage of body fat should also be considered in relation to the effect of obesity on lung function.
Conclusion
In conclusion, among the population in this study, we found that central obesity, central obesity, and general obesity were more strongly correlated with lung function, showing a positive correlation. Among the obesity indicators, BMI adjusted for WC was negatively correlated with lung function. A weak negative correlation was observed between body fat percentage and lung function. WHR is positively associated with lung function in women.
The Novelty of the Current Study
Most studies on the association between obesity and lung function have been based on obesity as defined by BMI. This study analyzed the relationship between obesity and lung function by combining BMI and some central obesity indices. Most of the research subjects in this area are Caucasians, and there are few studies on Asian races. In this study, obesity and lung function were assessed in a population of the Ningxia Cohort Study from the China Northwest Cohort.
Data Sharing Statement
The datasets used and/or analyzed in the current study are available upon reasonable request from the corresponding authors (Faxuan Wang: [email protected]).
Ethics Approval and Consent to Participate
This study was approved by the Ethics Committee of Ningxia Medical University (No. 2018-012). All participants were provided written and oral information about the study and provided written informed consent before participating in the CNC-NX. And our study complies with the Declaration of Helsinki.
Acknowledgments
We are grateful to all the participants, physical examiners, and data collectors, without whom this study would not have been possible.
Author Contributions
FW, YuhZ, and YiZ designed the study and drafted the manuscript. FW, PH, XT, ZJ, YP, and WH were involved in the data collection. PH, ZJ, and YP conducted the preliminary data collation. PH analyzed the data, wrote the first manuscript draft, and reviewed and edited the manuscript. FW, XT, and WH reviewed the first draft of the manuscript and suggested revisions. FW reviewed and revised the manuscript Finally, all authors have read and approved the manuscript. All authors contributed to data analysis, drafting or revising the article, have agreed on the journal to which the article will be submitted, gave final approval of the version to be published, and agree to be accountable for all aspects of the work.
Funding
This work was supported by the Key Research and Development Program of Ningxia (grant number:2021BEG02026) and the National Key Research and Development Project Ningxia Cohort from the China Northwest Cohort (2017YFC0907204).
Disclosure
The authors declare that they have no competing interests.
References
1. Macis D, Aristarco V, Johansson H, et al. A novel automated immunoassay platform to evaluate the association of adiponectin and leptin levels with breast cancer risk. Cancers. 2021;13(13):3303. doi:10.3390/cancers13133303
2. Anderson MR, Shashaty MGS. Impact of obesity in critical illness. Chest. 2021;160(6):2135–2145. doi:10.1016/j.chest.2021.08.001
3. Pan XF, Wang L, Pan A. Epidemiology and determinants of obesity in China. Lancet Diabetes Endocrinol. 2021;9(6):373–392. doi:10.1016/S2213-8587(21)00045-0
4. Kan S, Li R, Tan Y, et al. Latexin deficiency attenuates adipocyte differentiation and protects mice against obesity and metabolic disorders induced by high-fat diet. Cell Death Dis. 2022;13(2):175. doi:10.1038/s41419-022-04636-9
5. Buschmann K, Wrobel J, Chaban R, et al. Body Mass Index (BMI) and its influence on the cardiovascular and operative risk profile in coronary artery bypass grafting patients: impact of inflammation and leptin. Oxid Med Cell Longev. 2020;2020:5724024. doi:10.1155/2020/5724024
6. Hackett G. Type 2 diabetes and testosterone therapy. World J Men's Health. 2019;37(1):31–44. doi:10.5534/wjmh.180027
7. Kim MH, Yun KE, Kim J, et al. Gut microbiota and metabolic health among overweight and obese individuals. Sci Rep. 2020;10(1):19417. doi:10.1038/s41598-020-76474-8
8. Pasdar Y, Moradi S, Moludi J, et al. Waist-to-height ratio is a better discriminator of cardiovascular disease than other anthropometric indicators in Kurdish adults. Sci Rep. 2020;10(1):16228. doi:10.1038/s41598-020-73224-8
9. Sheng J, Jin X, Zhu J, Chen Y, Liu X. The effectiveness of acupoint catgut embedding therapy for abdominal obesity: a systematic review and meta-analysis. Evid Based Complement Alternat Med. 2019;2019:9714313. doi:10.1155/2019/9714313
10. Hennessey DB, Bolton EM, Thomas AZ, Manecksha RP, Lynch TH. The effect of obesity and increased waist circumference on the outcome of laparoscopic nephrectomy. Adv Urol. 2017;2017:3941727. doi:10.1155/2017/3941727
11. Gehring U, Gruzieva O, Agius RM, et al. Air pollution exposure and lung function in children: the ESCAPE project. Environ Health Perspect. 2013;121(11–12):1357–1364. doi:10.1289/ehp.1306770
12. Bourhis D, Wagner L, Essayan M, et al. Normal dual isotope V/Q SPECT model for monte-carlo studies. Front Med. 2020;7:461. doi:10.3389/fmed.2020.00461
13. Lor KL, Liu CP, Chang YC, et al. Predictive modelling of lung function using emphysematous density distribution. Sci Rep. 2019;9(1):19763. doi:10.1038/s41598-019-56351-9
14. Ochs-Balcom HM, Grant BJ, Muti P, et al. Pulmonary function and abdominal adiposity in the general population. Chest. 2006;129(4):853–862. doi:10.1378/chest.129.4.853
15. Wehrmeister FC, Menezes AM, Muniz LC, Martínez-Mesa J, Domingues MR, Horta BL. Waist circumference and pulmonary function: a systematic review and meta-analysis. Syst Rev. 2012;1:55. doi:10.1186/2046-4053-1-55
16. Lazarus R, Sparrow D, Weiss ST. Effects of obesity and fat distribution on ventilatory function: the normative aging study. Chest. 1997;111(4):891–898. doi:10.1378/chest.111.4.891
17. Wannamethee SG, Shaper AG, Whincup PH. Body fat distribution, body composition, and respiratory function in elderly men. Am J Clin Nutr. 2005;82(5):996–1003. doi:10.1093/ajcn/82.5.996
18. Wei YF, Wu HD, Chang CY, et al. The impact of various anthropometric measurements of obesity on pulmonary function in candidates for surgery. Obes Surg. 2010;20(5):589–594. doi:10.1007/s11695-009-9961-0
19. Canoy D, Luben R, Welch A, et al. Abdominal obesity and respiratory function in men and women in the EPIC-Norfolk study, United Kingdom. Am J Epidemiol. 2004;159(12):1140–1149. doi:10.1093/aje/kwh155
20. Thijs W, Alizadeh Dehnavi R, Hiemstra PS, et al. Association of lung function measurements and visceral fat in men with metabolic syndrome. Respir Med. 2014;108(2):351–357. doi:10.1016/j.rmed.2013.10.003
21. Fogarty AW, Lewis SA, McKeever TM, Britton J. The association of two different measures of body habitus with lung function: a population-based study. Respir Med. 2011;105(12):1896–1901. doi:10.1016/j.rmed.2011.07.024
22. Kongkiattikul L, Sritippayawan S, Chomtho S, Deerojanawong J, Prapphal N. Relationship between obesity indices and pulmonary function parameters in obese Thai children and adolescents. Indian J Pediatr. 2015;82(12):1112–1116. doi:10.1007/s12098-015-1777-4
23. Gallagher D. Overweight and obesity BMI cut-offs and their relation to metabolic disorders in Koreans/Asians. Obes Res. 2004;12(3):440–441. doi:10.1038/oby.2004.48
24. Wang F, Tian D, Zhao Y, Li J, Chen X, Zhang Y. High-density lipoprotein cholesterol: a component of the metabolic syndrome with a new role in lung function. Evid Based Complement Alternat Med. 2021;2021:6615595. doi:10.1155/2021/6615595
25. Tian D, Chen X, Hou P, et al. Effects of exposure to fine particulate matter on the decline of lung function in rural areas in northwestern China. Environ Sci Pollut Res Int. 2022;29(10):14903–14913. doi:10.1007/s11356-021-16865-0
26. Wang C, Xu J, Yang L, et al. Prevalence and risk factors of chronic obstructive pulmonary disease in China (the China Pulmonary Health [CPH] study): a national cross-sectional study. Lancet. 2018;391(10131):1706–1717. doi:10.1016/S0140-6736(18)30841-9
27. Rębacz-Maron E, Stangret A, Teul I. Influence of socio-economic status on lung function in male adolescents in Tanzania. Adv Exp Med Biol. 2019;1150:53–67.
28. Miller MR. Structural and physiological age-associated changes in aging lungs. Semin Respir Crit Care Med. 2010;31(5):521–527. doi:10.1055/s-0030-1265893
29. Sharma G, Goodwin J. Effect of aging on respiratory system physiology and immunology. Clin Interv Aging. 2006;1(3):253–260. doi:10.2147/ciia.2006.1.3.253
30. Oh CM, Oh IH, Choe BK, Yoon TY, Choi JM, Hwang J. Consuming green tea at least twice each day is associated with reduced odds of chronic obstructive lung disease in middle-aged and older Korean adults. J Nutr. 2018;148(1):70–76. doi:10.1093/jn/nxx016
31. Biring MS, Lewis MI, Liu JT, Mohsenifar Z. Pulmonary physiologic changes of morbid obesity. Am J Med Sci. 1999;318(5):293–297. doi:10.1016/S0002-9629(15)40641-X
32. Salome CM, King GG, Berend N. Physiology of obesity and effects on lung function. J Appl Physiol. 2010;108(1):206–211. doi:10.1152/japplphysiol.00694.2009
33. Sin DD, Jones RL, Man SF. Obesity is a risk factor for dyspnea but not for airflow obstruction. Arch Intern Med. 2002;162(13):1477–1481. doi:10.1001/archinte.162.13.1477
34. Chen Y, Rennie D, Cormier YF, Dosman J. Waist circumference is associated with pulmonary function in normal-weight, overweight, and obese subjects. Am J Clin Nutr. 2007;85(1):35–39. doi:10.1093/ajcn/85.1.35
35. Maiolo C, Mohamed EI, Carbonelli MG. Body composition and respiratory function. Acta Diabetol. 2003;40(Suppl 1):S32–38. doi:10.1007/s00592-003-0023-0
36. Leone N, Courbon D, Thomas F, et al. Lung function impairment and metabolic syndrome: the critical role of abdominal obesity. Am J Respir Crit Care Med. 2009;179(6):509–516. doi:10.1164/rccm.200807-1195OC
37. Niemann MJ, Tucker LA, Bailey BW, Davidson LE. Strength training and insulin resistance: the mediating role of body composition. J Diabetes Res. 2020;2020:7694825. doi:10.1155/2020/7694825
 © 2022 The Author(s). This work is published and licensed by Dove Medical Press Limited. The full terms of this license are available at https://www.dovepress.com/terms.php and incorporate the Creative Commons Attribution - Non Commercial (unported, v3.0) License.
By accessing the work you hereby accept the Terms. Non-commercial uses of the work are permitted without any further permission from Dove Medical Press Limited, provided the work is properly attributed. For permission for commercial use of this work, please see paragraphs 4.2 and 5 of our Terms.
© 2022 The Author(s). This work is published and licensed by Dove Medical Press Limited. The full terms of this license are available at https://www.dovepress.com/terms.php and incorporate the Creative Commons Attribution - Non Commercial (unported, v3.0) License.
By accessing the work you hereby accept the Terms. Non-commercial uses of the work are permitted without any further permission from Dove Medical Press Limited, provided the work is properly attributed. For permission for commercial use of this work, please see paragraphs 4.2 and 5 of our Terms.