")
Back to Journals » Diabetes, Metabolic Syndrome and Obesity » Volume 13
Association of Apolipoprotein e2 Allele with Insulin Resistance and Risk of Type 2 Diabetes Mellitus Among an Admixed Population of Mexico
Authors Gonzalez-Aldaco K , Roman S , Torres-Reyes LA , Panduro A
Received 23 June 2020
Accepted for publication 13 August 2020
Published 6 October 2020 Volume 2020:13 Pages 3527—3534
DOI https://doi.org/10.2147/DMSO.S268329
Checked for plagiarism Yes
Review by Single anonymous peer review
Peer reviewer comments 2
Editor who approved publication: Professor Ming-Hui Zou
Karina Gonzalez-Aldaco, Sonia Roman, Luis A Torres-Reyes, Arturo Panduro
Department of Molecular Biology in Medicine, Civil Hospital of Guadalajara “Fray Antonio Alcalde”, Health Sciences Center, University of Guadalajara, Guadalajara, Jalisco, Mexico
Correspondence: Arturo Panduro
Department of Molecular Biology in Medicine, Civil Hospital of Guadalajara “Fray Antonio Alcalde” and Health Sciences University Center, University of Guadalajara, Hospital #278, Col. El Retiro, Guadalajara 44280, Jalisco, Mexico
Tel/fax +52-33-36-14-77-43
Email [email protected]
Purpose: This study aimed to analyze the association of the apolipoprotein E (ApoE) polymorphisms with type 2 diabetes mellitus (T2DM) among the admixed population of West Mexico.
Patients and Methods: ApoE genotypes were determined in 168 T2DM patients and 449 non-diabetic control subjects from the general admixed population of West Mexico. The non-diabetic subjects were stratified according to body mass index (BMI) in normal weight (n=186), overweight (n=138), and obesity (n=125). ApoE genotypes were assessed by using a TaqMan allelic discrimination assay, insulin resistance (IR) by HOMA-IR, and biochemistry with a dry chemistry assay.
Results: The rate of dyslipidemias and IR increased by BMI category among the control subjects. The greater shift in the prevalence of dyslipidemia was observed from normal weight (51.4%) to overweight (76.6%), p< 0.01. Normal weight or obese e4 allele carriers had a higher level of total cholesterol and hypercholesterolemia than non-e4 carriers. Among the T2DM patients, the e2 carriers had abnormal HOMA-IR value than the non-e2 carriers (p=0.002). Comparatively, between the T2DM patients vs non-diabetics, the e2e3 genotype or e2 allele conferred a higher risk for T2DM (adjusted OR= 2.36, 95% CI 1.28– 4.34, p=0.006 and adjusted OR=2.1, 95% Cl 1.20– 3.79, p=0.009, respectively).
Conclusion: The ApoE e2 allele was associated with IR and the risk of T2DM in subjects from the general admixed population of West Mexico.
Keywords: ApoE, obesity, dyslipidemia, nutritional transition, hepatopathogenic diet, HOMA-IR
Introduction
Type 2 diabetes mellitus (T2DM) is a complex metabolic disorder linked to a combination of genetic, clinical, and lifestyle factors. Although the global prevalence of T2DM is rapidly increasing, regional differences among populations are notable due to ethnicity and environmental risk factors.1 Among the latter, obesity and dyslipidemia are two well-established predisposing factors for T2DM.2 Currently, the United States and Mexico are the leading countries with the highest prevalence of obesity.3 A recent survey reported that more than 75.2% of the Mexican adults are overweight or have obesity, whereas 10.3% have T2DM.4 The physiopathological link between obesity and T2DM is given by the increase in body mass index (BMI) and its relationship with dyslipidemic states, including high triglyceride (TG) levels and insulin resistance (IR).5 Dyslipidemias, mainly hypertriglyceridemia (HTG), causes altered insulin action triggering IR that eventually leads to pancreatic beta-cell dysfunction and T2DM.6,7 In this context, the Mexican population presents a high incidence of HTG, hypercholesterolemia (HCHOL), and hypoalphalipoproteinemia (HALP), which has been attributed to a nutritional transition characterized by the consumption of an hepatopathogenic diet.8–10 Nonetheless, these dyslipidemias remain underdiagnosed, and data of their regional prevalence is scarce.10
On the other hand, genetic variants are known to regulate lipid concentrations. Apolipoprotein E (ApoE) is a glycoprotein that mediates the metabolism of triglyceride-rich lipoproteins.11 Three common alleles, e2, e3, and e4, differing in the amino acid substitutions at positions 112 and 158, encode the protein isoforms e2, e3, and e4, respectively. Each one is known to impact the clinical phenotype of lipoprotein profiles differentially.12 The e3 allele is related to normal lipid serum concentration, whereas the e4 allele increases total cholesterol (TC), and the e2 allele confers genetic susceptibility to HTG.11,13
It has been documented that an uneven distribution of the ApoE alleles may modify the prevalence of metabolic disorders and T2DM within populations.14 Therefore, it is not surprising that some studies have associated the e2 allele with T2DM14 while others have shown contrasting results.15–17
In Mexico, the prevalence of the ApoE alleles is heterogeneous as a result of the unequal regional distribution of the Amerindian, Caucasian, and African ancestries among the mestizo (admixed) population.18,19 In a previous study, a high prevalence of the e2 allele was reported in an urban mestizo population of West Mexico.20 However, the effect of the ApoE polymorphism on lipid profile and its potential association with T2DM remains unclear among this population. Herein, we analyzed the association of the ApoE alleles with T2DM among the admixed population of West Mexico.
Patients and Methods
Subjects
A total of 168 unrelated T2DM patients and 449 non-diabetic subjects were consecutively recruited from October 2012 to December 2016. The study was conducted at the Department of Molecular Biology in Medicine, Hospital Civil of Guadalajara “Fray Antonio Alcalde” Guadalajara, Jalisco, Mexico. The non-diabetic subjects designated as the control group were stratified according to BMI categories in normal weight (n=186), overweight (n=138), and obesity (n=125). Exclusion criteria were pregnant women and the use of lipid-lowering diet or drugs at least six months before the study.
The study protocol complied with the ethical guidelines of the Declaration of Helsinki and was approved by the Institutional Review Board of the Civil Hospital of Guadalajara, Fray Antonio Alcalde. All participants gave written informed consent before entering the study, and all participant data has been anonymized.
Biochemical Measurements
Twelve-hour fasting venous blood samples were drawn from each participant. Samples were immediately analyzed. Fasting glucose, TG, high-density lipoprotein cholesterol (HDL-c), TC, alanine aminotransferase (ALT), and aspartate aminotransferase (AST) were measured by dry chemistry in a Vitros 250 Analyzer (Ortho Clinical Diagnostic, Johnson & Johnson, Rochester, NY, USA). Low-density lipoprotein cholesterol (LDL-c) was indirectly estimated using the Friedewald formula, and very-low density lipoprotein cholesterol (VLDL-c) was calculated as TC minus (LDL-c + HDL-c). Fasting insulin was measured by an enzyme-linked immunosorbent assay (Monobind Inc, Texas, USA). Insulin resistance was estimated by the equation: HOMA-IR=fasting insulin concentration (μU/mL) x fasting glucose concentration (mg/dL)/405.21 A HOMA-IR cutoff point >2.5 was considered as IR. For quality control purposes, a human pooled serum and a commercial control serum (Ortho Clinical Diagnostics, Johnson & Johnson) was used to account for the imprecision and inaccuracy of the biochemical measurements. The intra-assay coefficient of variation (CV) of biochemical assays was measured using ten repeated determinations of the control serum in the same analytical session. The inter-assay CV% for each variable was calculated by the mean values of control sera measured in five analytical sessions.
Anthropometric Measurements
During the physical examination, BMI (kg/m2) was measured by a calibrated instrument using electric bioimpedance (InBody 3.0, Analyzer Body Composition, Biospace, Korea). BMI was stratified according to the World Health Organization classification: normal weight >18.5–24.99 kg/m2, overweight >25-29.99 kg/m2, and obesity >30 kg/m2.
Diagnostics of T2DM
Patients included in the study were diagnosed with T2DM when fasting glucose was ≥ 126 mg/dL and two-hour plasma glucose was ≥ 200 mg/dL during an oral glucose tolerance test.22
Definition of Dyslipidemia
Dyslipidemias were defined according to National Cholesterol Education Program ATP III criteria23 as follows: hypertriglyceridemia ≥150 mg/dL, hypercholesterolemia ≥200 mg/dL, hypoalphalipoproteinemia ≤40 mg/dL for men and ≤50 mg/dL for women; and high LDL-c ≥130 mg/dL.
ApoE Genotyping
Genomic DNA was extracted from peripheral blood leukocytes using a salting-out method. The ApoE genotypes were detected by TaqMan® 5ʹ allelic discrimination assay (rs429358, C_3084793_20, and rs7412, C_904973_10; Applied Biosystems, Foster, CA, USA) as previously described.24 The reactions were performed in the StepOne Plus thermocycler according to the manufacturer’s instructions. Data were analyzed with StepOne software v2.3. Genotypes were verified using positive and negative controls. Twenty percent of the samples were genotyped in duplicate, and the success rate was 100%.
ApoE Group Categories
For the analysis of the association of ApoE alleles with dyslipidemic state, the six ApoE genotypes were grouped into three ApoE categories denoted as, E2: e2e2 + e2e3 + e2e4; E3: e3e3 and E4: e3e4 + e4e4.
Statistical Analysis
ApoE genotypes frequencies were obtained by direct counting method. The Hardy-Weinberg Equilibrium (HWE) was determined using the Arlequin software version 3.1 (Berne, Switzerland). The Kolmogorov–Smirnov test was used to evaluate the normal distribution of variables. Continuous variables were expressed as median ± standard deviation (SD). One-way ANOVA was used to determine the statistical differences between quantitative variables among the ApoE genotype categories. When necessary, post hoc tests were run to assess intergroup differences according to the homogeneity of variances. Categorical variables were expressed as frequency and compared by chi-square or Fisher’s exact tests. Independent logistic regression analyzes were performed to determine the association between T2DM and ApoE polymorphisms. In each analysis, the reference allele/genotype changed according to the allele/genotype to be tested. Each regression model was adjusted by introducing the variables age, gender, and BMI as covariates during the analysis. The odds ratio (OR) was determined with a 95% confidence interval. Two-sided p-value <0.05 was considered statistically significant. Statistical analyzes were calculated with the Epi InfoTM 7.1.2.0 (Center for Disease Control and Prevention, Atlanta, USA) and IBM SPSS Statistics software version 21 for Windows (SPSS IBM, Inc. Chicago, IL, USA).
Results
Table 1 describes the clinical characteristics and biochemical profile of the study groups. T2DM patients were mainly obese, metabolically unhealthy, and with an altered hepatic profile. In comparison, the normal weight subjects presented an average biochemical profile and were younger (33.5 ± 13.1 years) than the T2DM patients. In contrast, overweight subjects were older (50 ± 16.5 years) with a mean of TG, BMI, HOMA-IR, and TC comparable to T2DM patients (p>0.05). Likewise, obese subjects had mean variables similar to T2DM patients with ALT levels above the normal range.
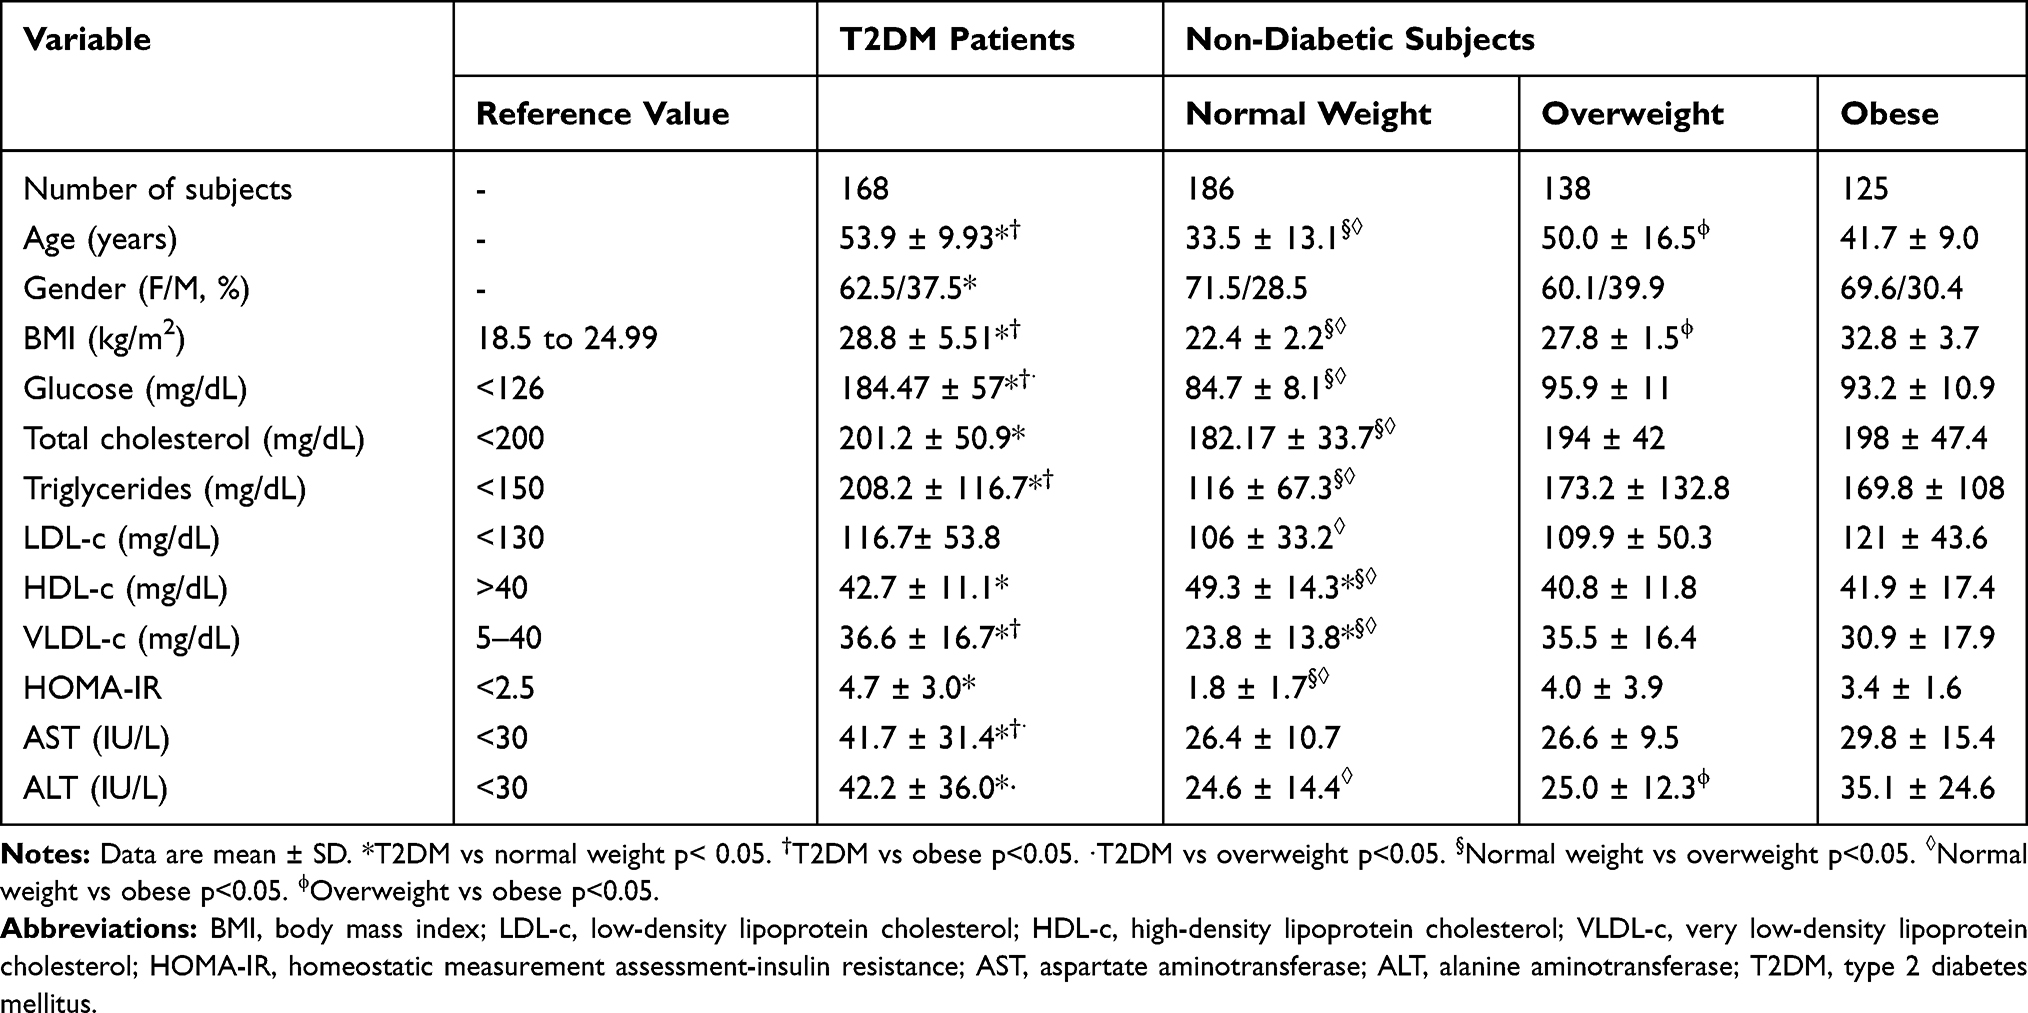 |
Table 1 Demographic and Biochemical Characteristics of Non-Diabetic Subjects and T2DM Patients |
As shown in Table 2, an overall 89.3% of the T2DM patients had some type of dyslipidemia. HTG was the most prevalent dyslipidemia (71.4%), followed by HCHOL (51.2%) and HALP (44.5%). Among the non-diabetic subjects, the prevalence of dyslipidemias increased by BMI category. Despite having normal lipid levels, 51.4% of the normal weight subjects have some type of dyslipidemia in which the most prevalent were HCHOL (30.6%), HALP (29.9%), and high LDL-c (25%). In overweight subjects, the prevalence of dyslipidemia augmented to 76.6% in which HALP (52.5%), HTG (47.4%), and HCHOL (39.7%) were the most relevant lipid alterations. Among the obese patients, the prevalence of dyslipidemia was 78.4% following the same pattern as the overweight subjects: HALP (56.6%), HTG (45.6%), and HCHOL (41.9%).
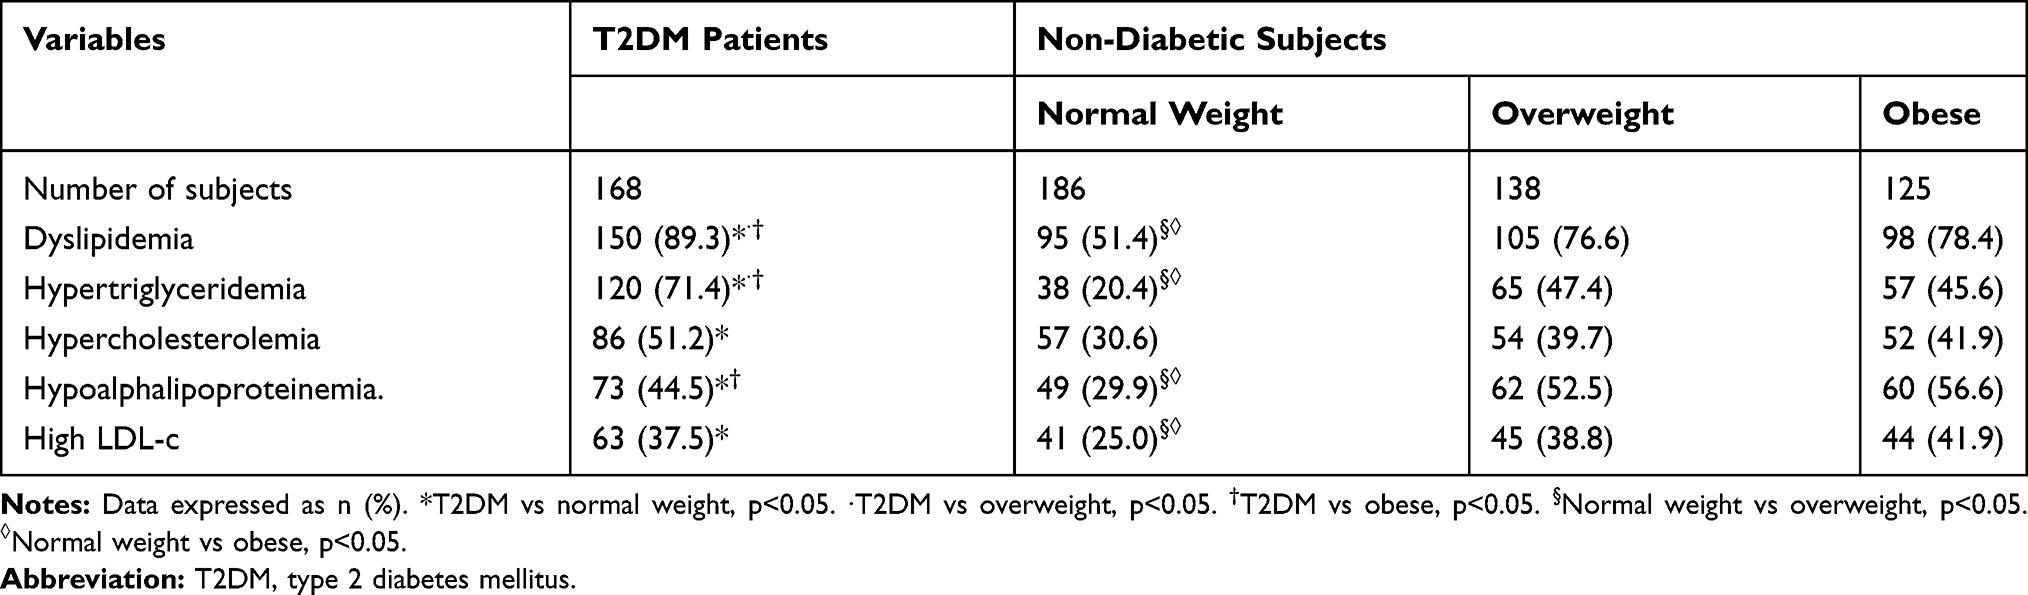 |
Table 2 Prevalence of Dyslipidemia Among Non-Diabetic Subjects and T2DM Patients |
The effect of ApoE alleles on the metabolic profile and dyslipidemia among T2DM patients is depicted in Table 3. The E2 allele carriers had the highest HOMA-IR compared to the non-E2 carriers (p=0.002) and decreased levels of LDL-c compared to the E3 allele carriers. Furthermore, as shown in Supplementary Table 1, in the non-diabetic patients, the presence of the E2 allele increased the levels of HDL-c among the normal weight subjects when compared to the other allele subgroups. Also, the E2 allele increased the HOMA-IR among normal weight and overweight subjects in comparison with the other allele subgroups. In the E4 allele group, an increased prevalence of HCHOL (51.7%) was found compared to the E3 carriers (26.7%). Among the overweight subjects, the E2 allele carriers were older (61.2 ± 13.2 years old) compared to E3 and E4 carriers (50.8 ± 13.4 years old and 50.2 ± 14.2 years old, respectively). Among the obese patients, the E4 allele increased TC (220.4 ± 74.0 mg/dL) compared to E2 allele (173.2 ± 37.2 mg/dL). ApoE genotypes and alleles were in HWE in both controls (p=0.806) and T2DM patients (p=1.000).
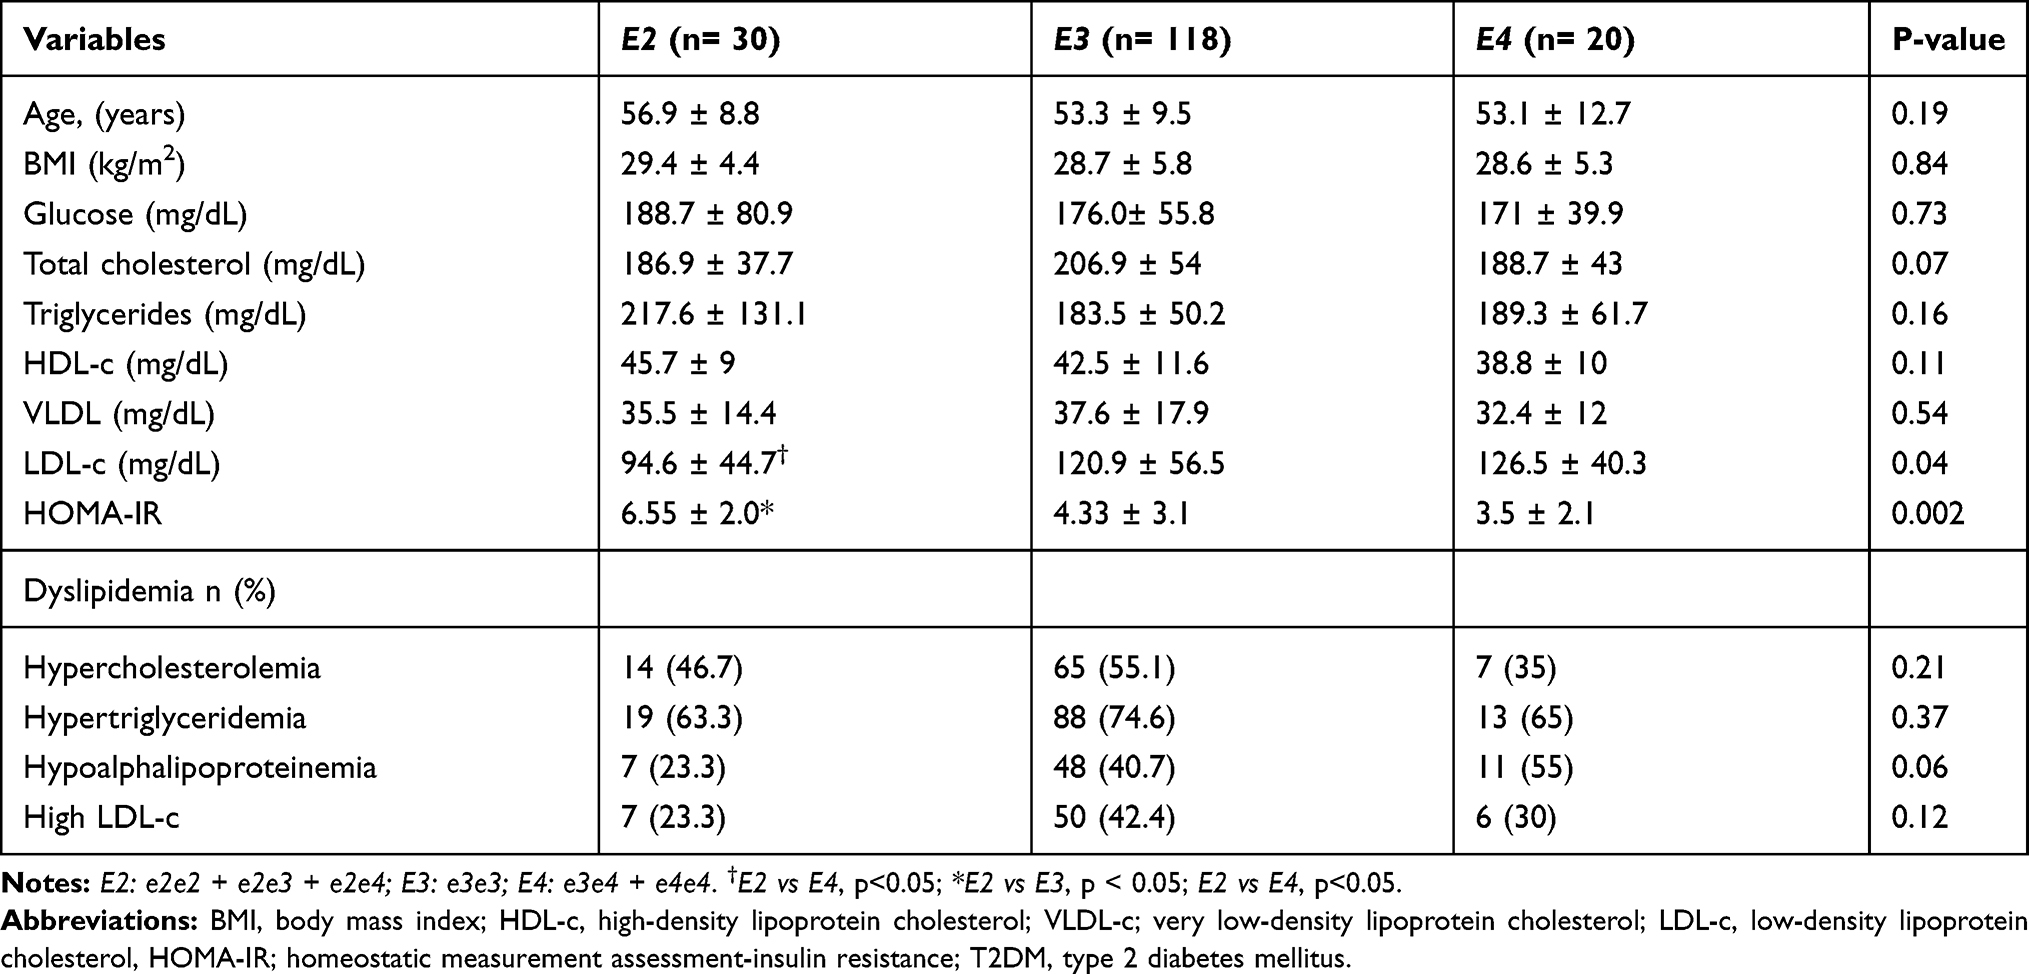 |
Table 3 Effect of ApoE Alleles on Lipid Profile and Dyslipidemia of T2DM Patients |
Table 4 shows the association analysis in which the T2DM patients compared to the non-diabetic group had a higher proportion of e2e3 genotype (16.1% vs 5.4%) and e2 allele (9.2% vs 3.3%). Variables of age, gender, and BMI were adjusted for the association analysis revealing that the presence of the e2 allele conferred an OR of 2.1 (95% IC 1.20–3.79, p=0.009) in comparison with e3 + e4 alleles.
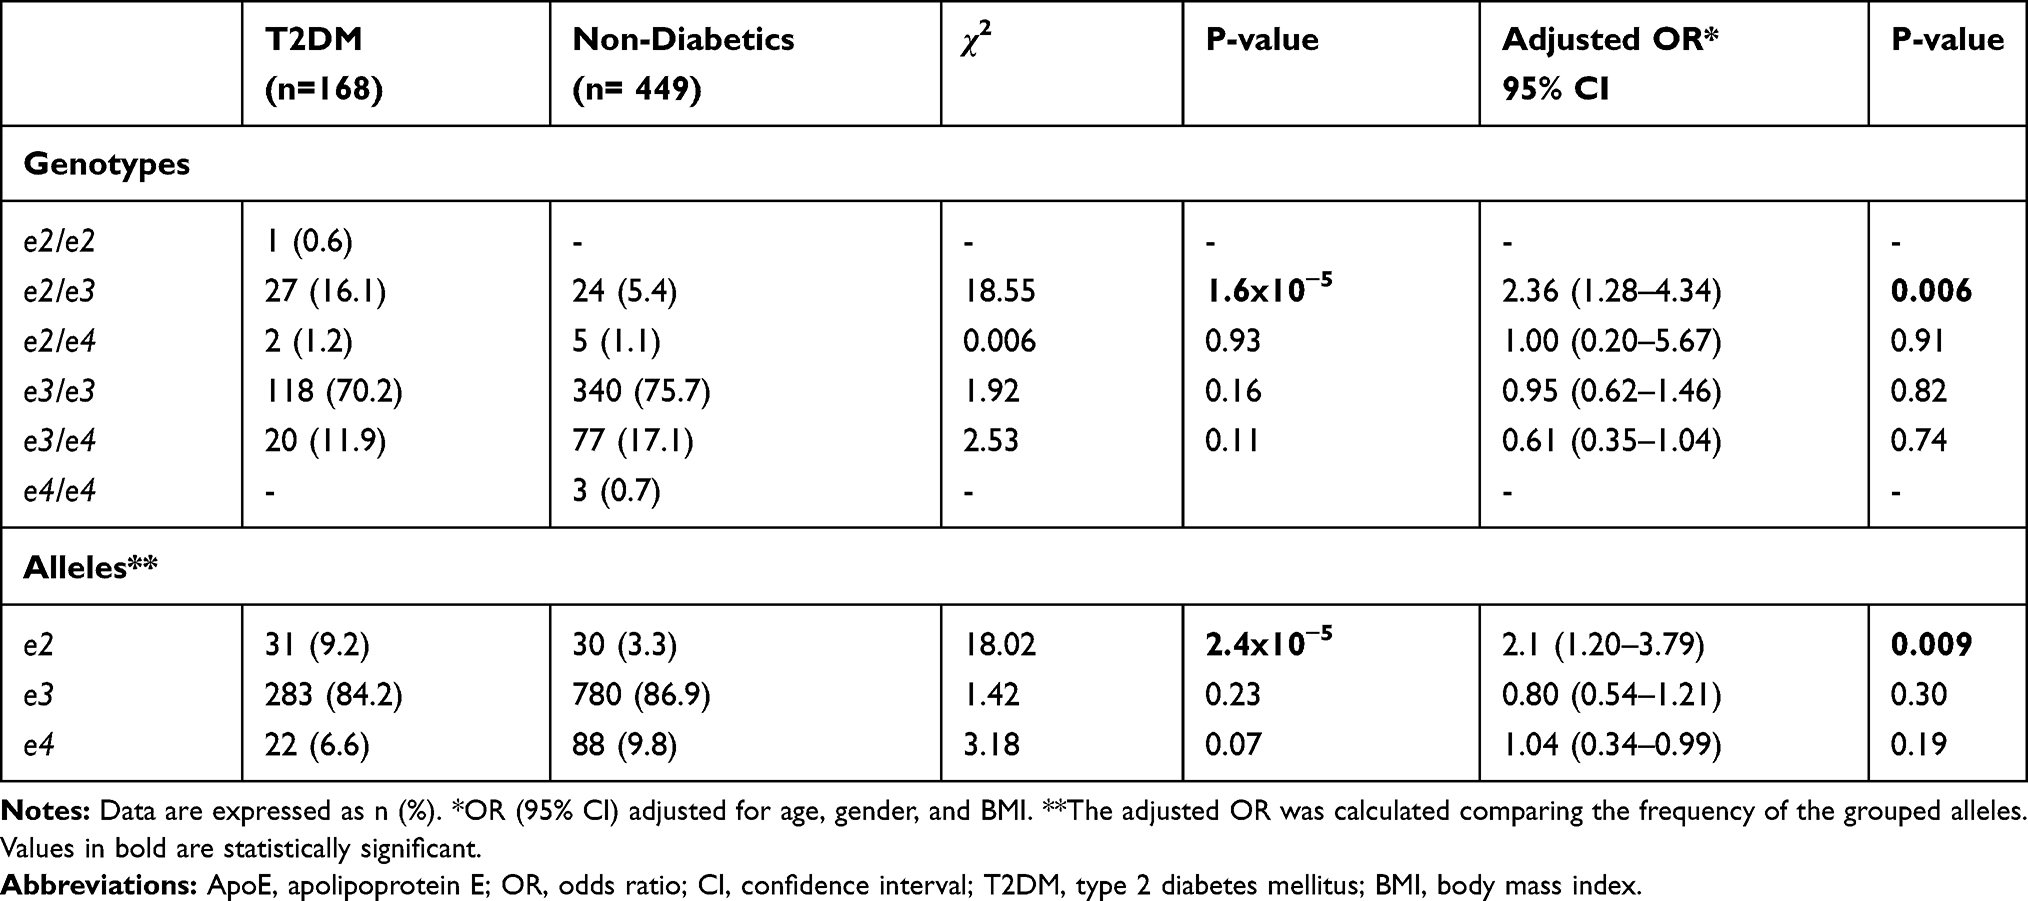 |
Table 4 Association Analysis of ApoE E2 Allele with T2DM |
Discussion
The association of the ApoE e2 allele with the susceptibility for T2DM among specific populations has generated controversies14,17 due to differences in the distribution of the ApoE alleles and lifestyle factors such as diet composition or physical activity that result in alterations of blood lipids. Therefore, we investigated such association in the Mexican population which presents both a high prevalence of the e2 allele among specific populations as previously reported20 and a high prevalence of diabetes (10.3%).4 Herein, an association of the e2 allele with T2DM with an increase in the prevalence of dyslipidemias and HOMA-IR values were detected among the study groups.
Dyslipidemias are known as metabolic risk factors involved in the onset and progression of T2DM.6 They may confer risk for other chronic diseases such as cardiovascular25 and liver diseases.26 In the case of T2DM, dyslipidemia and IR may trigger a constant decline in β-cell function due to a continuous metabolic exertion of these cells over a long period.27 In this study, half of the healthy normal weight subjects had at least one abnormal lipid value and the main dyslipidemias were HCHOL and high LDL-c levels. This finding is similar to previous data reported in younger people from Central Mexico.28 Conversely, in the overweight and obese subjects, the main dyslipidemias were HALP and HTG. In patients with T2DM, HTG was by far the most prevalent dyslipidemia in agreement with the elevated IR, and 51.2% of them had values of TC above the recommended threshold.
Furthermore, a significant shift in the prevalence of the metabolic lipid alterations that went from 51.4% in the normal weight (age 33.5 years) to 76.6% in the overweight subjects (age 50.0 years) was revealed. However, this shift was not evident between overweight and obese patients (76.6% to 78.4%). As for liver enzymes, elevated ALT is a predictor of nonalcoholic fatty liver disease.29 ALT was increased in obese non-diabetics and was frankly altered in T2DM patients suggesting the onset of liver damage as previously reported in young and obese Mexican subjects with nonalcoholic steatohepatitis and abnormal liver stiffness.30 In conjunction, these metabolic alterations in the context of obesity are alarming considering the subjects’ age and re-enforce the need of national prevention programs to diminish the up rise of mortality in Mexico due to the triad of T2DM, cardiovascular and liver diseases.31
On the other hand, the effect of ApoE alleles on the serum lipid concentrations has been extensively investigated. However, different results are reported due to ethnicity, dietary patterns, co-morbidities, or the mean age of the study population.32,33 In this study, the e4 allele was related to high levels of TC and HCHOL in normal weight and obese subjects. These results may be explained by the putative high affinity of the e4 isoform to LDL-R, increasing the levels of TC and the incidence of CVD.34 On the other hand, the e2 allele was associated with higher levels of HDL-c in normal weight subjects, which is in alignment with the diminishing effect of the e2 isoform on the removal of plasmatic HDL-c.35 Also, in the overweight subjects, the e2 allele was related to older age in comparison to e3 and e4 carriers. Considering the European ancestry of the West Mexico population,19 this result is consistent with the increased life expectancy observed among Europeans carriers of e2e3 genotype.36
As mentioned before, the β-cell dysfunction is a central feature of T2DM caused by a progressively defective insulin secretion that is indirectly quantified by the HOMA-IR method.21 In this study, e2 allele carriers had an abnormal HOMA-IR index and a higher risk of T2DM compared to the non-e2 allele carriers. We hypothesize that the reduced affinity of e2 isoform to the LDL-R led to impaired plasma clearance of the e2 triglyceride-rich lipoprotein. Although no significant differences were observed in the level of TG between e2 and non-e2 alleles, the e2 allele was the unique allele among diabetic patients with the highest levels of TG. Alongside, HOMA-IR values were also altered in both normal weight and overweight subjects who were non-diabetic e2 allele carriers; however, HOMA-IR values were normalized in those who were obese. Notably, this subgroup of patients considered metabolically healthy has been reported previously30 suggesting that other genes may exert protective effects in these subjects. Nonetheless, in this study, most T2DM patients were obese, a factor that can potentiate the development of IR by increasing the delivery of fatty acids to the liver and muscle exceeding the storage and oxidative capacities of these tissues37 and by activating enzymes that negatively regulate insulin action.38
A well-known environmental factor known to interact with genetics is dietary habits. In this study, the high prevalence of dyslipidemias, even among the normal weight patients, may be related to the shift in dietary patterns that have occurred over the last three decades. Currently, the Mexican population consumes less of a regional Mesoamerican-based dietary regimen and overconsumes a high-calorie, unbalanced, hepatopathogenic diet.39,40 The metabolic alterations found in this study are in alignment with experiments carried out in mice fed with a Western-type, high-fat, and high-cholesterol diet. APOE2 mice had elevated fasting insulin levels and displayed prolonged postprandial hyperlipidemia, inflammation, and susceptibility to diet-induced obesity compared with APOE3 mice.41
Mexico and other Amerindian-derived countries of Latin America are considered as populations with inherent susceptibility for HTG.42. Also, it has been documented that Hispanic descendants are among the populations with a high incidence of T2DM worldwide.43 Besides the association of the e2 allele found in this study and also reported by others, e2 allele has also been associated with an increased incidence of nephropathy in T2DM patients,44 and early onset of alcoholic cirrhosis.45 Therefore, diabetic patients from West Mexico may present long-term T2DM-related complications if no preventive actions are taken. Furthermore, the detection of the ApoE e2 allele in conjunction with other variants may be a useful tool for identifying high-risk groups for T2DM in the Mexican population. Some genetics variants showing a strong association with HTG and carbohydrate intake are rs662799 APOA5,46 Ala54Thr FABP2,47,48 rs5072 APOA146 and Val194Val TAS1R249 that may influence the natural history of T2DM.50 These antecedents highlight the relevance of determining the association of genetic variants with diseases based on the population’s genetic and environmental background and avoid extrapolating genomic data from non-related populations.
In perspective, the establishment of personalized-medicine strategies to diagnose and treat dyslipidemia in the early stages of progression, as well as planning prevention programs for diabetes, cardiovascular, and liver diseases is urgently needed.51,52 Regional clinical practice guidelines to treat these inter-related chronic diseases require considering the genetic, dietary, and cultural determinants that have a significant impact on clinical outcomes.53 Therefore, comparative research on the impact of unhealthy dietary changes on the development of dyslipidemia and T2DM in populations with differences in the distribution of ApoE alleles is warranted.
Conclusion
The ApoE e2 allele was associated with a higher prevalence of IR and risk for T2DM in an admixed population from West Mexico.
Disclosure
The authors report no conflicts of interest in this work.
References
1. Cho NH, Shaw JE, Karuranga S, et al. IDF diabetes atlas: global estimates of diabetes prevalence for 2017 and projections for 2045. Diabetes Res Clin Pract. 2018;138:271–281.
2. Chen L, Magliano DJ, Zimmet PZ. The worldwide epidemiology of type 2 diabetes mellitus–present and future perspectives. Nat Rev Endocrinol. 2011;8(4):228–236.
3. Collaboration NCDRF. Worldwide trends in body-mass index, underweight, overweight, and obesity from 1975 to 2016: a pooled analysis of 2416 population-based measurement studies in 128.9 million children, adolescents, and adults. Lancet. 2017;390(10113):2627–2642.
4. Encuesta Nacional de Salud y Nutrición 2018. Available from: https://ensanut.insp.mx/encuestas/ensanut2018/doctos/informes/ensanut_2018_presentacion_resultados.pdf.
5. Brown A, Guess N, Dornhorst A, Taheri S, Frost G. Insulin-associated weight gain in obese type 2 diabetes mellitus patients: what can be done? Diab Obes Metab. 2017;19(12):1655–1668.
6. Rhee EP, Cheng S, Larson MG, et al. Lipid profiling identifies a triacylglycerol signature of insulin resistance and improves diabetes prediction in humans. J Clin Invest. 2011;121(4):1402–1411.
7. Esteghamati A, Zandieh A, Zandieh B, et al. Comparing abilities of different lipid measures in diagnosis of insulin resistance: a survey of risk factors of non-communicable diseases (SuRFNCD-2007) study. Metab Syndr Relat Disord. 2012;10(1):63–69.
8. Roman S, Rivera-Iñiguez I, Ojeda-Granados C, Sepulveda-Villegas M, Panduro A. Genome-based nutrition in chronic liver disease. In: Dietary Interventions in Liver Disease: Foods, Nutrients, and Dietary Supplements. Watson RR, Preedy VR, editors. Academic Press, Elsevier; 2019:3–14.
9. Perez-Ferrer C, McMunn A, Zaninotto P, Brunner EJ. The nutrition transition in Mexico 1988-2016: the role of wealth in the social patterning of obesity by education. Public Health Nutr. 2018;21(13):2394–2401.
10. Rivas-Gomez B, Almeda-Valdes P, Tussie-Luna MT, Aguilar-Salinas CA. DYSLIPIDEMIA IN MEXICO, A CALL FOR ACTION. Rev Invest Clin. 2018;70(5):211–216.
11. Marais AD. Apolipoprotein E in lipoprotein metabolism, health and cardiovascular disease. Pathology. 2019;51(2):165–176.
12. Seripa D, D’Onofrio G, Panza F, Cascavilla L, Masullo C, Pilotto A. The genetics of the human APOE polymorphism. Rejuvenation Res. 2011;14(5):491–500.
13. Larson IA, Ordovas JM, DeLuca C, Barnard JR, Feussner G, Schaefer EJ. Association of apolipoprotein (Apo) E genotype with plasma apo E levels. Atherosclerosis. 2000;148(2):327–335.
14. Anthopoulos PG, Hamodrakas SJ, Bagos PG. Apolipoprotein E polymorphisms and type 2 diabetes: a meta-analysis of 30 studies including 5423 cases and 8197 controls. Mol Genet Metab. 2010;100(3):283–291.
15. Santos-Ferreira C, Baptista R, Oliveira-Santos M, Costa R, Pereira Moura J, Goncalves L. Apolipoprotein E2 genotype is associated with a 2-fold increase in the incidence of Type 2 diabetes mellitus: results from a long-term observational study. J Lipids. 2019;2019:1698610.
16. Srirojnopkun C, Kietrungwilaikul K, Boonsong K, Thongpoonkaew J, Jeenduang N. Association of APOE and CETP TaqIB polymorphisms with Type 2 diabetes mellitus. Arch Med Res. 2018;49(7):479–485.
17. Alharbi KK, Khan IA, Syed R. Association of apolipoprotein E polymorphism with type 2 diabetes mellitus in a Saudi population. DNA Cell Biol. 2014;33(9):637–641.
18. Rangel-Villalobos H, Munoz-Valle JF, Gonzalez-Martin A, Gorostiza A, Magana MT, Paez-Riberos LA. Genetic admixture, relatedness, and structure patterns among Mexican populations revealed by the Y-chromosome. Am J Phys Anthropol. 2008;135(4):448–461.
19. Ojeda-Granados C, Panduro A, Gonzalez-Aldaco K, Sepulveda-Villegas M, Rivera-Iniguez I, Roman S. Tailoring nutritional advice for mexicans based on prevalence profiles of diet-related adaptive gene polymorphisms. J Pers Med. 2017;7:4.
20. Aceves D, Ruiz B, Nuno P, Roman S, Zepeda E, Panduro A. Heterogeneity of apolipoprotein E polymorphism in different Mexican populations. Hum Biol. 2006;78(1):65–75.
21. Matthews DR, Hosker JP, Rudenski AS, Naylor BA, Treacher DF, Turner RC. Homeostasis model assessment: insulin resistance and beta-cell function from fasting plasma glucose and insulin concentrations in man. Diabetologia. 1985;28(7):412–419.
22. American Diabetes A. 2. Classification and diagnosis of diabetes: standards of medical care in diabetes-2020. Diab Care. 2020;43(Suppl 1):S14–S31.
23. National Cholesterol Education Program (NCEP) Expert Panel on Detection, Evaluation, and Treatment of High Blood Cholesterol in Adults. Third Report of the National Cholesterol Education Program (NCEP) Expert Panel on Detection, Evaluation, and Treatment of High Blood Cholesterol in Adults (Adult Treatment Panel III) final report. Circulation. 2002;106(25):3143–3421.
24. Koch W, Ehrenhaft A, Griesser K, et al. TaqMan systems for genotyping of disease-related polymorphisms present in the gene encoding apolipoprotein E. Clin Chem Lab Med. 2002;40(11):1123–1131.
25. Reiner Z. Hypertriglyceridaemia and risk of coronary artery disease. Nat Rev Cardiol. 2017;14(7):401–411.
26. Katsiki N, Mikhailidis DP, Mantzoros CS. Non-alcoholic fatty liver disease and dyslipidemia: an update. Metabolism. 2016;65(8):1109–1123.
27. Fonseca VA. Defining and characterizing the progression of type 2 diabetes. Diab Care. 2009;32(Suppl 2):S151–156.
28. Medina-Urrutia AX, Cardoso-Saldana GC, Zamora-Gonzalez J, Liria YK, Posadas-Romero C. Apolipoprotein E polymorphism is related to plasma lipids and apolipoproteins in Mexican adolescents. Hum Biol. 2004;76(4):605–614.
29. Suzuki A, Lymp J, St Sauver J, Angulo P, Lindor K. Values and limitations of serum aminotransferases in clinical trials of nonalcoholic steatohepatitis. Liver Int. 2006;26(10):1209–1216.
30. Sepulveda-Villegas M, Roman S, Rivera-Iniguez I, et al. High prevalence of nonalcoholic steatohepatitis and abnormal liver stiffness in a young and obese Mexican population. PLoS One. 2019;14(1):e0208926.
31. Gómez-Dantés O, Sesma S, Becerril VM, Knaul FM, Arreola H, Frenk J. Sistema de salud de México. Salud Pública de México. 2011;53(suppl 2):S220–S232.
32. Gonzalez HM, Tarraf W, Jian X, et al. Apolipoprotein E genotypes among diverse middle-aged and older latinos: study of latinos-investigation of neurocognitive aging results (HCHS/SOL). Sci Rep. 2018;8(1):17578.
33. Chaudhary R, Likidlilid A, Peerapatdit T, et al. Apolipoprotein E gene polymorphism: effects on plasma lipids and risk of type 2 diabetes and coronary artery disease. Cardiovasc Diabetol. 2012;11:36.
34. Mahley RW. Apolipoprotein E: from cardiovascular disease to neurodegenerative disorders. J Mol Med. 2016;94(7):739–746.
35. Sebastiani P, Gurinovich A, Nygaard M, et al. APOE alleles and extreme human longevity. J Gerontol A Biol Sci Med Sci. 2019;74(1):44–51.
36. Ewbank DC. The APOE gene and differences in life expectancy in Europe. J Gerontol A Biol Sci Med Sci. 2004;59(1):16–20.
37. Czech MP. Insulin action and resistance in obesity and type 2 diabetes. Nat Med. 2017;23(7):804–814.
38. Schenk S, Saberi M, Olefsky JM. Insulin sensitivity: modulation by nutrients and inflammation. J Clin Invest. 2008;118(9):2992–3002.
39. Roman S, Ojeda-Granados C, Ramos-Lopez O, Panduro A. Genome-based nutrition: an intervention strategy for the prevention and treatment of obesity and nonalcoholic steatohepatitis. World J Gastroenterol. 2015;21(12):3449–3461.
40. Ramos-López O, Roman S, Ojeda-Granados C, Sepúlveda-Villegas M, et al. Patrón de ingesta alimentaria y actividad física en pacientes hepatópatas en el Occidente de México. Rev Endocrinol Nutr. 2013;21(1):7–15.
41. Kuhel DG, Konaniah ES, Basford JE, et al. Apolipoprotein E2 accentuates postprandial inflammation and diet-induced obesity to promote hyperinsulinemia in mice. Diabetes. 2013;62(2):382–391.
42. Aguilar-Salinas CA, Tusie-Luna T, Pajukanta P. Genetic and environmental determinants of the susceptibility of Amerindian derived populations for having hypertriglyceridemia. Metabolism. 2014;63(7):887–894.
43. Spanakis EK, Golden SH. Race/ethnic difference in diabetes and diabetic complications. Curr Diab Rep. 2013;13(6):814–823.
44. Atageldiyeva KK, Nemr R, Echtay A, Racoubian E, Sarray S, Almawi WY. Apolipoprotein E genetic polymorphism influence the susceptibility to nephropathy in type 2 diabetes patients. Gene. 2019;715:144011.
45. Hernandez-Nazara ZH, Ruiz-Madrigal B, Martinez-Lopez E, Roman S, Panduro A. Association of the epsilon 2 allele of APOE gene to hypertriglyceridemia and to early-onset alcoholic cirrhosis. Alcohol Clin Exp Res. 2008;32(4):559–566.
46. Suarez-Sanchez F, Klunder-Klunder M, Valladares-Salgado A, et al. APOA5 and APOA1 polymorphisms are associated with triglyceride levels in Mexican children. Pediatr Obes. 2017;12(4):330–336.
47. Martinez-Lopez E, Curiel-Lopez F, Hernandez-Nazara A, et al. Influence of ApoE and FABP2 polymorphisms and environmental factors in the susceptibility to gallstone disease. Ann Hepatol. 2015;14(4):515–523.
48. Gonzalez-Becerra K, Ramos-Lopez O, Garcia-Cazarin ML, Barron-Cabrera E, Panduro A, Martinez-Lopez E. Associations of the lipid genetic variants Thr54 (FABP2) and −493T (MTTP) with total cholesterol and low-density lipoprotein cholesterol levels in Mexican subjects. J Int Med Res. 2018;46(4):1467–1476.
49. Ramos-Lopez O, Panduro A, Martinez-Lopez E, Roman S. Sweet taste receptor TAS1R2 polymorphism (Val191Val) is associated with a higher carbohydrate intake and hypertriglyceridemia among the population of West Mexico. Nutrients. 2016;8(2):101.
50. Panduro A, Roman S, Milan RG, Torres-Reyes LA, Gonzalez-Aldaco K. Personalized nutrition to treat and prevent obesity and diabetes. In: Cheng Z, editor. Nutritional Signaling Pathway in Obesity and Diabetes. Royal Society of Chemistry. Royal Society of Chemistry;2020:272-294.
51. Panduro A, Roman S. Personalized medicine in Latin America. Per Med. 2020. doi:10.2217/pme-2020-0049.
52. Roman S. Genome-based nutritional strategies to prevent chronic liver disease. Ann Hepatol. 2019;18(4):537–538.
53. Panduro A, Roman S. Advancements in genomic medicine and the need for updated regional clinical practice guidelines in the field of hepatology. Ann Hepatol. 2020;19(1):1–2.
 © 2020 The Author(s). This work is published and licensed by Dove Medical Press Limited. The full terms of this license are available at https://www.dovepress.com/terms.php and incorporate the Creative Commons Attribution - Non Commercial (unported, v3.0) License.
By accessing the work you hereby accept the Terms. Non-commercial uses of the work are permitted without any further permission from Dove Medical Press Limited, provided the work is properly attributed. For permission for commercial use of this work, please see paragraphs 4.2 and 5 of our Terms.
© 2020 The Author(s). This work is published and licensed by Dove Medical Press Limited. The full terms of this license are available at https://www.dovepress.com/terms.php and incorporate the Creative Commons Attribution - Non Commercial (unported, v3.0) License.
By accessing the work you hereby accept the Terms. Non-commercial uses of the work are permitted without any further permission from Dove Medical Press Limited, provided the work is properly attributed. For permission for commercial use of this work, please see paragraphs 4.2 and 5 of our Terms.