")
Back to Journals » International Journal of General Medicine » Volume 14
Association of Age and Sex with Metabolic Syndrome in Taiwanese Adults
Authors Liu PL, Hsu MY, Hu CC, Tantoh DM, Lu WY, Nfor ON, Liaw YP
Received 10 December 2020
Accepted for publication 10 March 2021
Published 20 April 2021 Volume 2021:14 Pages 1403—1411
DOI https://doi.org/10.2147/IJGM.S296814
Checked for plagiarism Yes
Review by Single anonymous peer review
Peer reviewer comments 2
Editor who approved publication: Dr Scott Fraser
Pang-Li Liu,1 Ming-Yi Hsu,2,3 Chao-Chin Hu,4 Disline Manli Tantoh,5,6 Wen-Yu Lu,6 Oswald Ndi Nfor,6 Yung-Po Liaw5,6
1Department of Medical Sociology and Social Work, Chung Shan Medical University, Taichung, 40201, Taiwan; 2Department of Nursing, Chung Shan Medical University, Taichung, 40201, Taiwan; 3Department of Nursing, Chung Shan Medical University Hospital, Taichung, 40201, Taiwan; 4Department of Medical Applied Chemistry, Chung Shan Medical University, Taichung, 40201, Taiwan; 5Department of Medical Imaging, Chung Shan Medical University Hospital, Taichung, 40201, Taiwan; 6Department of Public Health and Institute of Public Health, Chung Shan Medical University, Taichung, 40201, Taiwan
Correspondence: Yung-Po Liaw; Oswald Ndi Nfor Tel +886-932-532-370
Fax +886-266-369-260
Email [email protected]; [email protected]
Objective: This study aimed to investigate the association of age and sex with metabolic syndrome (MS) in Taiwanese adults.
Methods: We extracted information of 4307 men and 4783 women aged 30– 70 from the Taiwan Biobank.
Results: The interaction between age and sex on MS was significant (p-value = 0.0001). After stratification by sex, men and women aged 50– 70 years (reference: 30≤age< 50 years) had a higher risk of MS. The odds ratio (OR), 95% confidence interval (CI) was 2.316, 1.936– 2.772 in men and 3.101, 2.561– 3.754 in women. After stratification by age, men aged 50– 70 years had a lower risk of MS compared to women (OR, 95% CI = 0.713, 0.598– 0.851).
Conclusion: The interaction between age and sex on MS was significant. Sex-wise, both men and women aged 50– 70 years had a higher likelihood of MS. Age-wise, men aged 50– 70 years had a lower risk of MS compared to women.
Keywords: metabolic syndrome, age, sex, Taiwan Biobank
Introduction
Metabolic syndrome (MS) encompasses an interconnection of physiological, individual behavioral, and social environmental factors that increase the risk of cardiovascular disease and type 2 diabetes.1–6 Some physiological factors include obesity,2,3,7–12 insulin resistance,7,14–16 hypertension,7,14,15,17–21 low levels of high-density lipoprotein (HDL),14,15,22 hypertriglyceridemia,14,15,23 and genetic susceptibility.5,7,13,24–29 Some social environmental factors include urbanization18,30,33 and modernization.24,33 Individual behavioral factors comprise lifestyle factors, including physical activity,1,2,4,5,8,19,25,31–33,36,50 smoking,8,33,36 alcohol drinking,8,33 and dietary habits.5,11,25,31,32,38
Age and MS have been consistently reported to have a positive relationship.8,10,11,15,16,18,19,22,23,26,28,32–39 For example, a one-year change in age was associated with a 1.06 likelihood of having metabolic syndrome.26 In a nationwide study in 2002, the prevalence of MS among Taiwanese adults aged 20–29 years was just 5.2% while that in those aged 70–79 years was 36.5%.10 Moreover, in another study involving individuals who underwent work-related health screening between 2008 and 2012 in a teaching hospital in Changhua County, the prevalence among participants who were 21–30 and over 50 years was 5.1 and 20.9%, respectively.37
Although MS has been consistently associated with age, its relationship with sex has been inconsistent. While a few studies did not find significant sex differences,17,29,39,41 many others supported sex-wise differences. In some studies, the prevalence rate was significantly higher among women than men.9,11,18,19,21,28,33,38,40–44,47,49 In other studies, on the other hand, it was higher in men than women.10,20,22,23,26,32,37,45,46,48
Findings on the prevalence of MS by both age and sex have been conflicting. For example, some epidemiological studies showed evidence of a higher prevalence of MS in elderly women compared to their male counterparts while others reported the contrary.28 The prevalence of MS among some ethnic populations in the USA increased with age, peaking in the sixties and seventies among men and women, respectively, and then declined after the eighties for both sexes.8 MS was more prevalent in Taiwanese women aged 65 and above compared to their male counterparts. However, it was more prevalent in men aged 40–65 years compared to their female counterparts.33 The prevalence was directly associated with age among Taiwanese women.22 In Chinese adults, age was directly associated with the prevalence rate of MS in only female participants.18 The prevalence of MS in elderly Japanese women was almost three-fold higher than in middle-aged women while there was no significant difference between the elderly and middle-aged men.34 Due to these incoherencies, we examined the association of age and sex with MS in Taiwanese adults.
Materials and Methods
Study Population
Data were obtained from the Taiwan Biobank, whose participants are Taiwanese men and women between 30 and 70 years, who have never been clinically diagnosed with cancer. The Taiwan Biobank was founded to collect biological, lifestyle, and genetic information to determine health risk factors and establish research resources. Information about enrolment into the Taiwan Biobank project is available through media, posters, brochures, and websites. Currently, 29 centers have been allocated all over Taiwan for recruiting participants. Noteworthy, each city or county has at least one center. Taiwan Biobank complies with relevant data protection and privacy regulations. After interested volunteers sign the consent form, researchers interview them and fill questionnaires on age, sex, lifestyle (e.g, cigarette smoking, exercise, and alcohol drinking), and others. Moreover, trained and qualified researchers collect blood samples to determine parameters like fasting blood glucose (FBG), high-density lipoprotein (HDL), and triglyceride (TG). Anthropometric data (eg, waist circumference, weight, and height), blood pressure, pulse, and others are determined by physical examinations.
In this cross-sectional study, we included a total of 9090 individuals with body mass index (BMI) ≥18.5kg/m2 having complete data. The participants were stratified into two age cohorts (30 to < 50 and 50–70 years). All participants signed the informed consent letter. The Institutional Review Board of Chung Shan Medical University Hospital approved this work (CS1-20009).
Definition of Metabolic Syndrome
Metabolic syndrome was defined according to the criteria of the Ministry of Health and Welfare in Taiwan. Participants were classified as having metabolic syndrome if they met more than three of the following conditions: (1) waist circumference ≥ 90 cm for men and ≥ 80 cm for women; (2) systolic blood pressure (SBP) ≥ 130 mmHg or diastolic blood pressure (DBP) ≥ 85mmHg; (3) fasting blood glucose ≥ 100mg/dl; (4) high-density lipoprotein < 40 mg/dl for men and < 50 mg/dl for women; and (5) triglyceride ≥ 150 mg/dl. The tools used to assess the above variables were 1) measuring tape, for waist circumference; 2) blood pressure monitor (OMRON HEM7320, HEM7210), for blood pressure; 3) clinical analyzer (Hitachi LST008), for fasting blood glucose, HDL, and triglycerides. The tests were performed at the Chang Gung Memorial Hospital, Linkou, Taiwan following the manufacturers' instructions.
Description of other Variables
Information on cigarette smoking, alcohol drinking, exercise, midnight snack, coffee, vegetarian diet, and fat intake was self-reported. For cigarette smoking and alcohol drinking, we categorized participants into three (current, former, non-smokers or drinkers). Non-smokers were those with no personal history of smoking or those who have never smoked continuously for at least 6 months. Former smokers were individuals who quit smoking but have ever smoked continuously for a minimum of 6 months. Current smokers were active smokers who have been continuously smoking for at least 6 months. Non-drinkers included individuals with no history of alcohol drinking or those with a weekly intake of < 150 cc of alcohol continuously for 6 months. Former drinkers included those who abstained from alcohol for at least 6 months. Current drinkers included active alcohol drinkers with a weekly alcohol intake of at least 150 cc for continuously 6 months. Doing exercise which lasted for a minimum of 30 minutes at least three times per week was considered as regular exercise. Coffee drinking was defined as consuming coffee at least three times a week within the past month. Midnight snack takers were defined as those who had a habit of eating snacks one hour before bedtime even after eating dinner. Vegetarians included individuals who continuously followed a vegetarian course for 6 months or more. Fat intake was determined using fat scores (0–30) derived from the frequency of eating fat-rich food within the past month. We categorized participants into quartiles: <Q1 (score<13), Q1-Q2 (13≤score<15), Q2-Q3 (15≤score<18), and ≥Q3 (score≥18).
We calculated BMI as weight in kilograms (kg) divided by height in meters squared (m2). Height was determined with a manual height meter while the weight was determined using Tanita body composition analyzer (BC-420MA). BMI categories included normal weight, overweight, and obesity corresponding to 18.5≤BMI<24, 24≤BMI<27, and BMI ≥ 27 kg/m2.
Statistical Analysis
We used SAS version 9.4 (SAS Institute Inc., Cary, NC) to analyze data. Demographic data between metabolic syndrome cases and non-cases were compared using Student’s t-test (for continuous variables) and chi-square test (for categorical variables). The association of age and sex with MS and the interaction between sex and age on MS were determined using multiple logistic regression. Confounding variables included cigarette smoking, alcohol intake, BMI, exercise, midnight snack intake, coffee intake, vegetarian diet, and fat intake. P-values < 0.05 were considered as being statistically significant.
Results
Table 1 shows the demographic information of the study participants with and without MS. Age, sex, smoking, alcohol drinking, BMI, and coffee intake were significantly different between cases and non-cases of MS (p-value <0.0001). MS was significantly associated with age and sex: age (50–70 compared to 30 to < 50 years) was associated with a higher risk (OR = 2.615, 95% CI = 2.298–2.975) while sex (men compared to women) was associated with a lower risk (OR = 0.810, 95% CI = 0.705–0.929). There was also a significant interaction (p-value = 0.0001) between sex and age on metabolic syndrome (Table 2).
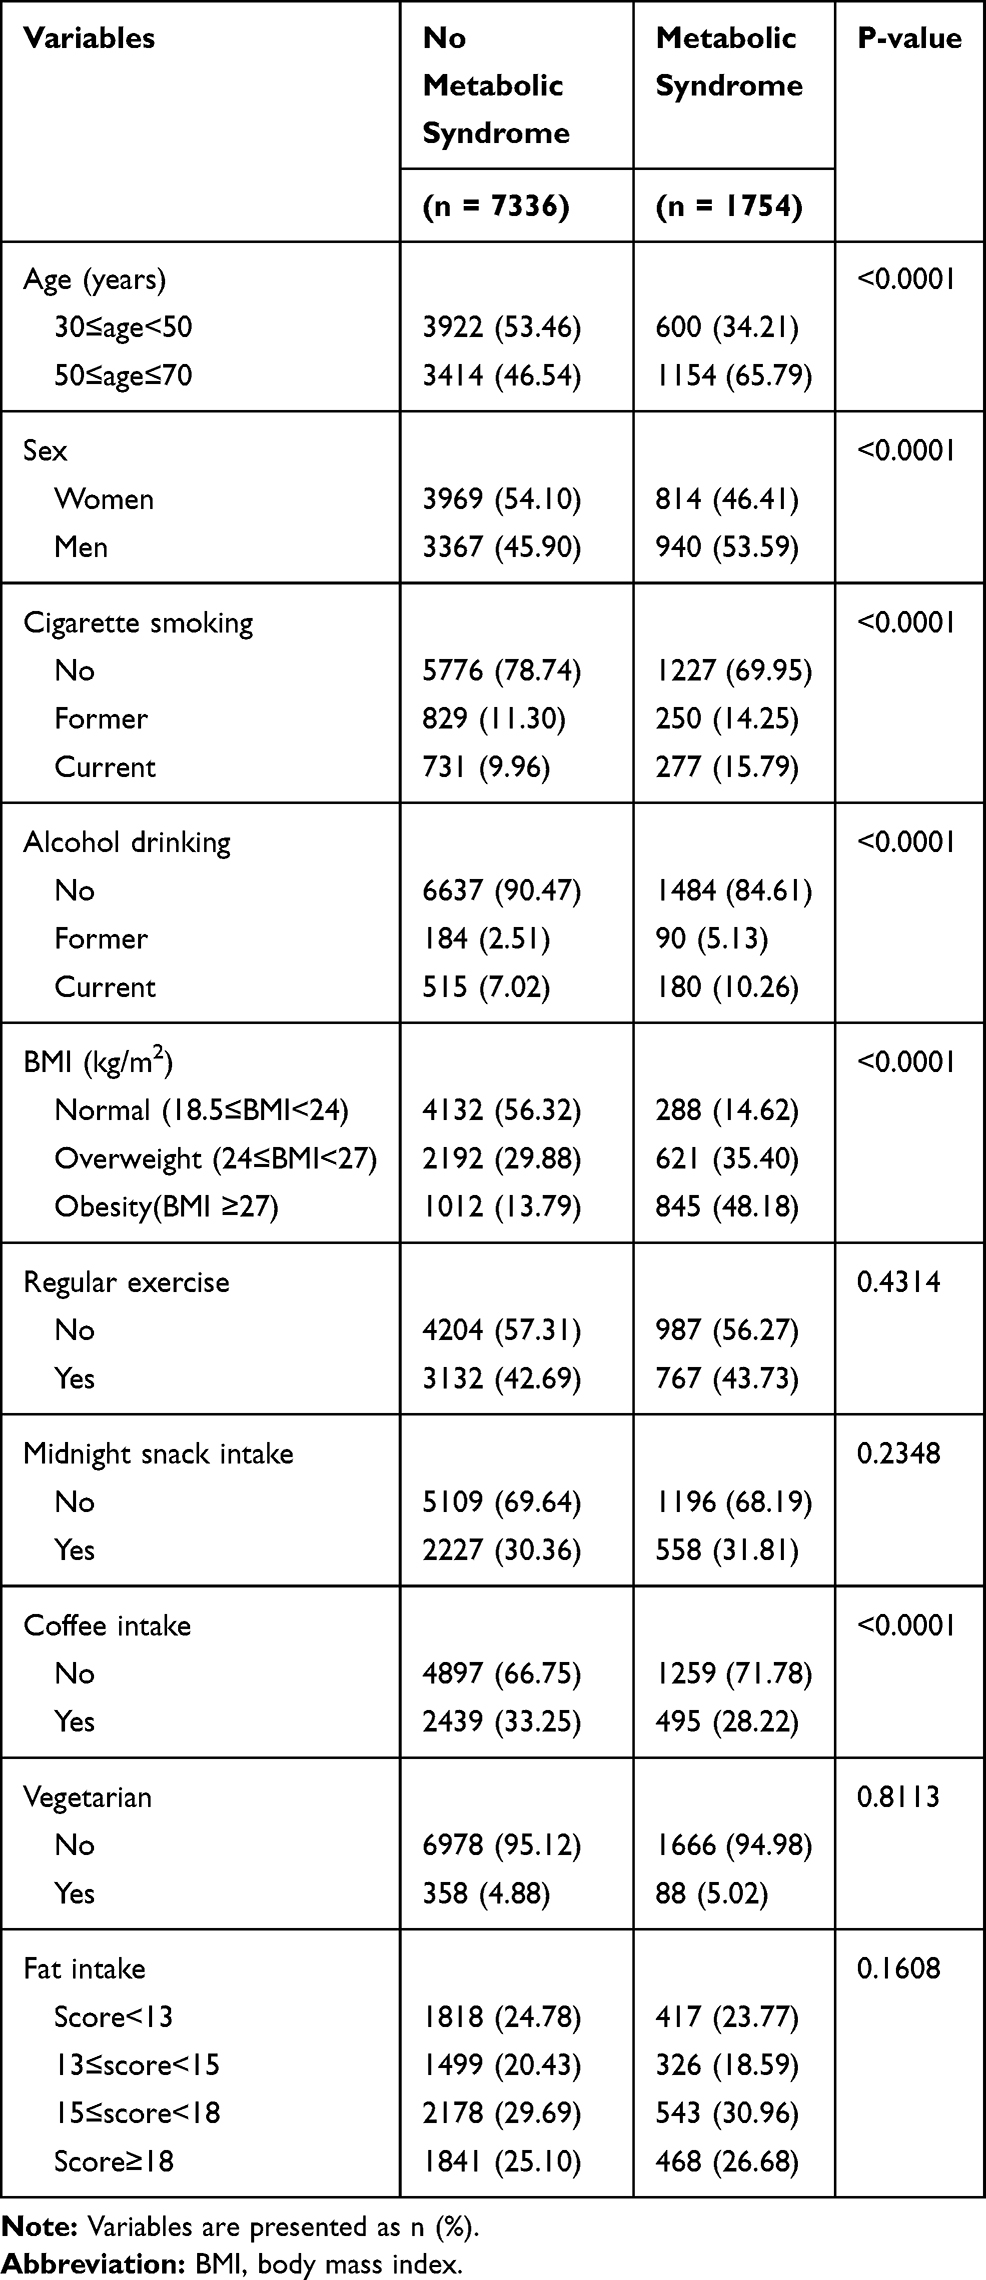 |
Table 1 Demographic Characteristics of Participants with and without Metabolic Syndrome |
 |
Table 2 Multiple Logistic Regression Analysis Showing the Association of Age and Sex with Metabolic Syndrome |
With participants stratified by sex, the age group 50–70 years (reference: 30≤age<50 years) was significantly associated with a higher risk of MS in both sexes (Table 3). The ORs (95% CIs) were 3.101 (2.561–3.754) in the female group and 2.316 (1.936–2.772) in the male group (Table 3). With participants stratified by age, there was no significant relationship between sex (men compared to women) and MS among participants aged 30 to < 50 years. However, the risk of MS was significantly lower among men (compared to women) aged 50 to 70 years: OR = 0.713, 95% CI = 0.598–0.851 (Table 4).
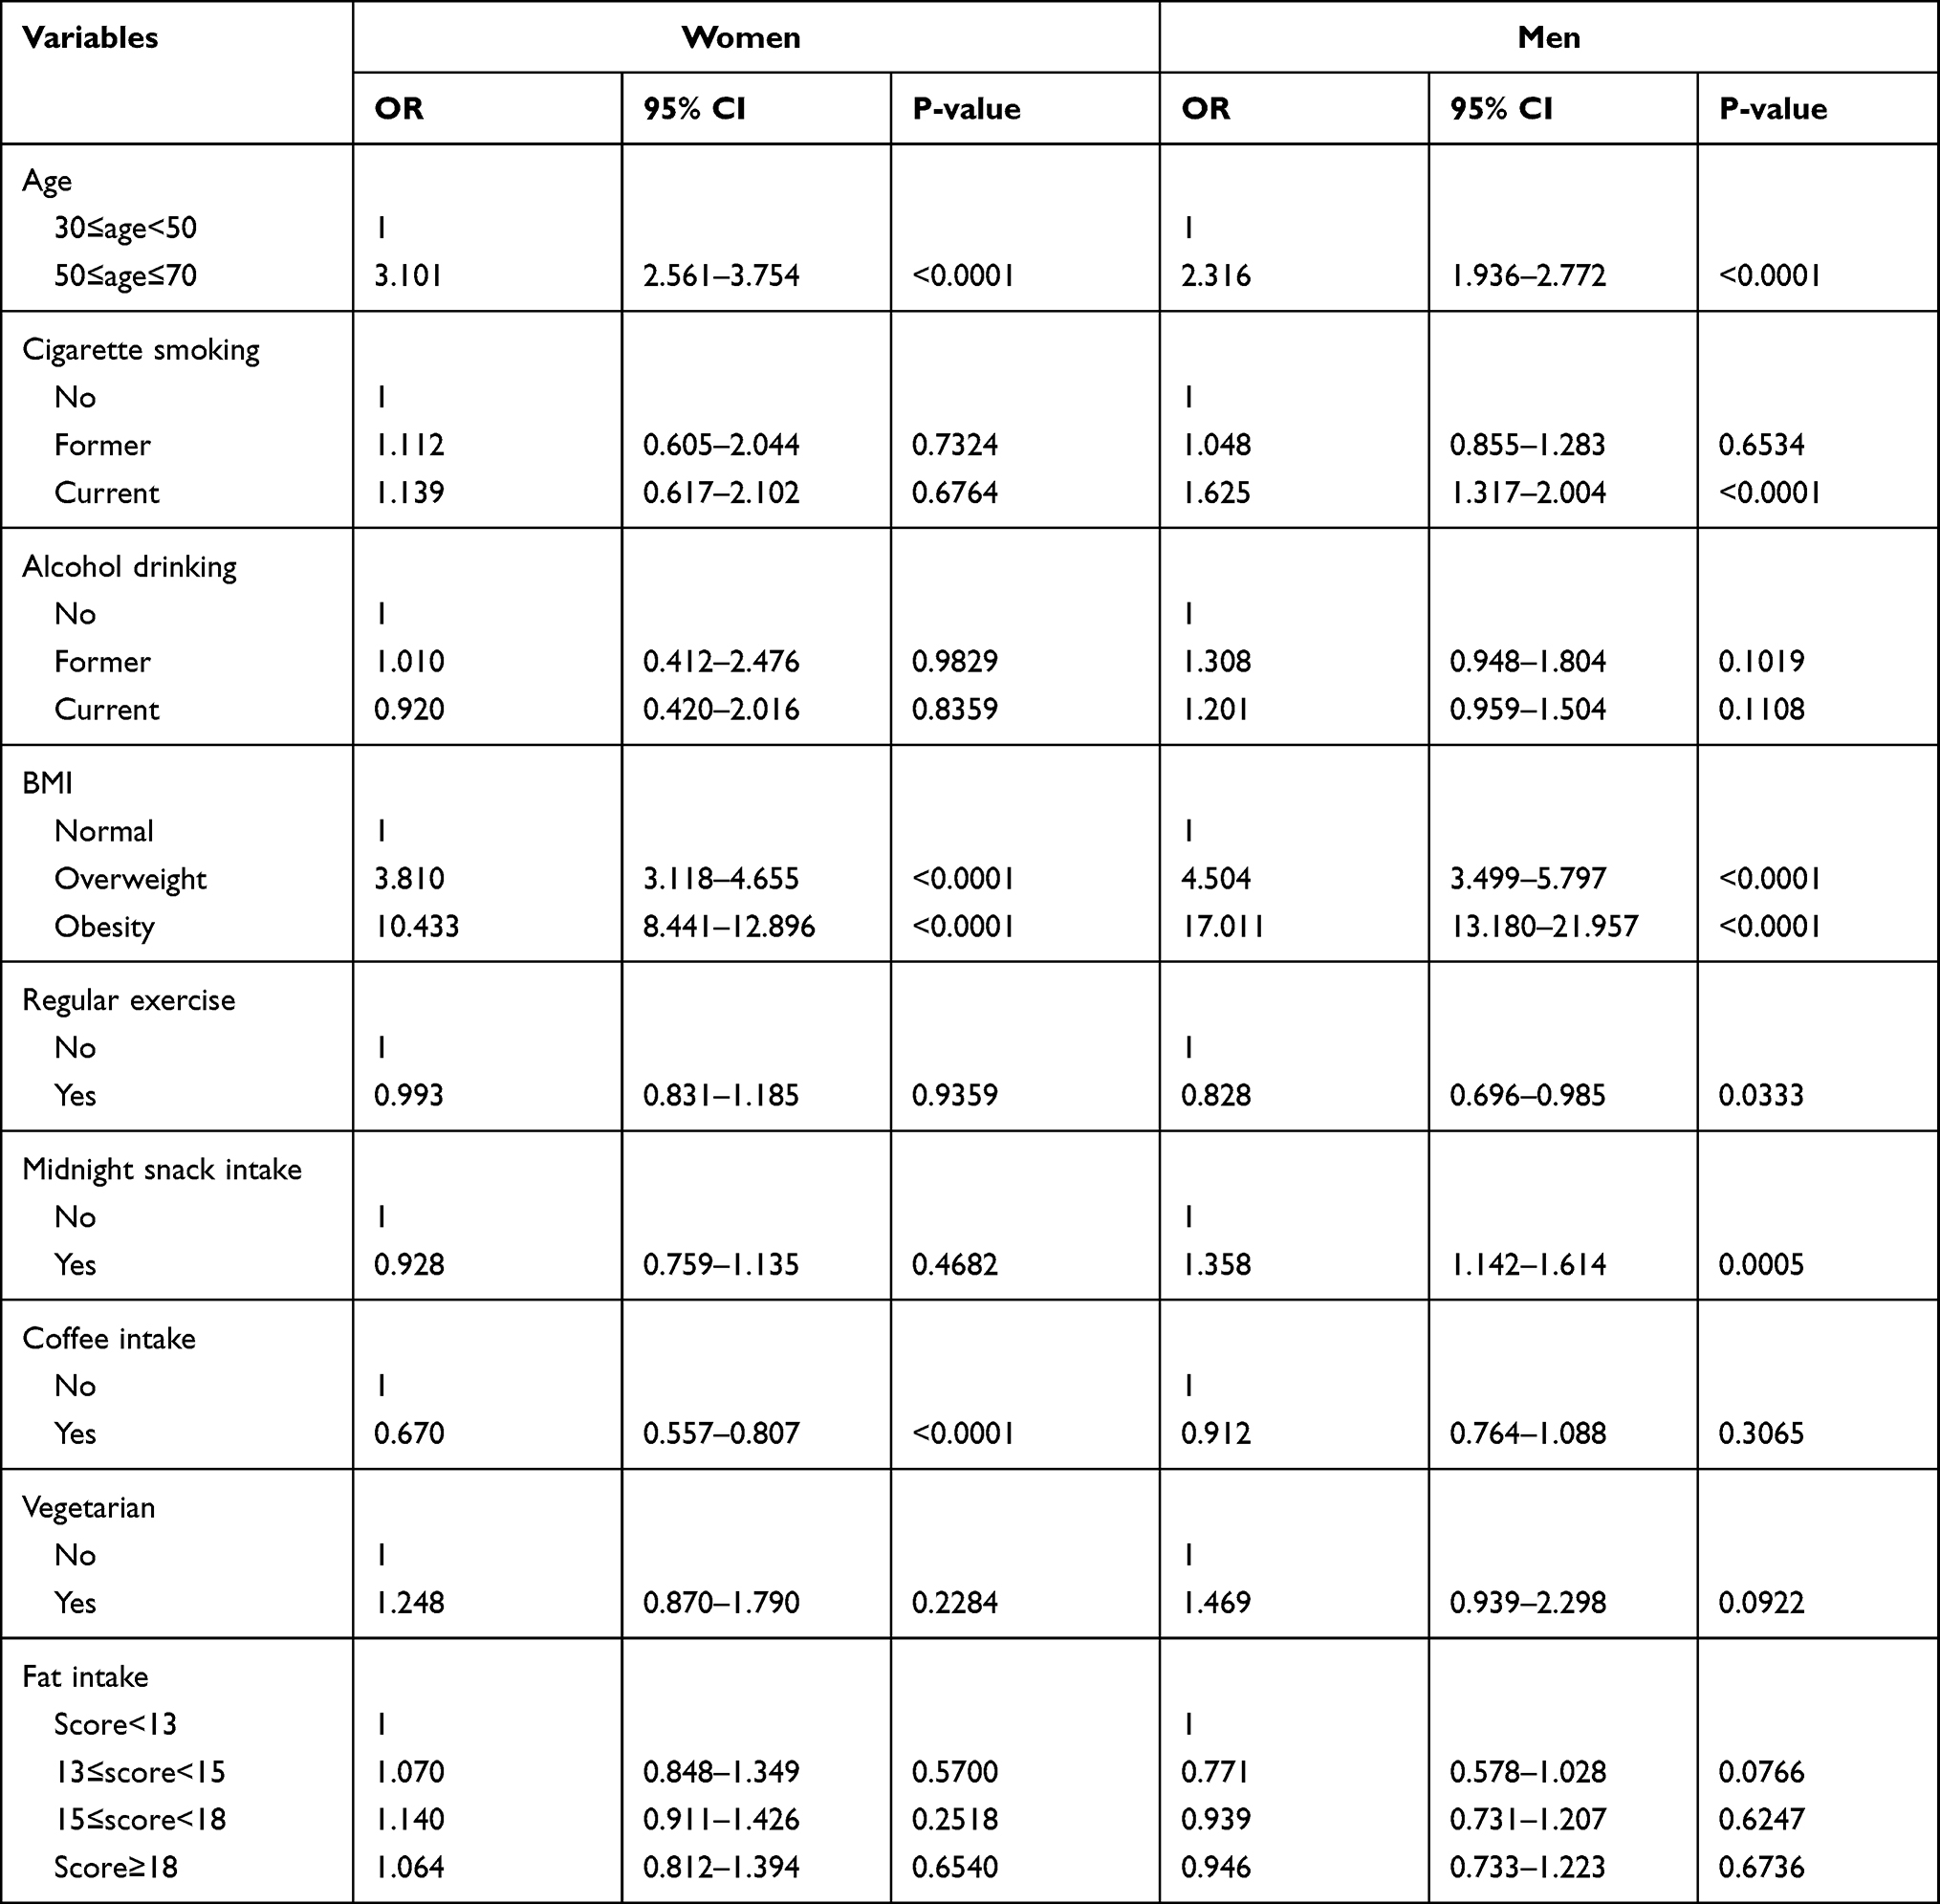 |
Table 3 Multiple Logistic Regression Analysis Showing the Association Between Age and Metabolic Syndrome Stratified by Sex |
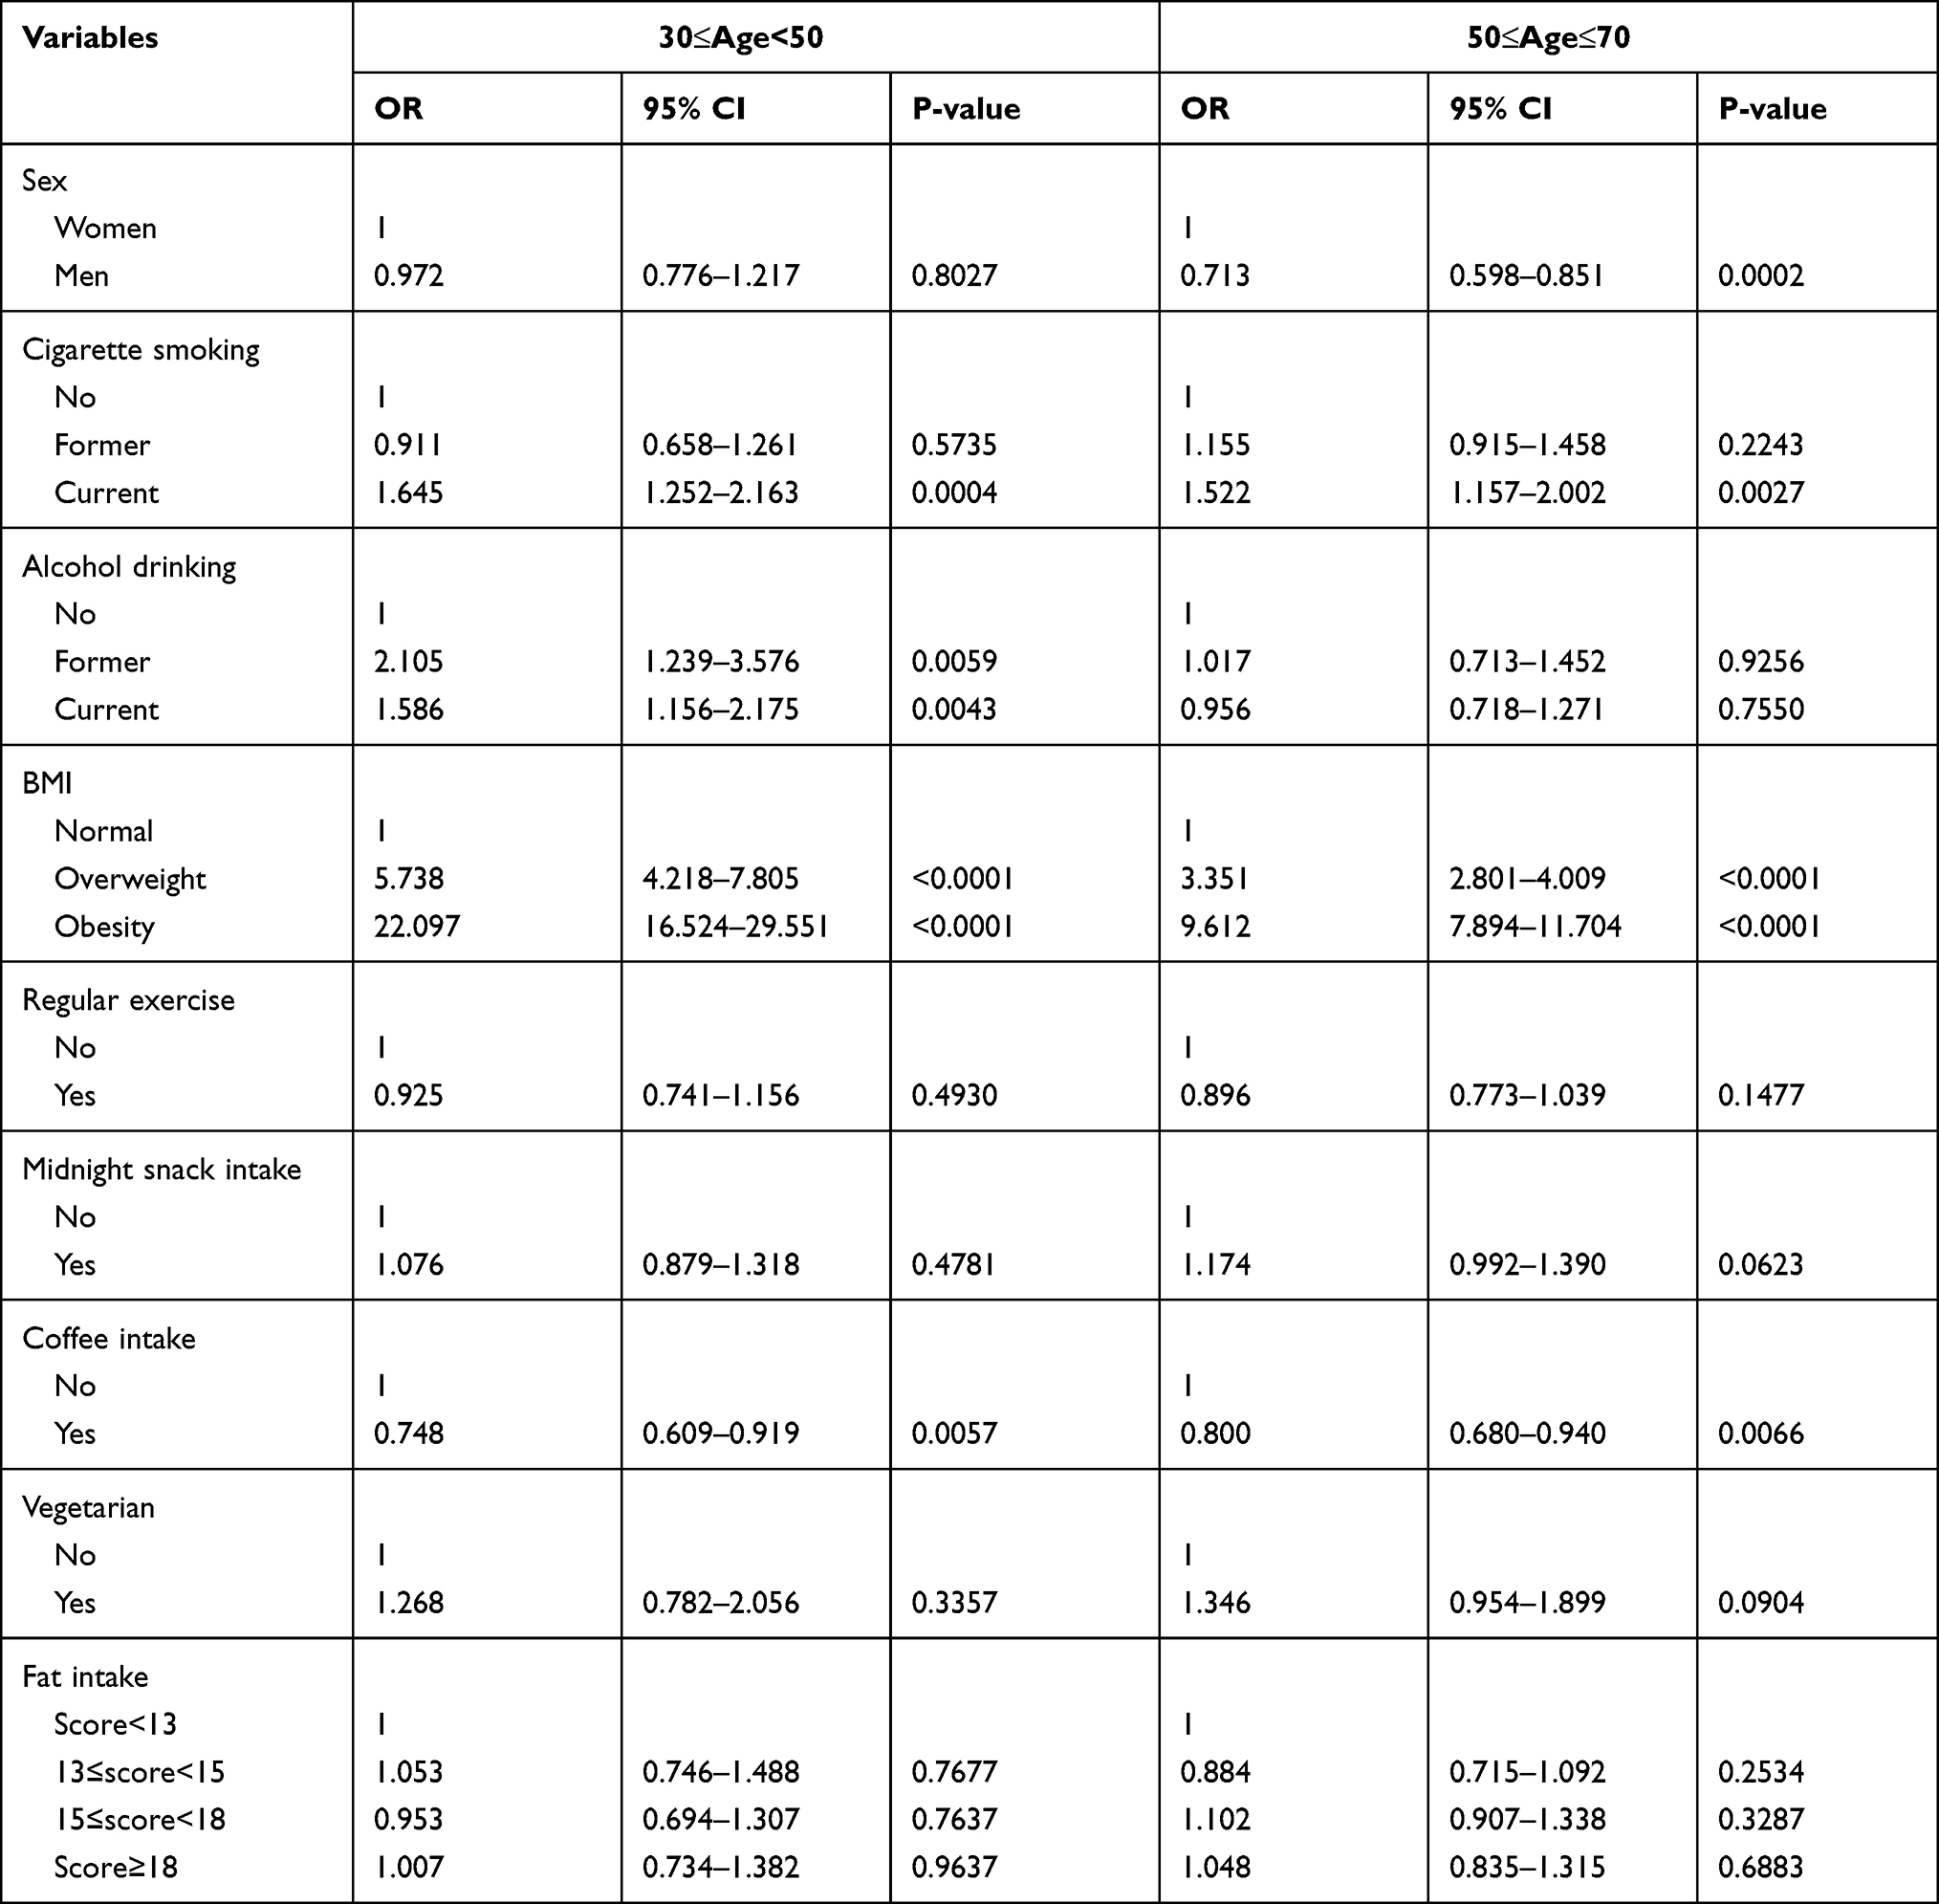 |
Table 4 Multiple Logistic Regression Analysis Showing the Association Between Sex and Metabolic Syndrome Stratified by Age |
With both sex and age combined and the reference group being women aged 30 to < 50 years, the risk of MS was significantly higher among both men and women aged 50 to 70 years. The ORs (95% CIs) were 3.387 (2.809–4.083) in women and 2.279 (1.863–2.788) in men (Table 5).
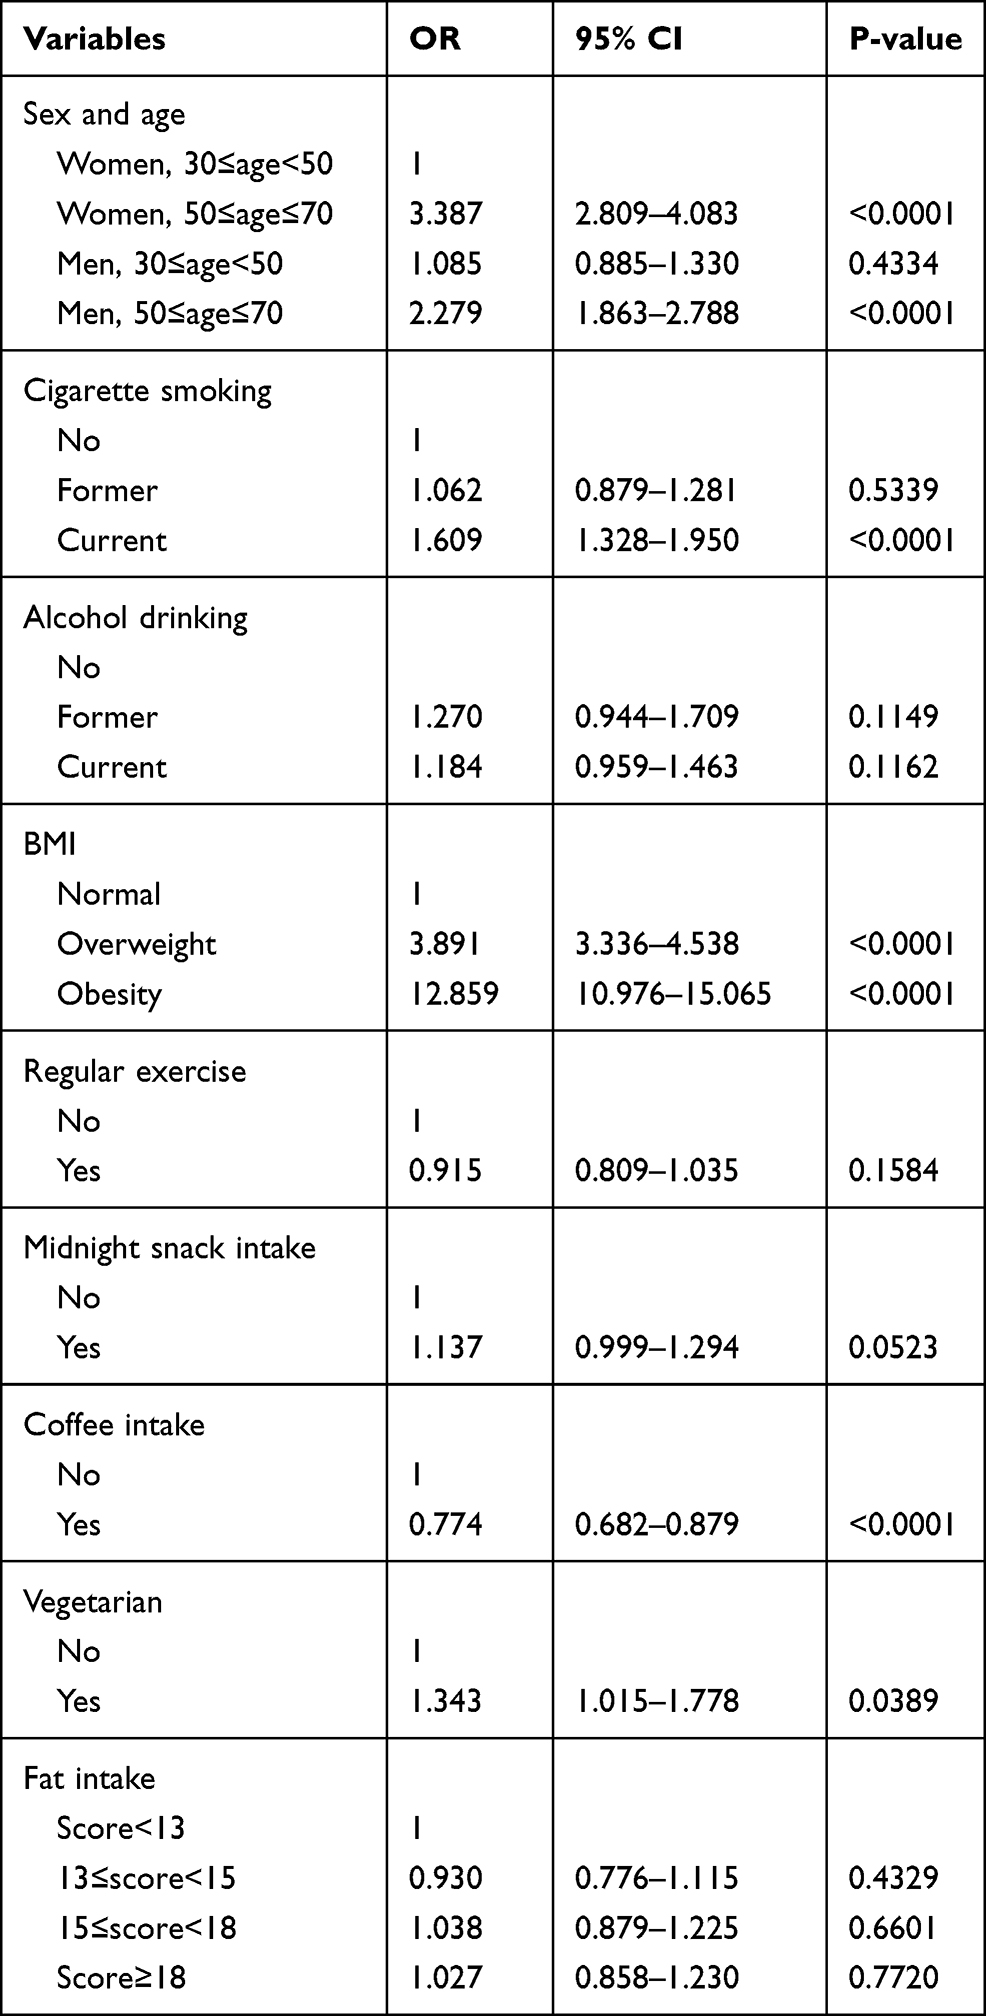 |
Table 5 Multiple Logistic Regression Analysis Showing the Association of Both Sex and Age with Metabolic Syndrome |
Discussion
Many studies conducted within the last two decades have reported inconsistent findings regarding the link between sex and MS.9–11,17–23,26–29 Previous studies among Taiwanese adults revealed significant associations between sex and MS and also an interplay between sex and age on the risk of MS.10,11,22,32,38,40 In the current study, we confirmed the individual association of sex and age with MS as well as an interplay of both factors on MS.
Based on data from the Nutrition and Health Survey in Taiwan (NAHSIT), the prevalence of MS increased from 13.6% between 1993 and 1996 to 25.5% between 2005 and 2008.11 The prevalence of MS among adults undergoing health checks between 2000 and 2001 at MJ health screening centers was 12.9%.22 Moreover, according to data from nationwide MJ Health Screening Centers, the prevalence among healthy non-alcoholic Taiwanese adults was 10.1% in 2000.45 In a nationwide cross-sectional study in 2002, the prevalence was 15.7%.10 In another cross-sectional study in 2004, the prevalence among residents of a metropolitan city aged 40 years and over was 30%.33 In other studies, the prevalence was 8.2% among company workers in Southern Taiwan in 2008,23 12.1% among workers in Changhua County during 2008–2012,37 12.0% among hospital employees in northern Taiwan in 2011,49 and 16.6% among company workers in Central Taiwan in 2012.50 The increase in the prevalence of MS over the past two decades could be attributed to an increase in the aging population, industrialization, and urbanization.
The sex-difference (low risk in men relative to women) in MS confirmed in this study is in line with previous studies.10,20,22,23,26,32,37,45,46,48,51–53 Even though a recent study among Taiwanese adults also showed a lower risk in men than women, the results were not statistically significant.54 The significant sex-age interaction on MS has also been confirmed in some studies.10,11,18,22,28,32,33,38,40 Like our results, age was directly associated with the prevalence of MS in Taiwanese10,51,52,54,55 and other populations.52,53,56,57 However, unlike our study, the prevalence in women was initially lower than in men but later increased rapidly, surpassing that in men, with a crossover effect occurring between both sexes at 60–69 years.10 Moreover, the prevalence in women aged < 45 years was lower than in men of the same age group, and there was a crossover between both sexes after age 45.11 Furthermore, women had a lower risk of MS compared with their male counterparts but became more vulnerable than men at and beyond 50 years.38
This study is limited in that we used qualitative rather than quantitative data to assess variables like smoking and exercise due to the unavailability of these data. Moreover, there was no information on the type of coffee or how coffee was consumed.
Conclusion
The interconnection between sex and age on MS among Taiwanese was confirmed in this study. Sex-wise, both men and women between 50–70 years had a higher likelihood of MS. However, the risk was much higher in women compared to men. Age-wise, men aged 50–70 years had a lower risk of MS compared to women of the same age group. However, the risk in men aged 30 to < 50 years was not significantly different from that in women of the same age group.
Funding
The Ministry of Science and Technology (MOST), Taiwan sponsored this work (MOST 109-2121-M-040-002).
Disclosure
The authors report no conflicts of interest in this work.
References
1. Ford E, Giles W, Dietz W. Prevalence of the metabolic syndrome among U.S. adults: findings from the third National Health and Nutrition Examination Survey. JAMA. 2002;287(3):356–359. doi:10.1001/JAMA.287.3.356
2. Eckel RH, Grundy SM, Zimmet PZ. The metabolic syndrome. Lancet. 2005;365(9468):1415–1428. doi:10.1016/S0140-6736(05)66378-7
3. Grundy SM, Cleeman JI, Daniels SR, et al. Diagnosis and management of the metabolic syndrome: an American Heart Association/National Heart, Lung, and Blood Institute scientific statement. Circulation. 2005;112:2735–2752. doi:10.1161/CIRCULATIONAHA.105.169404
4. Owen N, Bauman A, Brown W. Too much sitting: a novel and important predictor of chronic disease risk? Br J Sports Med. 2009;43(2):81–83. doi:10.1136/bjsm.2008.055269
5. Pradhan AD. Sex differences in the metabolic syndrome: implications for cardiovascular health in women. Clin Chem. 2014;60(1):44–52. doi:10.1373/clinchem.2013.202549
6. Cheong KC, Ghazali SM, Hock LK, et al. The discriminative ability of waist circumference, body mass index and waist-to-hip ratio in identifying metabolic syndrome: variations by age, sex and race. Diabetes Metab Syndr. 2015;9(2):74–78. doi:10.1016/j.dsx.2015.02.006
7. Scott CL. Diagnosis, prevention and intervention for the metabolic syndrome. Am J Cardiol. 2003;92:35i–42i. doi:10.1016/S0002-9149(03)00507-1
8. Park YW, Zhu S, Palaniappan L, Heshka S, Carnethon MR, Heymsfield SB. The metabolic syndrome: prevalence and associated risk factor findings in the US population from the third National Health and Nutrition Examination Survey, 1988–1994. Arch Intern Med. 2003;163(4):427–436. doi:10.1001/archinte.163.4.427
9. Chuang SY, Chen CH, Tsai ST, Chou P. Clinical identification of the metabolic syndrome in Kinmen. Acta Cardiol Sin. 2002;18(1):16–23.
10. Hwang LC, Bai CH, Chen CJ, Chien KL. Prevalence of obesity and metabolic syndrome in Taiwan. J Formos Med Assoc. 2006;105(8):626–635. doi:10.1016/S0929-6646(09)60161-3
11. Yeh CJ, Chang HY, Pan WH. Time trend of obesity, the metabolic syndrome and related dietary pattern in Taiwan: from NAHSIT 1993–1996 to NAHSIT 2005–2008. Asia Pac J Clin Nutr. 2011;20:292–300.
12. O’Neill S, O’Driscoll L. Metabolic syndrome: a closer look at the growing epidemic and its associated pathologies. Obes Rev. 2015;16:1–12. doi:10.1111/obr.12229
13. Fiaz M, Shaiq PA, Raj GK, et al. Association study of Apolipoprotein A5 gene (APOA5 gene) variant with the metabolic syndrome in local Pakistani population. J Pak Med Assoc. 2019;69(3):301–305.
14. Domanski M, Proschan M, Maryland B. The metabolic syndrome. J Am Coll Cardiol. 2004;43(8):1396–1398. doi:10.1016/j.jacc.2004.01.021
15. Yaffe K. Metabolic syndrome and cognitive disorders: is the sum greater than its parts? Alzheimer Dis Assoc Disord. 2007;21(2):167–171. doi:10.1097/WAD.0b013e318065bfd6
16. Susatika K, Dwipayana P, Saraswati IMR, et al. Relationship between age and metabolic disorders in the population of Bali. J Clin Gerontol Geriatr. 2011;2:47–52. doi:10.1016/j.jcgg.2011.03.001
17. Marquezine GF, Oliveria CA, Pereira AC, Krieger JE, Mill JG. Metabolic syndrome determinants in an urban population from Brazil: social class and gender-specific interaction. Int J Cardiol. 2007;129(2):259–265. doi:10.1016/j.ijcard.2007.07.097
18. Zuo H, Shi Z, Hu X, Wu M, Guo Z, Hussain A. Prevalence of metabolic syndrome and factors associated with its components in Chinese adults. Metabolism. 2009;58(8):1102–1108. doi:10.1016/j.metabol.2009.04.008
19. Beigh SH, Jain S. Prevalence of metabolic syndrome and gender differences. Bioinformation. 2012;8(13):613–616. doi:10.6026/97320630008613
20. Via-Sosa MA, Toro C, Travé P, March MA. Screening premorbid metabolic syndrome in community pharmacies: a cross-sectional descriptive study. BMC Public Health. 2014;14(1):1–11. doi:10.1186/1471-2458-14-487
21. Sigit FS, Tanpary DL, Trompet S, et al. The prevalence of metabolic syndrome and its association with body fat distribution in middle-aged individuals from Indonesia and the Netherlands: a cross-sectional analysis of two population-based studies. Diabetol Metab Syndr. 2020;12:2. doi:10.1186/s13098-019-0503-1.
22. Chuang SY, Chen CH, Chou P. Prevalence of metabolic syndrome in a large health check-up population in Taiwan. J Chin Med Assoc. 2004;67(12):611–620.
23. Tsai TY, Cheng JF, Lai YM. Prevalence of metabolic syndrome and related factors in Taiwanese high-tech industry workers. Clinics. 2011;66(9):1531–1535. doi:10.1590/S1807-59322011000900004
24. Reilly M, Rader D. The metabolic syndrome. More than the sum of its parts. Circulation. 2003;108:1546–1551. doi:10.1161/01.CIR.0000088846.10655.E0
25. Cameron AJ, Shaw JE, Zimmet PZ. The metabolic syndrome: prevalence in worldwide populations. J Clin Endocrinol Metab. 2004;33(2):351–375. doi:10.1016/j.ecl.2004.03.005
26. Lin CH, Lia S, Liu CS. Prevalence of metabolic syndrome in Taiwanese adults: a hospital-based study. Ann Saudi Med. 2006;26(1):46–48. doi:10.5144/0256-4947.2006.46
27. Joy T, Hegele RA. Genetics of metabolic syndrome: is there a role for phenomics? Curr Atheroscler Rep. 2008;10:201–208. doi:10.1007/s11883-008-0032-0
28. Denys K, Cankurtaran M, Janssens W, Petrovic M. Metabolic syndrome in the elderly: an overview of the evidence. Acta Clin Belg. 2009;64(1):23–34. doi:10.1179/acb.2009.006
29. Lin E, Kuo PH, Liu YL, Yang AC, Kao CF, Tsai SJ. Effects of circadian clock genes and health-related behavior on metabolic syndrome in a Taiwanese population: evidence from association and interaction analysis. PLoS One. 2017. doi:10.1371/journal.pone.0173861
30. Lee S, Ko Y, Kwak G, Yim ES. Gender differences in metabolic syndrome components among the Korean 66-year-old population with metabolic syndrome. BMC Geriatr. 2016;16:27. doi:10.1186/s12877-016-0202-9.
31. Hu G, Qiao Q, Tuomilehto J, Balkau B, Borch-Johnsen K, Pyorala K. Prevalence of the metabolic syndrome and its relation to all-cause and cardiovascular mortality in nondiabetic European men and women. Arch Intern Med. 2004;164(10):1066–1076. doi:10.1001/archinte.164.10.1066
32. Hwang LC, Bai CH, Chen CJ, Chien KL. Gender difference on the development of metabolic syndrome: a population-based study in Taiwan. Eur J Epidemiol. 2007;22:899–906. doi:10.1007/s10654-007-9183-5
33. Lin CC, Liu CS, Lai MM, et al. Metabolic syndrome in a Taiwanese metropolitan adult population. BMC Public Health. 2007;7:239. doi:10.1186/471-2458-7-239
34. Arai H, Yamamoto A, Matsuzawa Y, et al. Prevalence of the metabolic syndrome in elderly and middle-aged Japanese. J Clin Gerontol Geriatr. 2010;1:42–47. doi:10.1016/j.jcgg.2010.10.011
35. Vishram VKK, Borglykke A, Andreasen AH, et al. Impact of age and gender on the prevalence and prognostic importance of the metabolic syndrome and its components in Europeans. The MORGAM prospective cohort project. PLoS One. 2014;9(9):e107294. doi:10.1371/journal.pone.0107294
36. Grosso G, Marventano S, Galvano F, Pajak A, Mistretta A. Factors associated with metabolic syndrome in a Mediterranean population: role of caffeinated beverages. J Epidemiol. 2014;24(4):327–333. doi:10.2188/jea.JE20130166
37. Wei CY, Sun CC, Wei JCC, et al. Association between hyperuricemia and metabolic syndrome: an epidemiological study of a labor force population in Taiwan. Biomed Res Int. 2015;2015:369179. doi:10.1155/2015/369179
38. Tian X, Xu X, Zhang K, Wang H. Gender difference of metabolic syndrome and its association with dietary diversity at different ages. Oncotarget. 2017;8(43):73568–73578. doi:10.18632/oncotarget.20625
39. Lin CC, Chen SH, Huang LY. Effectiveness of an interdisciplinary health education intervention on metabolic syndrome in community residents: a study of four towns in Northern Taiwan. J Nurs. 2018;65(4):36–48. doi:10.6224/JN.20180865_(4).07
40. Hsiao YC, Wang K, Bair MJ. Prevalence of obesity and metabolic syndrome in aboriginals in Southeastern Taiwan: a hospital-based study. J Intern Med Taiwan. 2011;22(1):48–56. doi:10.6314/JIMT.2011.22(1).06
41. Kim HL, Lee JM, Seo JB, et al. The effects of metabolic syndrome and its components on arterial stiffness in relation to gender. J Cardiol. 2015;65(3):243–249. doi:10.1016/j.jjcc.2014.05.009
42. Regitz-Zagrosek V, Lehmkuhl E, Weickert MO. Gender differences in the metabolic syndrome and their role for cardiovascular disease. Clin Res Cardiol. 2006;95(3):136–147. doi:10.1007/s00392-006-0351-5
43. Furuta M, Shimazakvishi Y, Takeshita T, et al. Gender differences in the association between metabolic syndrome and periodontal disease: the Hisayama Study. J Clin Periodontol. 2013;40:743–752. doi:10.1111/jcpe.12119
44. Gu D, Reynolds K, Wu X, et al.; InterASIA Collaborative Group. Prevalence of the metabolic syndrome and overweight among adults in China. Lancet. 2005;365:1398–1405. doi:10.1016/S0140-6736(05)66375-1.
45. Shen YH, Yang WS, Lee TH, Lee LT, Chen CY, Huang KC. Bright liver and alanine aminotransferase and associated with metabolic syndrome in adults. Obes Res. 2005;13(7):1238–1245. doi:10.1038/oby.2005.147
46. Lien CN, Tang YJ, Liu PH, Liu SW. Optimal BMI cutoffs to predict metabolic syndrome among the employees in a hospital of middle Taiwan. Taiwan J Fam Med. 2009;19(3):144–151. doi:10.7023/TJFM.200909.014
47. Bener A, Mohammad AG, Ismail AN, Zirie M, Abdullatef WK, AI-Hamaq AOAA. Gender and age-related differences in patients with the metabolic syndrome in a highly endogamous population. Bosn J Basic Med Sci. 2010;10(3):210–217. doi:10.17305/bjbms.2010.2687
48. Novak M, Bjo L, Welin L, Manhem K, Rosengren A, Rosengren A. Gender differences in the prevalence of metabolic syndrome in 50-year-old Swedish men and women with hypertension born in 1953. J Hum Hypertens. 2013;27:56–61. doi:10.1038/jhh.2011.106
49. Yeh WC, Chuang HH, Lu MC, Tzeng IS, Chen JY. Prevalence of metabolic syndrome among employees of a Taiwanese hospital varies according to profession. Medicine. 2018;97(31):e11664. doi:10.1097/MD.0000000000011664
50. Huang JH, Li RH, Huang SL, et al. Relationships between different types of physical activity and metabolic syndrome among Taiwanese workers. Sci Rep. 2017;7:13735. doi:10.1038/s41598-017-13872-5
51. Huang T, Chan T-C, Huang Y-J, Pan W-C. The association between noise exposure and metabolic syndrome: a longitudinal cohort study in Taiwan. Int J Environ Res Public Health. 2020;17(12):4236. doi:10.3390/ijerph17124236
52. Ajlouni K, Khader Y, Alyousfi M, Al Nsour M, Batieha A, Jaddou H. Metabolic syndrome amongst adults in Jordan: prevalence, trend, and its association with socio-demographic characteristics. Diabetol Metab Syndr. 2020;12(1):1–11. doi:10.1186/s13098-020-00610-7
53. Gouveia ÉR, Gouveia BR, Marques A, et al. Predictors of metabolic syndrome in adults and older adults from Amazonas, Brazil. Int J Environ Res Public Health. 2021;18(3):1303. doi:10.3390/ijerph18031303
54. Tsao Y-C, Li W-C, Yeh W-C, Ueng SW-N, Chiu SY-H, Chen J-Y. The association between metabolic syndrome and related factors among the community-dwelling indigenous population in Taiwan. Int J Environ Res Public Health. 2020;17(23):8958. doi:10.3390/ijerph17238958
55. Tsou MT, Pai TP, Chiang TM, Huang WH, Lin HM, Lee SC. Burnout and metabolic syndrome among different departments of medical center nurses in Taiwan‐Cross‐sectional study and biomarker research. J Occup Health. 2021;63(1):e12188. doi:10.1002/1348-9585.12188
56. Ahmed A, Akhter J, Iqbal R, et al. Prevalence and associations of metabolic syndrome in an urban high diabetes risk population in a low/middle-income country. Metab Syndr Relat Disord. 2020;18(5):234–242. doi:10.1089/met.2019.0098
57. Bae C-Y, Piao M, Kim M, et al. Biological age and lifestyle in the diagnosis of metabolic syndrome: the NHIS health screening data, 2014–2015. Sci Rep. 2021;11(1):1–11. doi:10.1038/s41598-020-79256-4
 © 2021 The Author(s). This work is published and licensed by Dove Medical Press Limited. The full terms of this license are available at https://www.dovepress.com/terms.php and incorporate the Creative Commons Attribution - Non Commercial (unported, v3.0) License.
By accessing the work you hereby accept the Terms. Non-commercial uses of the work are permitted without any further permission from Dove Medical Press Limited, provided the work is properly attributed. For permission for commercial use of this work, please see paragraphs 4.2 and 5 of our Terms.
© 2021 The Author(s). This work is published and licensed by Dove Medical Press Limited. The full terms of this license are available at https://www.dovepress.com/terms.php and incorporate the Creative Commons Attribution - Non Commercial (unported, v3.0) License.
By accessing the work you hereby accept the Terms. Non-commercial uses of the work are permitted without any further permission from Dove Medical Press Limited, provided the work is properly attributed. For permission for commercial use of this work, please see paragraphs 4.2 and 5 of our Terms.