")
Back to Journals » Nature and Science of Sleep » Volume 14
Association Between Triglyceride Glucose Index-Waist Circumference and Risk of First Myocardial Infarction in Chinese Hypertensive Patients with Obstructive Sleep Apnoea: An Observational Cohort Study
Authors Hu J, Cai X , Li N , Zhu Q, Wen W , Hong J, Zhang D, Yao X, Luo Q, Sun L
Received 11 February 2022
Accepted for publication 6 May 2022
Published 19 May 2022 Volume 2022:14 Pages 969—980
DOI https://doi.org/10.2147/NSS.S362101
Checked for plagiarism Yes
Review by Single anonymous peer review
Peer reviewer comments 2
Editor who approved publication: Professor Ahmed BaHammam
Junli Hu,1– 5,* Xintian Cai,1– 5,* Nanfang Li,1– 5 Qing Zhu,1– 5 Wen Wen,1– 5 Jing Hong,1– 5 Delian Zhang,1– 5 Xiaoguang Yao,1– 5 Qin Luo,1 Le Sun1– 5
1Hypertension Center, People’s Hospital of Xinjiang Uygur Autonomous Region, Urumqi, Xinjiang, People’s Republic of China; 2Xinjiang Hypertension Institute, People’s Hospital of Xinjiang Uygur Autonomous Region, Urumqi, Xinjiang, People’s Republic of China; 3National Health Committee Key Laboratory of Hypertension Clinical Research, People’s Hospital of Xinjiang Uygur Autonomous Region, Urumqi, Xinjiang, People’s Republic of China; 4Key Laboratory of Xinjiang Uygur Autonomous Region, People’s Hospital of Xinjiang Uygur Autonomous Region, Urumqi, Xinjiang, People’s Republic of China; 5Xinjiang Clinical Medical Research Center for Hypertension Diseases, People’s Hospital of Xinjiang Uygur Autonomous Region, Urumqi, Xinjiang, People’s Republic of China
*These authors contributed equally to this work
Correspondence: Nanfang Li, Hypertension Center, People’s Hospital of Xinjiang Uygur Autonomous Region, Urumqi, Xinjiang, People’s Republic of China, Tel/Fax +86 991-8564818, Email [email protected]
Purpose: This study aimed to investigate the association between triglyceride glucose index-waist circumference (TyG-WC) and the risk of first myocardial infarction (MI) in Chinese hypertensive patients with obstructive sleep apnoea (OSA).
Methods: This study was an observational cohort study. A total of 2224 Chinese hypertensive patients with OSA without a history of MI were included in this study. Hazard ratio (HR) and 95% confidence interval (CI) were estimated using multivariable Cox proportion hazard models. A generalized additive model was used to identify nonlinear relationships. Additionally, we performed hierarchical analysis and test for interaction.
Results: During a median follow-up of 7.15 years, 85 incidents of MI developed. Overall, there was a positive association between TyG-WC and the risk of first MI. In the multivariable-adjusted model, the risk of MI increased with quartiles of the TyG-WC, the HR in quartile 4 versus quartile 1 was 4.29. A generalized additive model and a smooth curve fitting showed that there existed a similar J-shaped association between TyG-WC and the risk of first MI, with an inflection point at about 785.
Conclusion: Elevated levels of the baseline TyG-WC are associated with an increased risk of first MI. This finding indicates that the TyG-WC might be useful to identify the high risk of first MI in Chinese hypertensive patients with OSA.
Keywords: triglyceride glucose index-waist circumference, myocardial infarction, hypertension, obstructive sleep apnoea, cohort study
Introduction
Myocardial infarction (MI) remains a major cause of morbidity and mortality, resulting in a significant social and economic burden.1 In the United States alone, more than 1,000,000 people suffer from MI each year.2 The Global Registry of Acute Coronary Events (GRACE) study showed that patients with MI have a mortality rate of approximately 15% after 1 year and a cumulative mortality rate of up to 20% after 5 years.3 Therefore, a better understanding of the risk factors for MI is needed to develop additional preventive strategies.
The triglyceride glucose index (TyG) was first proposed and validated by Simental-Mendía et al in 2008.4 This index is a composite of fasting glucose (FPG) and triglycerides (TG) and is a reliable alternative to insulin resistance (IR).4 The TyG index has shown better performance in assessing IR, in some cases even better than the steady-state model assessment of IR (HOMA-IR).5–8 IR, a decrease in insulin sensitivity in peripheral tissues characterized by defective glucose uptake and oxidation, plays a key role in the pathogenesis of the cardiovascular disease (CVD).9,10 Molecular mechanisms include the role of IR in vascular function, macrophage accumulation, and atherosclerosis progression.9–11 Several studies have found a positive association between TyG index and cardiovascular risk, including carotid atherosclerosis, obstructive sleep apnea (OSA), hypertension, coronary artery calcification, and CVD.12–19 Levels of TyG also tend to vary by population, meaning that TyG cut-off values in the general population for CVD risk may be different in specific populations. Waist circumference (WC) is a simple, inexpensive, non-invasive anthropometric parameter that directly reflects abdominal obesity.20–22 Most importantly, some studies have found that TyG-related markers that incorporate obesity indices, such as TyG-WC, are more effective as surrogate markers to reflect the degree of IR than TyG.23,24
OSA affects approximately 20–30% of the general population and is considered a significant public health problem.25 Most patients with OSA often have a combination of abdominal obesity, hyperglycemia, and dyslipidemia.26–31 The coexistence of a cluster of risk factors and OSA has a complex and far more serious impact on the cardiovascular than either of these conditions on their own.32–35 Observational studies have found that the prevalence of OSA exceeds 30% in patients with hypertension and approaches 80% in patients with refractory hypertension.36 Numerous studies have confirmed that both hypertension and OSA are independent risk factors for MI and cardiovascular mortality.36,37 Therefore, early risk stratification for patients with hypertension combined with OSA is important for the prevention and management of MI.
To the best of our knowledge, the relationship between TyG-WC levels and clinical outcomes in Chinese hypertensive patients with OSA has not been fully evaluated. Therefore, the purpose of our study was to examine the association of the TyG-WC, an easily assessed on a routine clinical basis IR risk marker, with the presence of the first MI in Chinese hypertensive patients with OSA.
Materials and Methods
Study Design and Subjects
Data were obtained from the Urumqi Research on Sleep Apnea and Hypertension (UROSAH) study, an observational cohort study conducted in Urumqi, China. Details of the study design have been previously described.38 Briefly, a total of 3605 hypertensive patients aged >18 years with suspected OSA agreed to participate and completed the first survey from January 2011 to December 2013. A total of 276 cases were lost to follow-up, and the rate of loss to follow-up was 7.66%. In the current study, we used the TyG-WC index at baseline to predict the risk of subsequent MI. We excluded non-OSA participants, participants with prior MI, and those with missing data on WC, TG, and FPG levels at baseline. Therefore, 2224 participants were included in this analysis. The patient recruitment flow chart is shown in Figure 1.
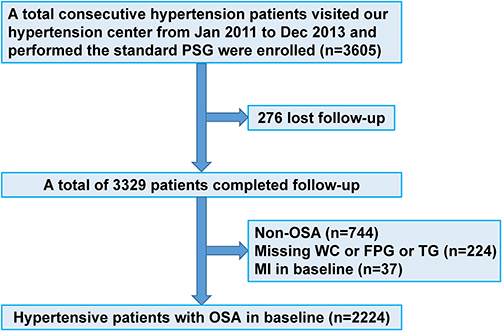 |
Figure 1 Participant flow diagram. |
Baseline Examination
All participants completed a baseline examination between 2011 and 2013. Data on demographic characteristics, lifestyle, personal disease records, history of routine continuous positive airway pressure (CPAP) treatment, and medication history were gathered from medical records for all participants.
Anthropometric measurements were taken by trained nurses. Data for height, weight, and WC were acquired following a protocol standardized to an accuracy of 0.1 kg and 0.1 cm, respectively. During the measurements, participants were asked to wear light clothing, no hats, and no shoes. At the end of normal expiration, WC was measured from the midpoint between the lower ribs and the upper edge of the iliac crest to the nearest 0.1 cm. BMI was calculated as weight divided by the square of height (kg/m2). Smoking and drinking habits were categorized as never, and current. In this study, patients with mild OSA did not receive CPAP. CPAP compliance was divided into regular and irregular treatment. CPAP pressure prescriptions were individualized by the sleep physicians of subjects with moderate to severe OSA based on clinical care. Regular CPAP treatment was defined as >70% of the average treatment time ≥4 hours/night throughout the follow-up period, or an average of ≥4 hours per night (CPAP devices were only available for cumulative hours of use).38–40
Laboratory Assays
Peripheral venous blood was collected after an 8–10 hour fast to measure FPG, total cholesterol (TC), high-density lipoprotein (HDL-c), low-density lipoprotein (LDL-c), TG, homocysteine (Hcy), creatinine (Cr) levels. Biochemical testing was measured in the testing center of our hospital using standard techniques. Participants were asked to refrain from caffeine, alcohol, smoking, and strenuous activities for 12h before blood collection. The estimated glomerular filtration rate (eGFR) was calculated by using the equation originating from the Chronic Kidney Disease Epidemiology Collaboration (CKD-EPI) equation.41
Nocturnal Polysomnography Measurements
The details of the polysomnography (PSG) and scoring criteria used in this study are provided in the Supplementary Information. Briefly, each patient received an overnight PSG examination. PSG tests were scored at a centralized reading center (Urumqi, China), using standard scoring criteria from the American Academy of Sleep Medicine.42 The apnea-hypopnea index (AHI) was calculated as the total number of apneas and hypopneas per hour of sleep. Apnoea was defined as a 90% decrease in airflow lasting for at least 10 seconds. Hypopneas were defined by ≥30% decrement in the amplitude of nasal pressure flow signal for at least 10 seconds, associated with a 4% arterial oxygen desaturation (with or without arousal).42
Definitions
Hypertension was defined as an SBP ≥140 mmHg or DBP ≥90 mmHg or the use of any antihypertensive medication. Diabetes was defined as fasting glucose ≥7.0 mmol/L, use of any glucose-lowering medication, or self-reported history of diabetes. OSA was defined as AHI ≥5. In addition, the severity of OSA was defined as mild OSA (5 ≤ AHI <15), moderate OSA (15 ≤ AHI < 30), and severe OSA (AHI ≥ 30).42 The TyG-WC was calculated as the Ln [(triglyceride (mg/dl) × glucose (mg/dl)/2] × WC (cm).4
Follow-Up and Assessment of MI
Upon entry into this cohort, recipients were followed up for the first occurrence of MI (fatal and non-fatal). Outcomes were obtained by outpatient follow-up, telephone interviews, and inpatient medical records. Deaths due to myocardial infarction were verified by hospital death certificates and in consultation with population management. All clinical events were confirmed by medical documentation and certified by our tertiary care hospital clinical events committee. Follow-up began with the first visit and ended in January 2021.
Statistical Analyses
Baseline characteristics were expressed as mean ± standard deviation (SD) or median [interquartile range (IQR)] of continuous variables, Categorical variables are presented as frequency and percentage. Statistical significance of differences in baseline characteristics was assessed by baseline the TyG-WC quartiles (≤822.63, 822.74 to <898.03, 898.04 to <972.85, and ≥972.94) using the chi-square test, one-way analysis of variance, or Kruskal–Wallis test accordingly to compare the baseline characteristics of subgroups across TyG-WC quartiles. The Kaplan-Meier method was performed to evaluate the incidence rate of first MI and differences among the TyG-WC quartiles groups by the Log rank test.
Before building the Cox regression model, we evaluated the covariance between variables according to the variance inflation factor (VIF) (Table S2). Variables with VIF > 5 were considered inappropriate for inclusion in the Cox regression model.43,44 We eliminated two variables with multicollinearity (AHI, and Cr). Three multivariate Cox proportional hazard regressions were established to estimate the independent association between baseline the TyG-WC and the risk of first MI, and hazard ratios (HRs) and 95% confidence intervals (CIs) were calculated. Model 1 only adjusted for the basic demographic data (age, BMI, diabetes, smoking status, drinking status, SBP, and DBP); Model 2 was further adjusted for TC, TG, HDL-c, LDL-c, FPG, Hcy, lipid-lowering drugs, antiplatelet drugs, antidiabetic drugs, antihypertensive drugs, and regular CPAP treatment. The P values for the trend test were calculated in the regression models after the median value in each quartile of the TyG-WC was entered into the model as ordinal variables.
A generalized additive model was used to evaluate the nonlinear relationship between baseline TyG-WC levels and the occurrence of the first MI. Based on the smoothing curve, a two-piecewise linear regression model was further developed to identify threshold effects, with adjustment for potential confounders. The threshold level of the baseline of the TyG-WC was determined using a recurrence method that involved selecting an inflection point along with a predetermined interval and choosing the turning point that produced the maximum likelihood model. A log-likelihood ratio test was used to compare the two-piecewise linear regression model with the one-linear model.
We also performed stratified analyses to examine the potential modification effects of the following factors: age, gender, BMI, SBP, DBP, diabetes, smoking status, drinking status, eGFR, Hcy, and AHI. Test for interaction in the Cox proportional hazards regression models were used to compare HRs between the analyzed subgroups.
Statistical analyses were conducted by using the software R, version 4.0.1 (The R Foundation, Vienna, Austria), and a two-sided P < 0.05 indicated significance.
Results
Baseline Characteristics
A total of 2224 participants were included in this observational cohort study. The median age was 48 years (IQR, 42–56) and 1611 (68.55%) were male. Baseline characteristics by quartiles of the TyG-WC are shown in Table 1. Statistically significant differences were found for most variables in the TyG-WC quartiles, except for SBP, LDL-c, Hcy, and the use of antihypertensive drugs. Participants with a higher TyG-WC tended to be young, men, more current smokers and alcohol drinkers, a higher prevalence of diabetes, have higher BMI, DBP, TC, TG, FPG, eGFR, Cr, AHI, and lower HDL-c compared with participants in quartile 1 group. Participants with a higher TyG-WC had more CVD risk factors and greater use of antiplatelet, lipid-lowering medications, and regular CPAP treatment.
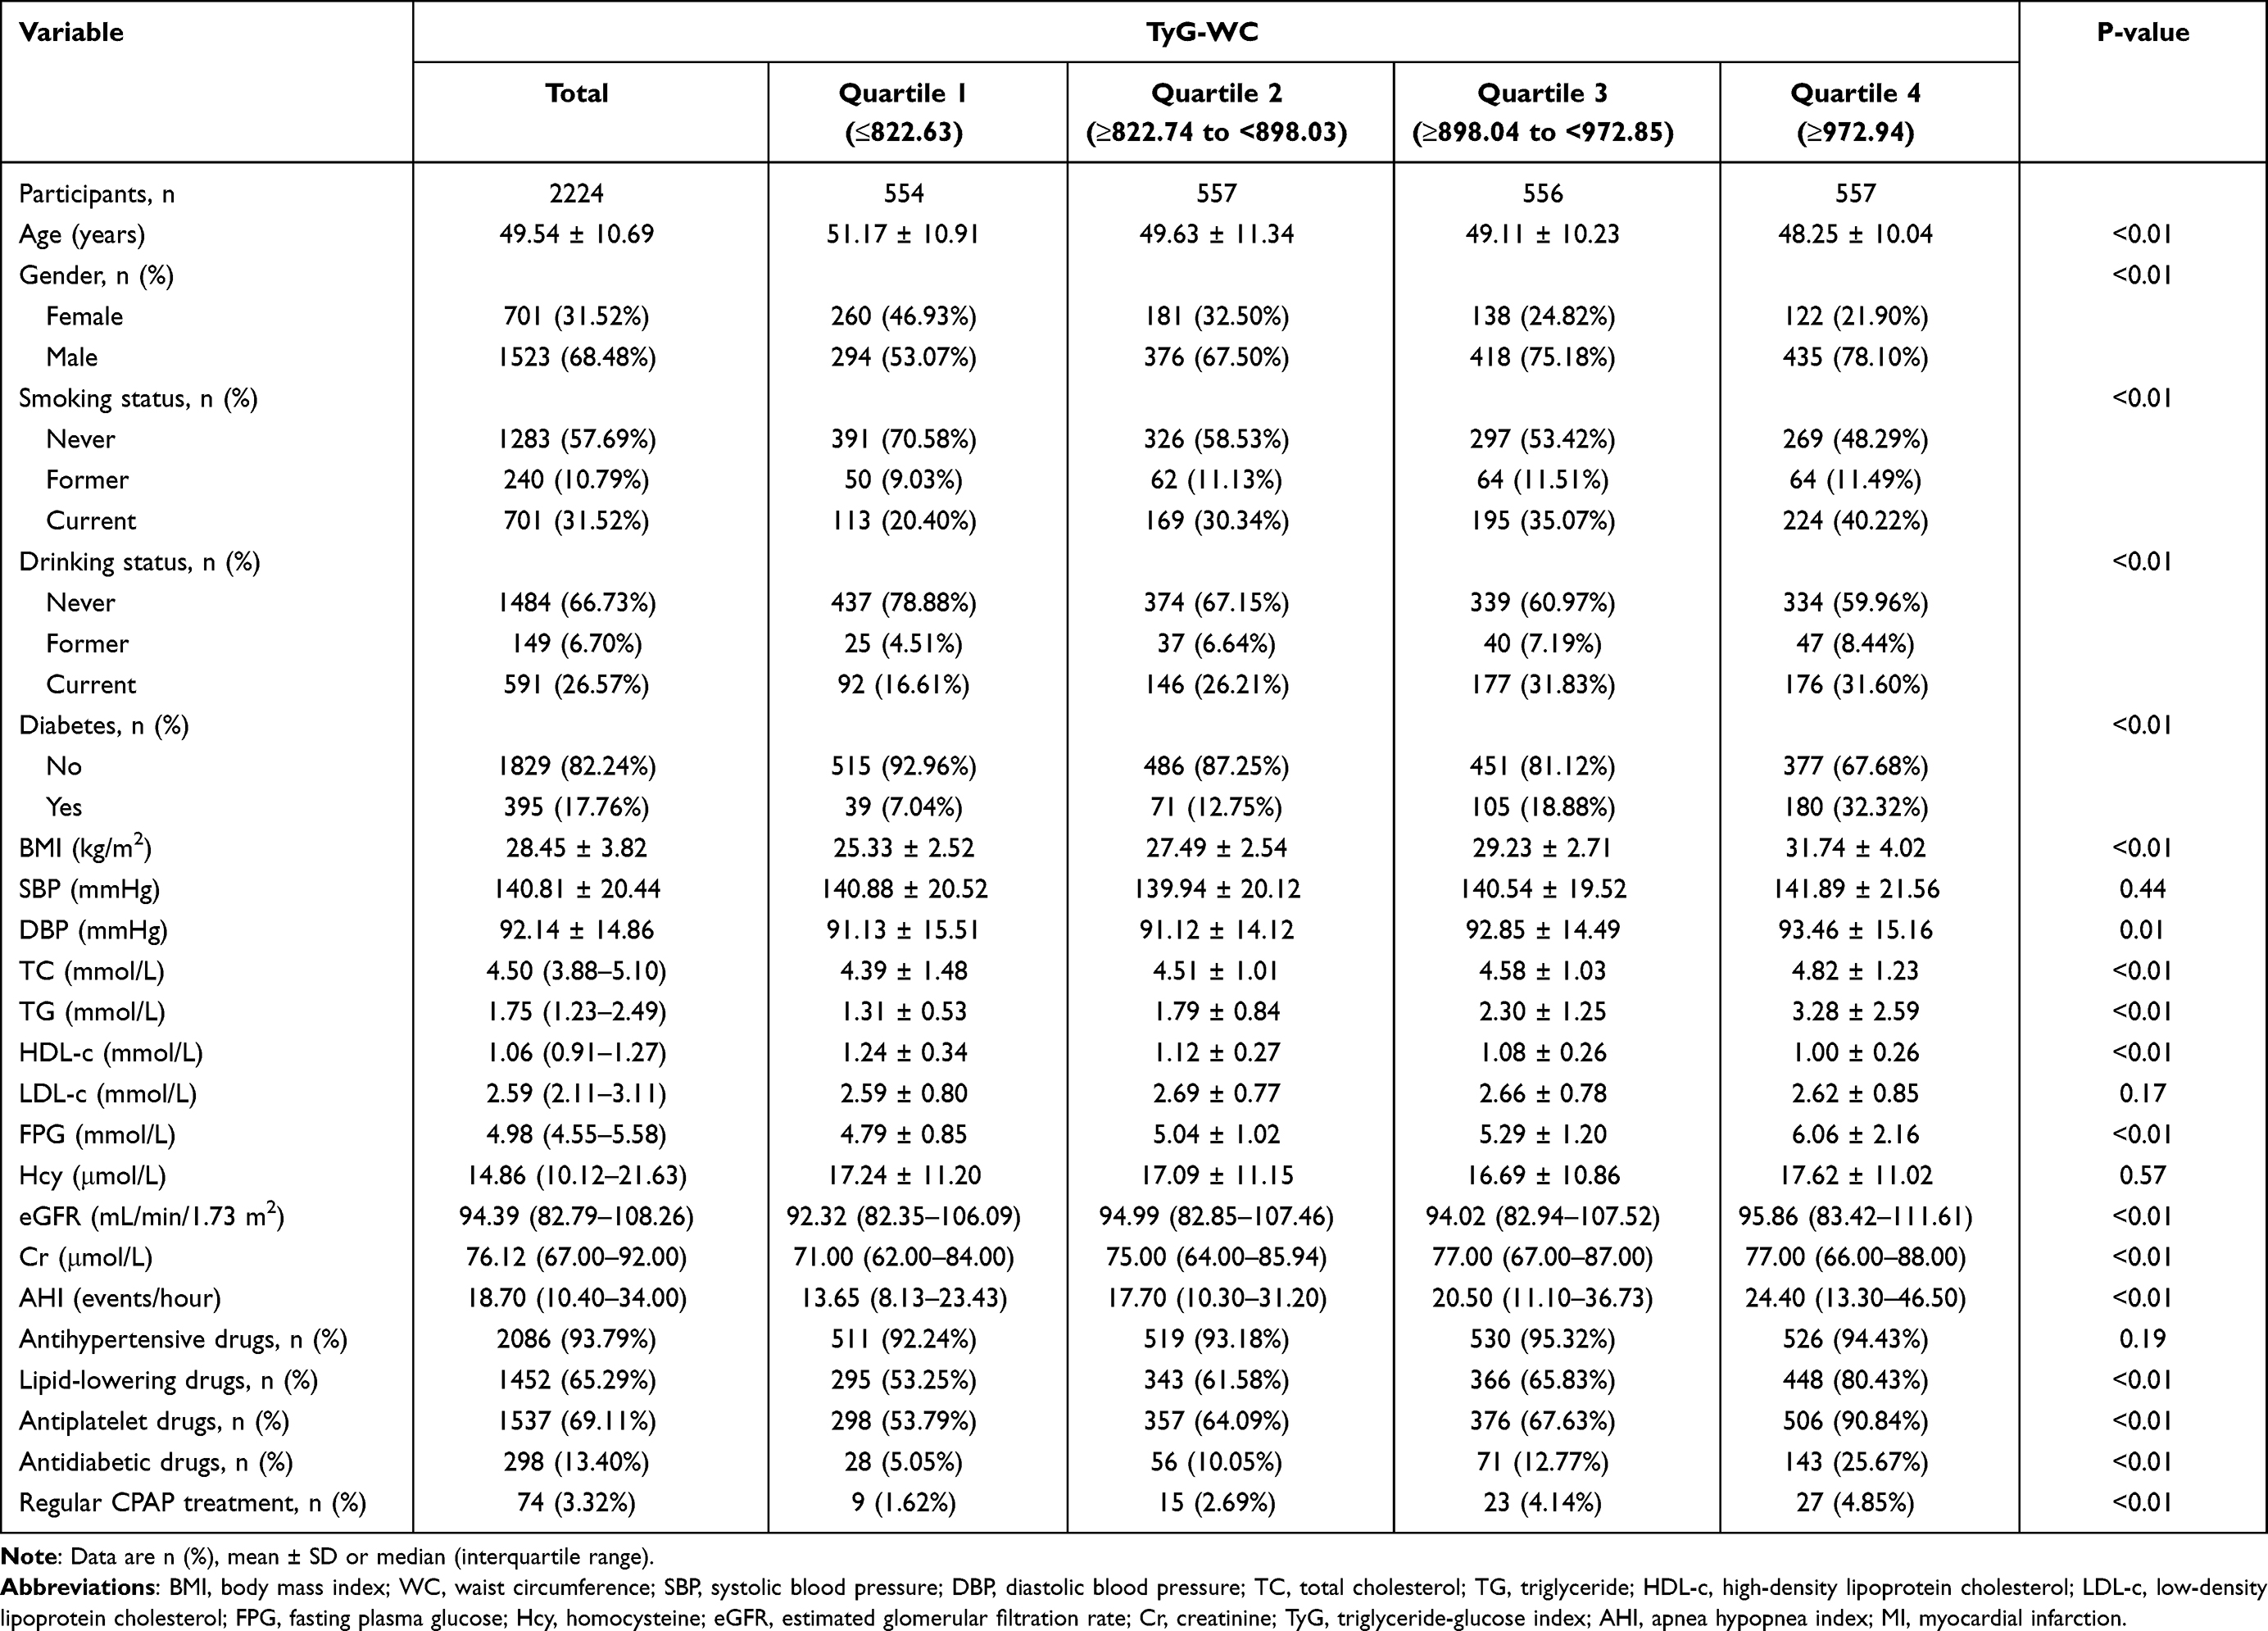 |
Table 1 Baseline Characteristics According to Quartiles of Baseline TyG-WC |
Association Between the TyG-WC and the Risk of First MI in Chinese Hypertensive Patients with OSA
Following up about a median of 7.15 years (IQR, 6.27–8.18 years), 85 (3.82%) incident first MI cases were developed. Kaplan-Meier curves estimate the risk of first MI events by the quartiles of TyG-WC in Figure 2. It could be seen that there was a significant difference in the risk of first MI among the TyG-WC groups (Log rank test P = 0.003). With the increase of TyG-WC, the cumulative incidence of first MI distinctly rises. The numbers of patients with incident first MI in Chinese hypertensive patients with OSA and corresponding cumulative incidence in Q1 to Q4 were 10 (1.81%), 16 (2.87%), 26 (4.68%), 33 (5.92%), respectively. A statistically significant effect of TyG-WC was found for the risk of first MI with an adjusted HR of 1.80 for every 1-SD increase in the TyG-WC (Table 2). After adjustment for the confounding factors, the fully adjusted HRs (model 2) were 1.77, 3.15, and 4.29 for quartiles 2, 3, and 4, respectively, versus quartile 1 of the TyG-WC. To exclude the influence of regular CPAP treatment on the association between TyG-WC and incidence of new-onset MI, a sensitivity analysis was performed after excluding 74 patients on regular CPAP treatment. We found the relationship between TyG-WC and incidence of new-onset MI was unaffected in patients with hypertension and OSA (Table S3).
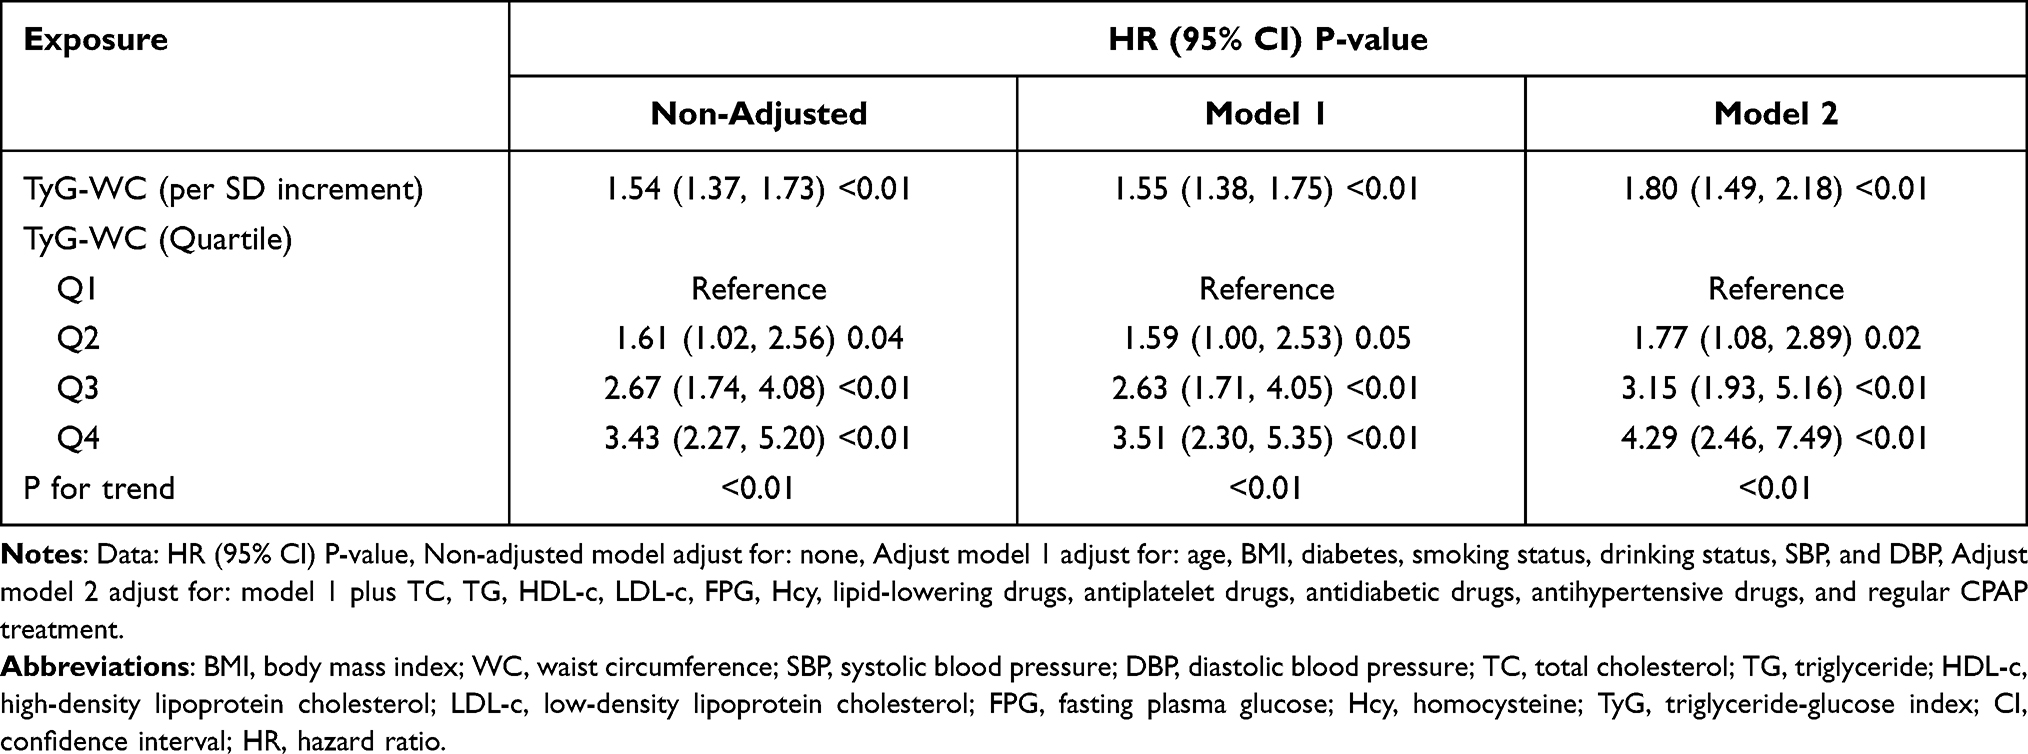 |
Table 2 Association Between TyG-WC and Incident First MI in Different Models |
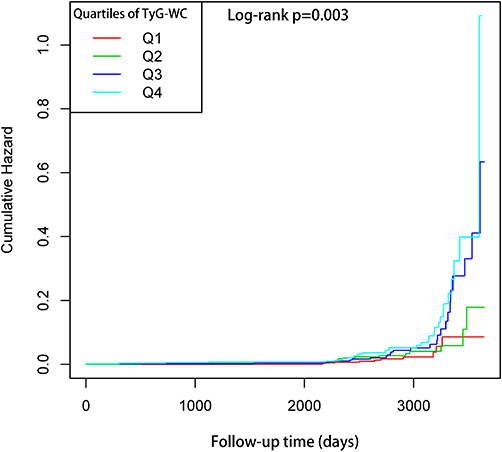 |
Figure 2 Kaplan-Meier survival curves of new-onset MI across TyG-WC quartile groups. |
Nonlinearity and Threshold Effect Between the TyG-WC and the Risk of First MI in Chinese Hypertensive Patients with OSA
The adjusted smooth curve showed that the association between the TyG-WC and first MI events was nonlinear (Figure 3), a similar J-shape relationship was observed between the TyG-WC and first MI events. The recurrence method showed a J-shaped association between the baseline TyG-WC and the risk of first MI. We used a two-piecewise linear regression model to gain the inflection point of TyG-WC was 785 (log-likelihood ratio test P=0.02) (Table 3). The inflection point > 785, there was a positive association between the TyG-WC and incident of first MI (per SD increase; HR=2.01, 95% CI: 1.62–2.50, P<0.01). On the contrary, at the inflection point ≤785, the relationship tended to be ignored (per SD increase; HR=1.25, 95% CI: 0.90–1.74, P=0.18).
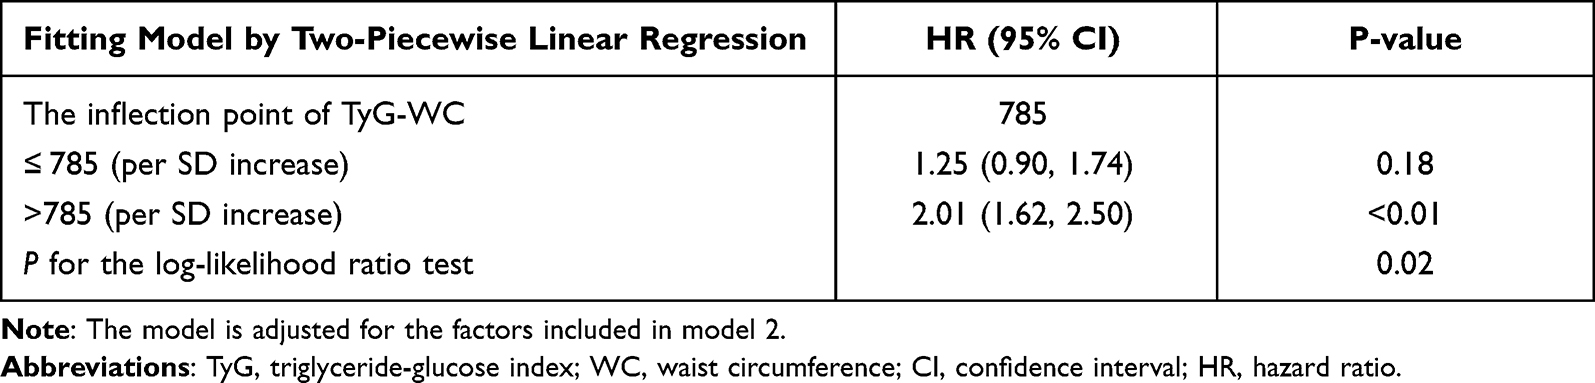 |
Table 3 The Result of the Two-Piecewise Linear Regression Model |
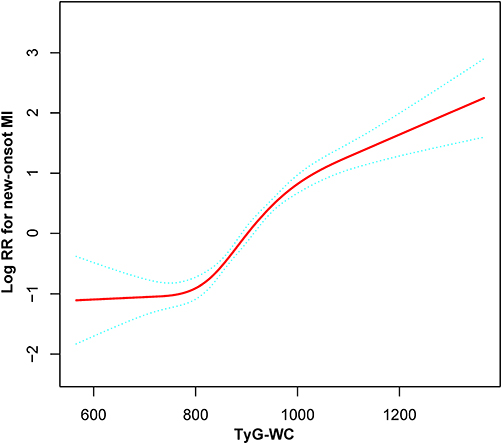 |
Figure 3 Dose-response relationship between TyG-WC and the probability of new-onset MI. |
Hierarchical Analysis and Test for Interaction
Hierarchical analysis was performed to gain an understanding of how other clinical factors may interact to promote the association between TyG-WC and first MI incidence. The full variables were presented hierarchically according to bisection or clinical significance, and interaction tests were also performed (Table 4). And all variables, including gender, age (<60 vs ≥60 years), BMI (<24 vs ≥24, <28 vs ≥28 kg/m2), SBP groups (<140 vs ≥140mmHg), DBP (<90 vs ≥90 mmHg), diabetes (no vs yes), smoking status (never vs former vs current), drinking status (never vs former vs current), eGFR (<90 vs ≥90 mL/min/1.73 m2), Hcy (<15 vs ≥15 μmol/L), as well as AHI (≥5, <15 vs ≥15, <30 vs ≥30 events/hour) levels at baseline, have no significant interactions of the effect of TyG-WC for the risk of first MI (P for all interactions > 0.05).
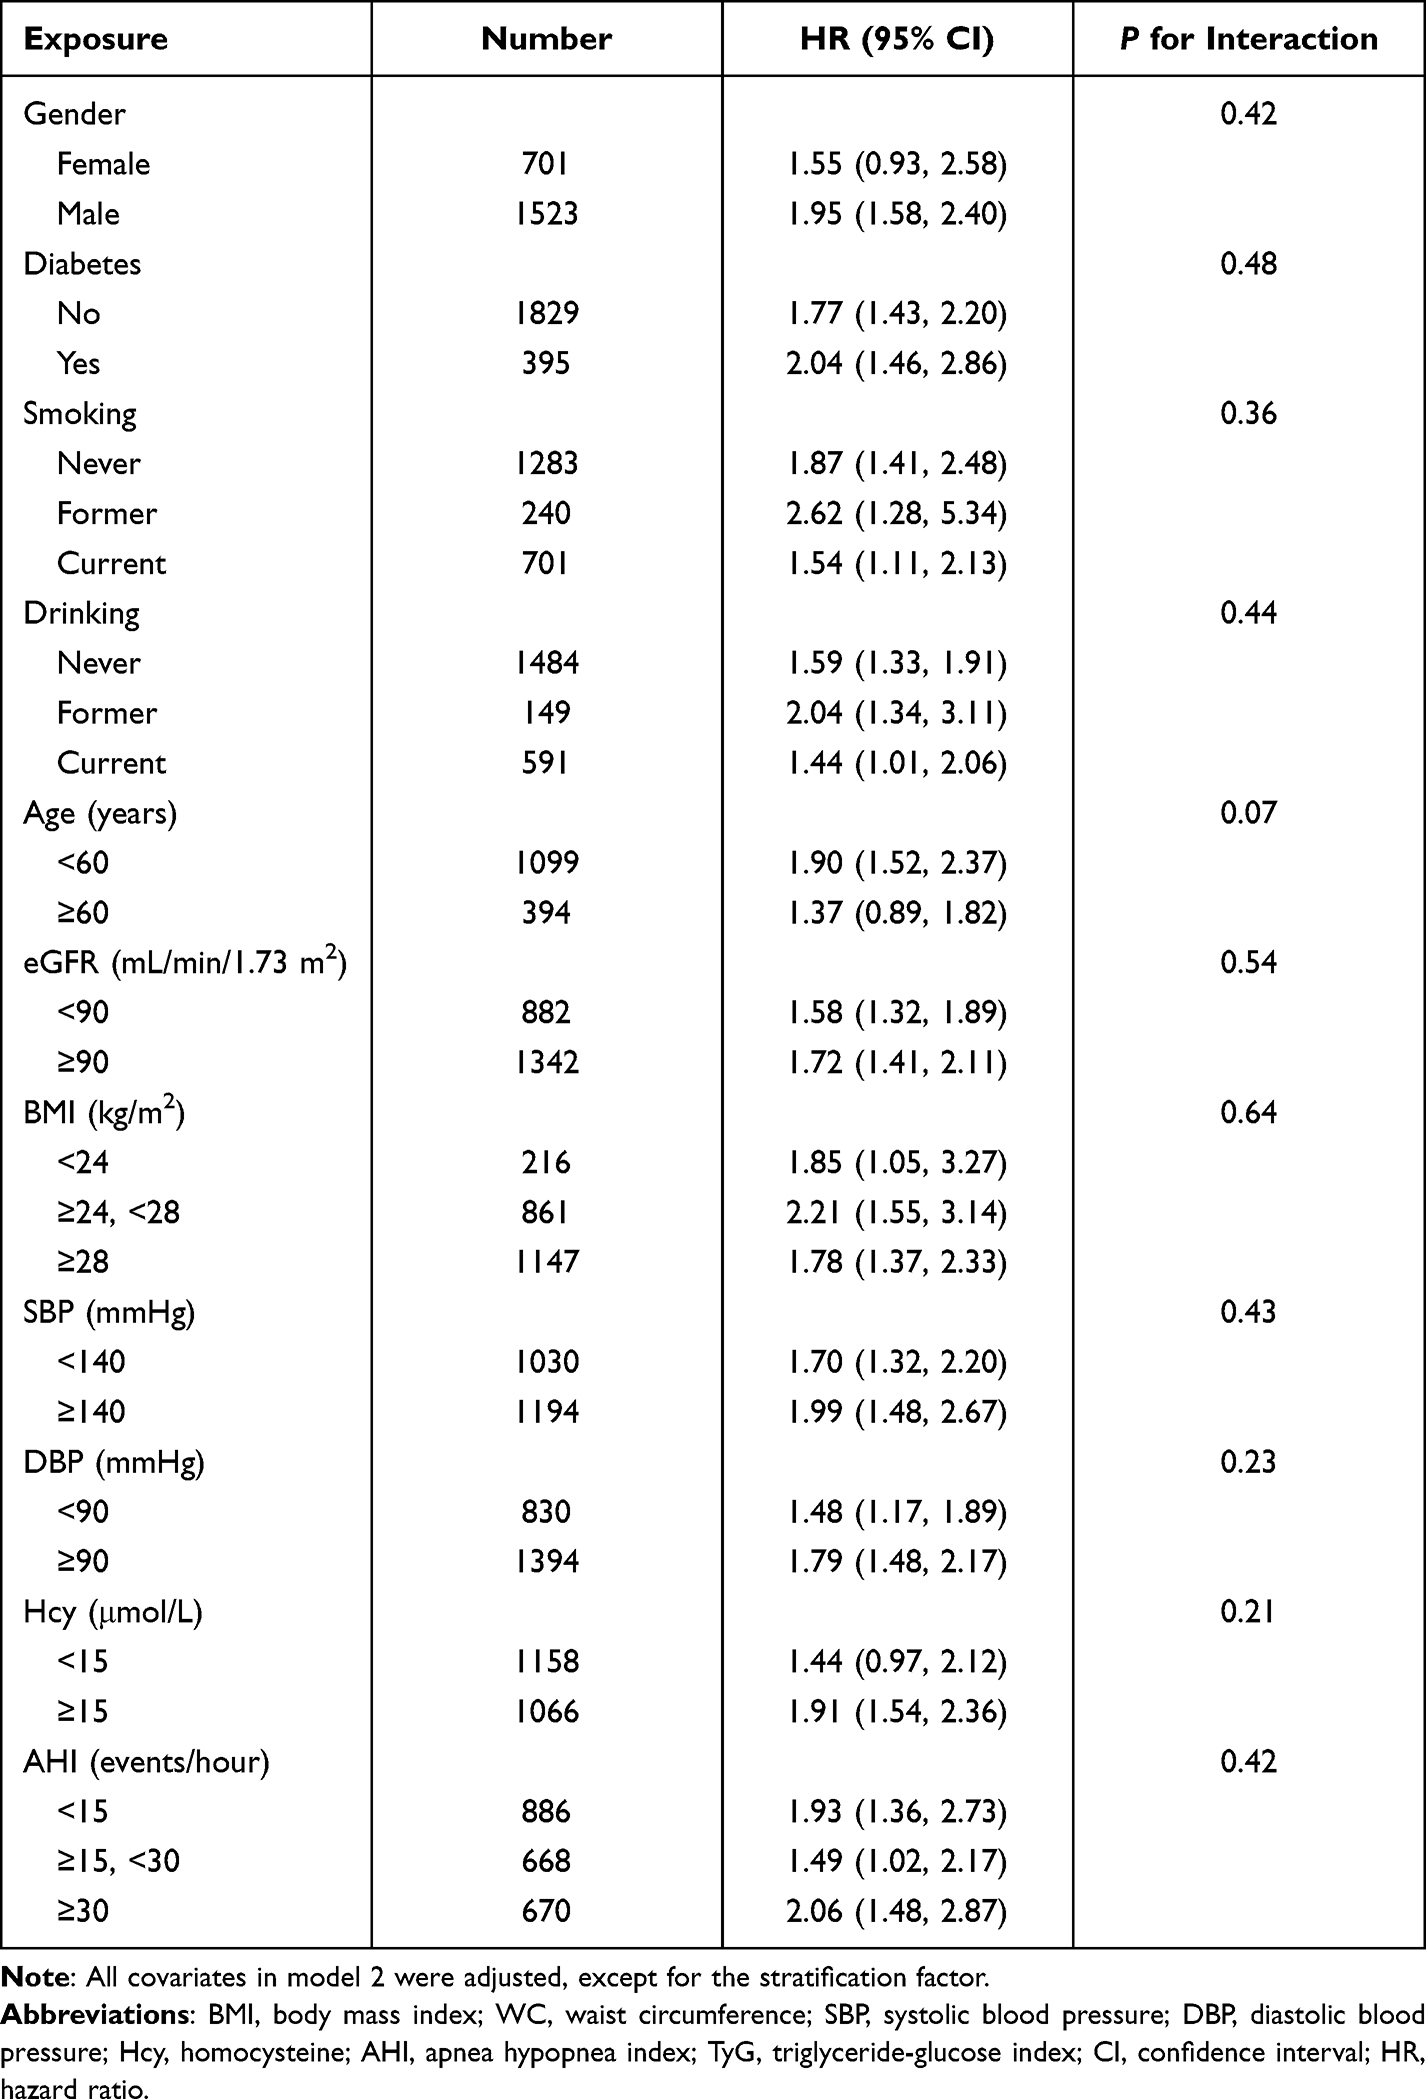 |
Table 4 The Association Between Baseline the TyG-WC (per SD Increment) and the Risk of First Myocardial Infarction |
Discussion
To the best of our knowledge, this study is the first that assesses the association between the TyG-WC and the risk of first MI among Chinese hypertensive patients with OSA. In the present observational cohort study, we identified a high-level TyG-WC, either as a continuous or categorical variable, which was associated with the risk of first MI in Chinese hypertensive patients with OSA. As the TyG-WC gradually increases, the number of people with a high risk of first MI increased significantly. This association was independent of other risk factors. Our present study assessed the obvious effects of the TyG-WC and the first MI risk in Chinese hypertensive patients with OSA and explored the nonlinear association between them. There existed a similar J-shaped association between TyG-WC and the risk of first MI, and the inflection point for the TyG-WC was calculated to be 785. Over the inflection point of 785, we observed a positive association between the TyG-WC and the first MI event. With the TyG-WC increasing, those in the highest quartile of the TyG-WC had a 4.29-fold greater risk of MI (Q4 vs Q1).
Similar results have been obtained in previous studies. In an 11-year prospective study from China, a total of 98849 infarct-free participants were enrolled at baseline and had 1555 infarction events during a median follow-up of 11.03 years. Participants in the highest quartile of the TyG index had a higher risk of MI compared with those in the lowest quartile of the TyG index.12 Liu et al investigated 6093 participants without a history of CVD and found that an elevated TyG index was associated with an increased risk of subclinical myocardial injury in the general population.45 Liu et al conducted a prospective cohort study enrolling 96541 participants to further assess whether TyG index was an independent risk factor for CVD including MI and stroke, with 1493 MI events during a median follow-up of 10 years, and found that a Q4 of TyG index was associated with a 1.4-fold risk of MI when comparing at the lowest TyG index levels.46 Zhao et al recruited 1510 subjects with a diagnosis of non-ST-segment elevation acute coronary syndrome and recorded 316 (20.9%) endpoint events over 48 months of follow-up.47 They found that the TyG index was significantly associated with the risk of nonfatal MI. Most importantly, a high TyG index was associated with adverse cardiovascular outcomes in patients with acute myocardial infarction.48–51
The high insulin-normoglycemic clamp (HEC) remains the gold standard for IR. HEC is considered to be very expensive and time-consuming.4,5 The TyG-WC was first investigated as a marker for identifying insulin resistance with high sensitivity and specificity. The TyG-WC index is simple, cost-effective, reproducible, reliable, and valid, and performs better than the hyperinsulin-hyperglycemic clamp and HOMA-IR.52–54 Additional studies have shown that TyG-WC is associated with poor cardiovascular outcomes, and several potential mechanisms are summarized below. One of the most important factors contributing to worse outcomes may be IR, which is triggered by changes in lipid metabolism, altered glucose handling, increased inflammation, and changes in the gastrointestinal microbiota.55 IR predisposes to a variety of diseases such as hyperglycemia, hypertension, and dyslipidemia, all of which are strongly associated with atherosclerosis and lead to vasoconstriction, inflammation, and thrombosis, which accelerates atherosclerosis. Therefore, adequate screening and early diagnosis for those at risk are critical.56–59 Also, high serum triglycerides may interfere with the normal metabolism of glucose in muscle, thereby causing muscle insulin resistance and thus promoting adverse cardiovascular outcomes.60,61
The results of this study have interesting implications for clinical practice. First, we initially linked TyG-WC as a low-cost, easy-to-measure marker to the first risk of MI events in Chinese hypertensive patients with OSA. Second, it is important to focus more on patients with multiple risk factors for treatment and prevention. Our current study is a retrospective cohort study and is therefore susceptible to potential confounding. However, we used rigorous statistical adjustment to minimize residual confounding.
The following limitations of this study should be described. First, the most important limitation of this study is that it is a single-center retrospective study. Second, other confounding factors, such as exercise habits, lifestyle habits, and ethnical factors, were not included in the model. In addition, our study was conducted on Chinese hypertensive patients with OSA. Given this, the results might not be generalizable to the general population. In the future, prospective studies involving a more diverse and larger sample of patients may be needed. Finally, in our current study, TyG-WC was measured only at baseline, and no changes in TyG-WC during follow-up were measured or analyzed. Therefore, further studies are needed to confirm our findings.
Conclusion
In conclusion, the current study first demonstrated that the higher TyG-WC is an independent risk factor for first MI in Chinese hypertensive patients with OSA. Our study found a J-shaped relationship of TyG-WC and the risk of first MI in Chinese hypertensive patients with OSA, with a cut-off value around 785. The findings of the study provide a useful and convenient marker for early prevention of first MI in Chinese hypertensive patients with OSA.
Data Sharing Statement
The datasets used and/or analyzed in the current study are available from the corresponding author upon reasonable request.
Ethics Approval and Consent to Participate
This study was conducted according to the Declaration of Helsinki guidelines and was approved by the Ethics Committee of the People’s Hospital of Xinjiang Uygur Autonomous Region. All participants agreed to participate in this study and provided informed written consent.
Acknowledgments
We thank all the study participants of the UROSAH project.
Funding
The Natural Science Foundation of Xinjiang Uygur Autonomous Region (2021D01C173).
Disclosure
The authors declare no conflict of interest.
References
1. Hung J, Roos A, Kadesjö E, et al. Performance of the GRACE 2.0 score in patients with type 1 and type 2 myocardial infarction. Eur Heart J. 2021;42:2552–2561. doi:10.1093/eurheartj/ehaa375
2. Samsky MD, Morrow DA, Proudfoot AG, Hochman JS, Thiele H, Rao SV. Cardiogenic shock after acute myocardial infarction: a review. JAMA. 2021;326:1840–1850. doi:10.1001/jama.2021.18323
3. Roth GA, Abate D, Abate KH, et al. Global, regional, and national age-sex-specific mortality for 282 causes of death in 195 countries and territories, 1980–2017: a systematic analysis for the Global Burden of Disease Study 2017. Lancet. 2018;392:1736–1788. doi:10.1016/S0140-6736(18)32203-7
4. Simental-Mendía LE, Rodríguez-Morán M, Guerrero-Romero F. The product of fasting glucose and triglycerides as surrogate for identifying insulin resistance in apparently healthy subjects. Metab Syndr Relat Disord. 2008;6:299–304. doi:10.1089/met.2008.0034
5. Li L, Li L, Zhou Y, Chen X, Xu Y. Association between triglyceride-glucose index and risk of periodontitis: a Cross-Sectional Study. Int J Gen Med. 2021;14:9807–9816. doi:10.2147/IJGM.S339863
6. Lv L, Zhou Y, Chen X, et al. Relationship between the TyG index and diabetic kidney disease in patients with Type-2 diabetes mellitus. Diabetes Metab Syndr Obes. 2021;14:3299–3306. doi:10.2147/DMSO.S318255
7. Liu J, Guan L, Zhao M, et al. Association between the triglyceride-glucose index and outcomes of nonalcoholic fatty liver disease: a Large-Scale Health Management Cohort Study. Diabetes Metab Syndr Obes. 2021;14:2829–2839. doi:10.2147/DMSO.S316864
8. Yao L, Wang X, Zhong Y, et al. The triglyceride-glucose index is associated with diabetic retinopathy in Chinese patients with Type 2 diabetes: a hospital-based, nested, Case-Control Study. Diabetes Metab Syndr Obes. 2021;14:1547–1555. doi:10.2147/DMSO.S294408
9. Ormazabal V, Nair S, Elfeky O, Aguayo C, Salomon C, Zuñiga FA. Association between insulin resistance and the development of cardiovascular disease. Cardiovasc Diabetol. 2018;17:122. doi:10.1186/s12933-018-0762-4
10. Laakso M, Kuusisto J. Insulin resistance and hyperglycaemia in cardiovascular disease development. Nat Rev Endocrinol. 2014;10:293–302. doi:10.1038/nrendo.2014.29
11. Fitzgibbons TP, Czech MP. Emerging evidence for beneficial macrophage functions in atherosclerosis and obesity-induced insulin resistance. J Mol Med (Berl). 2016;94:267–275. doi:10.1007/s00109-016-1385-4
12. Tian X, Zuo Y, Chen S, et al. Triglyceride-glucose index is associated with the risk of myocardial infarction: an 11-year prospective study in the Kailuan cohort. Cardiovasc Diabetol. 2021;20:19. doi:10.1186/s12933-020-01210-5
13. Zheng R, Mao Y. Triglyceride and glucose (TyG) index as a predictor of incident hypertension: a 9-year longitudinal population-based study. Lipids Health Dis. 2017;16:175. doi:10.1186/s12944-017-0562-y
14. Sánchez-íñigo L, Navarro-González D, Fernández-Montero A, Pastrana-Delgado J, Martínez JA. The TyG index may predict the development of cardiovascular events. Eur J Clin Invest. 2016;46:189–197. doi:10.1111/eci.12583
15. Jiao Y, Su Y, Shen J, et al. Evaluation of the long-term prognostic ability of triglyceride-glucose index for elderly acute coronary syndrome patients: a cohort study. Cardiovasc Diabetol. 2022;21:3. doi:10.1186/s12933-021-01443-y
16. Bikov A, Frent SM, Meszaros M, et al. Triglyceride-glucose index in non-diabetic, non-obese patients with obstructive sleep apnoea. J Clin Med. 2021;10:1932. doi:10.3390/jcm10091932
17. Kang HH, Kim SW, Lee SH. Association between triglyceride glucose index and obstructive sleep apnea risk in Korean adults: a cross-sectional cohort study. Lipids Health Dis. 2020;19:182. doi:10.1186/s12944-020-01358-9
18. Zou J, Wang Y, Xu H, et al. The use of visceral adiposity variables in the prediction of obstructive sleep apnea: evidence from a large cross-sectional study. Sleep Breath. 2020;24:1373–1382. doi:10.1007/s11325-019-01980-7
19. Gu M, Huang W, Li X, et al. Association of hypertriglyceridemic waist phenotype with obstructive sleep apnea: a Cross-Sectional Study. Nat Sci Sleep. 2021;13:2165–2173. doi:10.2147/NSS.S335288
20. Chen X, Duan M, Hou R, et al. Prevalence of abdominal obesity in Chinese middle-aged and older adults with a normal body mass index and its association with Type 2 diabetes mellitus: a Nationally Representative Cohort Study from 2011 to 2018. Diabetes Metab Syndr Obes. 2021;14:4829–4841. doi:10.2147/DMSO.S339066
21. Lin C, Sun L, Chen Q. The association of waist circumference and the risk of deep vein thrombosis. Int J Gen Med. 2021;14:9273–9286. doi:10.2147/IJGM.S344902
22. Luan H, Song Y, Cao L, Wang P, Zhu D, Tian G. Gender differences in the relationship of waist circumference to coronary artery lesions and one-year re-admission among coronary artery disease patients with normal body mass index. Diabetes Metab Syndr Obes. 2021;14:4097–4107. doi:10.2147/DMSO.S330194
23. Kim HS, Cho YK, Kim EH, et al. Triglyceride glucose-waist circumference is superior to the homeostasis model assessment of insulin resistance in identifying nonalcoholic fatty liver disease in healthy subjects. J Clin Med. 2021;11:41. doi:10.3390/jcm11010041
24. Khamseh ME, Malek M, Abbasi R, Taheri H, Lahouti M, Alaei-Shahmiri F. Triglyceride glucose index and related parameters (triglyceride glucose-body mass index and triglyceride glucose-waist circumference) identify nonalcoholic fatty liver and liver fibrosis in individuals with overweight/obesity. Metab Syndr Relat Disord. 2021;19:167–173. doi:10.1089/met.2020.0109
25. Patel SR. Obstructive Sleep Apnea. Ann Intern Med. 2019;171:ITC81–ITC96. doi:10.7326/AITC201912030
26. Wang F, Xiong X, Xu H, et al. The association between obstructive sleep apnea syndrome and metabolic syndrome: a confirmatory factor analysis. Sleep Breath. 2019;23:1011–1019. doi:10.1007/s11325-019-01804-8
27. Punjabi NM, Sorkin JD, Katzel LI, Goldberg AP, Schwartz AR, Smith PL. Sleep-disordered breathing and insulin resistance in middle-aged and overweight men. Am J Respir Crit Care Med. 2002;165:677–682. doi:10.1164/ajrccm.165.5.2104087
28. Zhang SX, Khalyfa A, Wang Y, et al. Sleep fragmentation promotes NADPH oxidase 2-mediated adipose tissue inflammation leading to insulin resistance in mice. Int J Obes. 2014;38:619–624. doi:10.1038/ijo.2013.139
29. Anothaisintawee T, Reutrakul S, Van Cauter E, Thakkinstian A. Sleep disturbances compared to traditional risk factors for diabetes development: systematic review and meta-analysis. Sleep Med Rev. 2016;30:11–24. doi:10.1016/j.smrv.2015.10.002
30. Zhao X, Xu H, Dong C, et al. The impact of glycolipid metabolic disorders on severity stage-specific variation of cardiac autonomic function in obstructive sleep apnea: a Data-Driven Clinical Study. Nat Sci Sleep. 2021;13:1347–1362. doi:10.2147/NSS.S317201
31. Guscoth LB, Appleton SL, Martin SA, Adams RJ, Melaku YA, Wittert GA. The association of obstructive sleep apnea and nocturnal hypoxemia with lipid profiles in a population-based study of community-dwelling Australian men. Nat Sci Sleep. 2021;13:1771–1782. doi:10.2147/NSS.S327478
32. Carneiro G, Zanella MT. Obesity metabolic and hormonal disorders associated with obstructive sleep apnea and their impact on the risk of cardiovascular events. Metabolism. 2018;84:76–84. doi:10.1016/j.metabol.2018.03.008
33. Horne R, Shandler G, Tamanyan K, et al. The impact of sleep disordered breathing on cardiovascular health in overweight children. Sleep Med. 2018;41:58–68. doi:10.1016/j.sleep.2017.09.012
34. Chen B, Somers VK, Tang X, Li Y. Moderating effect of BMI on the relationship between sympathetic activation and blood pressure in males with obstructive sleep apnea. Nat Sci Sleep. 2021;13:339–348. doi:10.2147/NSS.S297707
35. Wang S, Cui H, Ji K, et al. Relationship between obstructive sleep apnea and late gadolinium enhancement and their effect on cardiac arrhythmias in patients with hypertrophic obstructive cardiomyopathy. Nat Sci Sleep. 2021;13:447–456. doi:10.2147/NSS.S270684
36. Torres G, Sánchez-de-la-torre M, Barbé F. Relationship between OSA and hypertension. Chest. 2015;148:824–832. doi:10.1378/chest.15-0136
37. Bradley TD, Floras JS. Obstructive sleep apnoea and its cardiovascular consequences. Lancet. 2009;373:82–93. doi:10.1016/S0140-6736(08)61622-0
38. Cai X, Li N, Hu J, et al. Nonlinear relationship between Chinese visceral adiposity index and new-onset myocardial infarction in patients with hypertension and obstructive sleep apnoea: insights from a Cohort Study. J Inflamm Res. 2022;15:687–700. doi:10.2147/JIR.S351238
39. Xu PH, Hui C, Lui M, Lam D, Fong D, Ip M. Incident Type 2 diabetes in OSA and effect of CPAP treatment: a Retrospective Clinical Cohort Study. Chest. 2019;156:743–753. doi:10.1016/j.chest.2019.04.130
40. Barnes M, Houston D, Worsnop CJ, et al. A randomized controlled trial of continuous positive airway pressure in mild obstructive sleep apnea. Am J Respir Crit Care Med. 2002;165:773–780. doi:10.1164/ajrccm.165.6.2003166
41. Levey AS, Inker LA, Coresh J. GFR estimation: from physiology to public health. Am J Kidney Dis. 2014;63:820–834. doi:10.1053/j.ajkd.2013.12.006
42. Berry RB, Budhiraja R, Gottlieb DJ, et al. Rules for scoring respiratory events in sleep: update of the 2007 AASM manual for the scoring of sleep and associated events. deliberations of the sleep apnea definitions task force of the American Academy of sleep medicine. J Clin Sleep Med. 2012;8:597–619. doi:10.5664/jcsm.2172
43. Cai XT, Zhu Q, Liu SS, et al. Associations between the metabolic score for insulin resistance index and the risk of Type 2 diabetes mellitus among non-obese adults: insights from a Population-Based Cohort Study. Int J Gen Med. 2021;14:7729–7740. doi:10.2147/IJGM.S336990
44. Cai X, Gao J, Hu J, et al. Dose-response associations of metabolic score for insulin resistance index with nonalcoholic fatty liver disease among a nonobese Chinese population: retrospective Evidence from a Population-Based Cohort Study. Dis Markers. 2022;2022:4930355. doi:10.1155/2022/4930355
45. Liu Y, Wu M, Xu J, Sha D, Xu B, Kang L. Association between Triglyceride and glycose (TyG) index and subclinical myocardial injury. Nutr Metab Cardiovasc Dis. 2020;30:2072–2076. doi:10.1016/j.numecd.2020.06.019
46. Liu Q, Cui H, Ma Y, Han X, Cao Z, Wu Y. Triglyceride-glucose index associated with the risk of cardiovascular disease: the Kailuan study. Endocrine. 2022;75:392–399. doi:10.1007/s12020-021-02862-3
47. Zhao Q, Zhang TY, Cheng YJ, et al. Triglyceride-glucose index as a surrogate marker of insulin resistance for predicting cardiovascular outcomes in nondiabetic patients with non-ST-segment elevation acute coronary syndrome undergoing percutaneous coronary intervention. J Atheroscler Thromb. 2021;28:1175–1194. doi:10.5551/jat.59840
48. Luo E, Wang D, Yan G, et al. High triglyceride-glucose index is associated with poor prognosis in patients with acute ST-elevation myocardial infarction after percutaneous coronary intervention. Cardiovasc Diabetol. 2019;18:150. doi:10.1186/s12933-019-0957-3
49. Zhang Y, Ding X, Hua B, et al. High triglyceride-glucose index is associated with adverse cardiovascular outcomes in patients with acute myocardial infarction. Nutr Metab Cardiovasc Dis. 2020;30:2351–2362. doi:10.1016/j.numecd.2020.07.041
50. Mao Q, Zhou D, Li Y, Wang Y, Xu SC, Zhao XH. The triglyceride-glucose index predicts coronary artery disease severity and cardiovascular outcomes in patients with non-ST-segment elevation acute coronary syndrome. Dis Markers. 2019;2019:6891537. doi:10.1155/2019/6891537
51. Zhang Y, Ding X, Hua B, et al. High triglyceride-glucose index is associated with poor cardiovascular outcomes in nondiabetic patients with ACS with LDL-C below 1.8 mmol/L. J Atheroscler Thromb. 2022;29:268–281. doi:10.5551/jat.61119
52. Lim J, Kim J, Koo SH, Kwon GC. Comparison of triglyceride glucose index, and related parameters to predict insulin resistance in Korean adults: an analysis of the 2007–2010 Korean National Health and Nutrition Examination Survey. PLoS One. 2019;14:e0212963. doi:10.1371/journal.pone.0212963
53. Ramdas Nayak VK, Nayak KR, Vidyasagar S. Predictive performance of traditional and novel lipid combined anthropometric indices to identify prediabetes. Diabetes Metab Syndr. 2020;14:1265–1272. doi:10.1016/j.dsx.2020.06.045
54. Guerrero-Romero F, Simental-Mendía LE, González-Ortiz M, et al. The product of triglycerides and glucose, a simple measure of insulin sensitivity. Comparison with the euglycemic-hyperinsulinemic clamp. J Clin Endocrinol Metab. 2010;95:3347–3351. doi:10.1210/jc.2010-0288
55. Gasmi A, Noor S, Menzel A, Doşa A, Pivina L, Bjørklund G. Obesity and insulin resistance: associations with chronic inflammation, genetic and epigenetic factors. Curr Med Chem. 2021;28:800–826. doi:10.2174/0929867327666200824112056
56. Wang F, Han L, Hu D. Fasting insulin, insulin resistance and risk of hypertension in the general population: a meta-analysis. Clin Chim Acta. 2017;464:57–63. doi:10.1016/j.cca.2016.11.009
57. Sung KC, Lim S, Rosenson RS. Hyperinsulinemia and homeostasis model assessment of insulin resistance as predictors of hypertension: a 5-year follow-up study of Korean sample. Am J Hypertens. 2011;24:1041–1045. doi:10.1038/ajh.2011.89
58. Saely CH, Aczel S, Marte T, Langer P, Hoefle G, Drexel H. The metabolic syndrome, insulin resistance, and cardiovascular risk in diabetic and nondiabetic patients. J Clin Endocrinol Metab. 2005;90:5698–5703. doi:10.1210/jc.2005-0799
59. Iqbal J, Al Qarni A, Hawwari A, Alghanem AF, Ahmed G. Metabolic syndrome, dyslipidemia and regulation of lipoprotein metabolism. Curr Diabetes Rev. 2018;14:427–433. doi:10.2174/1573399813666170705161039
60. Pan DA, Lillioja S, Kriketos AD, et al. Skeletal muscle triglyceride levels are inversely related to insulin action. Diabetes. 1997;46:983–988. doi:10.2337/diab.46.6.983
61. Shinhar N, Marcoviciu D, Dicker D. Reduction in serum triglyceride levels in diabetic patients may result in decreased insulin dependence and disease regression. Isr Med Assoc J. 2018;20:363–367.
 © 2022 The Author(s). This work is published and licensed by Dove Medical Press Limited. The full terms of this license are available at https://www.dovepress.com/terms.php and incorporate the Creative Commons Attribution - Non Commercial (unported, v3.0) License.
By accessing the work you hereby accept the Terms. Non-commercial uses of the work are permitted without any further permission from Dove Medical Press Limited, provided the work is properly attributed. For permission for commercial use of this work, please see paragraphs 4.2 and 5 of our Terms.
© 2022 The Author(s). This work is published and licensed by Dove Medical Press Limited. The full terms of this license are available at https://www.dovepress.com/terms.php and incorporate the Creative Commons Attribution - Non Commercial (unported, v3.0) License.
By accessing the work you hereby accept the Terms. Non-commercial uses of the work are permitted without any further permission from Dove Medical Press Limited, provided the work is properly attributed. For permission for commercial use of this work, please see paragraphs 4.2 and 5 of our Terms.