")
Back to Journals » Diabetes, Metabolic Syndrome and Obesity » Volume 14
Association Between the Triglyceride–Glucose Index and Outcomes of Nonalcoholic Fatty Liver Disease: A Large-Scale Health Management Cohort Study
Authors Liu J, Guan L, Zhao M, Li Q, Song A, Gao L, Lin H, Zhao J
Received 21 April 2021
Accepted for publication 28 May 2021
Published 21 June 2021 Volume 2021:14 Pages 2829—2839
DOI https://doi.org/10.2147/DMSO.S316864
Checked for plagiarism Yes
Review by Single anonymous peer review
Peer reviewer comments 5
Editor who approved publication: Professor Ming-Hui Zou
Jing Liu,1– 3 Liying Guan,4 Meng Zhao,1,2,5 Qihang Li,2,3,5 An Song,6 Ling Gao,2,7,8 Haiyan Lin,4 Jiajun Zhao1,2,5,7
1Department of Endocrinology, Shandong Provincial Hospital, Affiliated to Shandong First Medical University, Jinan, Shandong, 250021, People’s Republic of China; 2Shandong Clinical Medical Center of Endocrinology and Metabolism, Affiliated to Shandong Provincial Hospital, Jinan, Shandong, 250021, People’s Republic of China; 3Shandong Institute of Endocrine and Metabolic Disease, Affiliated to Shandong Provincial Hospital, Jinan, Shandong, 250021, People’s Republic of China; 4Health Management Center, Shandong Provincial Hospital, Affiliated to Shandong First Medical University, Jinan, Shandong, People’s Republic of China; 5Department of Endocrinology, Shandong Provincial Hospital, Cheeloo College of Medicine, Shandong University, Jinan, Shandong, 250021, People’s Republic of China; 6Peking Union Medical College Hospital, Affiliated to Peking Union Medical College, Chinese Academy of Medical Sciences, Beijing, 100730, People’s Republic of China; 7Shandong Provincial Key Laboratory of Endocrinology and Lipid Metabolism, Affiliated to Shandong Provincial Hospital, Jinan, Shandong, 250021, People’s Republic of China; 8Department of Scientific Center, Shandong Provincial Hospital, Affiliated to Shandong First Medical University, Jinan, Shandong, 250021, People’s Republic of China
Correspondence: Haiyan Lin
Health Management Center, Shandong Provincial Hospital Affiliated to Shandong First Medical University, 324 Jing 5 Road, Jinan, Shandong, 250021, People’s Republic of China
Tel +86-531-68776123 (Clin.)
Fax +86-531-87068707
Email [email protected]
Jiajun Zhao
Department of Endocrinology, Shandong Provincial Hospital Affiliated to Shandong First Medical University, 324 Jing 5 Road, Jinan, Shandong, 250021, People’s Republic of China
Tel +86-531-68776375 (Clin.); +86-531-68776094 (Lab.)
Fax +86-531-87068707
Email [email protected]
Background: Nonalcoholic fatty liver disease (NAFLD) is increasingly becoming a major health burden. Due to the difficulty of liver biopsy, there is no reliable indicator to evaluate the outcomes of NAFLD. The triglyceride–glucose (TyG) index is a simple and convenient marker of insulin resistance for use in medical practice. Whether the TyG index is predictive of later risk of NAFLD remains unknown.
Objective: To evaluate the relationship between TyG index with NAFLD progression and improvement during a median follow-up period of 21 months.
Material and Methods: A total of 11,424 subjects (9327 men) diagnosed with NAFLD were included. The TyG index was calculated as follows: ln [fasting triglycerides (mg/dL) * fasting glucose (mg/dL)/2]. Multivariable Cox regression analysis was applied to analyze the data.
Results: In this study, the severity of NAFLD remained the same in 38.8% of subjects, worsened in 17.4% of subjects, and improved in 43.8% of subjects. Compared with the lowest quartile of the TyG index, the adjusted HR of NAFLD progression in the highest quartile (TyG≥ 9.34) was 1.448 (1.229 to 1.706), and the adjusted HR of NAFLD improvement was 0.817 (0.723 to 0.923). Subgroup analysis found that smoking increased the correlation between the TyG index and the risk of NAFLD progression, while female, vegan diet, and weight control enhanced the correlation between the TyG index and the risk of NAFLD improvement.
Conclusion: The TyG index may be a simple and helpful indicator for further risk appraisal of NAFLD in daily clinical practice.
Keywords: triglyceride–glucose index, nonalcoholic fatty liver disease, outcomes
Introduction
With economic growth and lifestyle changes, nonalcoholic fatty liver disease (NAFLD) is the most common cause of chronic liver disease worldwide, and the global prevalence of NAFLD has gradually increased year by year. Alarmingly, a recent meta-analysis of the epidemiology of NAFLD in 22 countries showed that its global prevalence was 25.2%,1 and the prevalence was found to be higher in urban areas than in rural areas.2 NAFLD is inextricably linked with type 2 diabetes (T2DM), metabolic syndrome, cardiovascular events, and chronic kidney disease and increases the risk of obstructive sleep apnoea, osteoporosis, and hypothyroidism.3–7 Therefore, the high incidence and concealed health dangers of NAFLD have become a public health issue that should not be ignored.
Although East Asians have a lower absolute body mass index (BMI) than Westerners, the former group is more vulnerable to visceral fat accumulation and insulin resistance (IR).8 NAFLD is a multifactorial disease, and IR is one of the several mechanisms underlying its pathogenesis. IR triggers oxidative stress and inflammation, promotes the development of NASH and liver fibrosis.9 The homeostasis model assessment of insulin resistance (HOMA-IR) is the most widely used indicator to evaluate the degree of IR. Determination of IR with HOMA-IR involves an insulin assay that lacks standardization, and the use is limited by the instability and expense of insulin, especially in primary healthcare clinics.10,11 Therefore, the triglyceride–glucose (TyG) index was proposed as a new, reliable marker of IR. The TyG index was calculated as the ln [fasting triglycerides (mg/dL) * fasting glucose (mg/dL)/2].12 The correlation between the TyG index and hyperinsulinaemic-euglycaemic clamp (HEC) has been widely validated, and this index is also easier to obtain and more stable than HOMA.13 Its connections with cardiovascular events, T2DM and metabolic syndrome have been extensively studied.14–16 Moreover, cross-sectional studies in different populations indicated that the TyG index was higher in NAFLD patients and its accuracy and reliability in detecting NAFLD with a specificity of 60.1% and a sensitivity of 70.6%.17,18 However, these studies did not address the cause-effect relationship between the TyG index and NAFLD outcomes because of their cross-sectional nature.
In China, the management of NAFLD for family doctors and primary healthcare facilities has gradually become mainstream. If the outcomes of NAFLD can be clarified, the target population for treatment can be clarified. Detailed knowledge about the natural course of NAFLD is essential for the proper design of screening and follow-up programs. Needless to say, finding a reliable classification based on suitable biomarkers is crucially important in assessing the outcome of NAFLD. For these reasons, we used a large-scale urban health management cohort to explore the association between the TyG index and the outcomes of NAFLD, including its progression and improvement of NAFLD. Our study provides a convenient and sensitive indicator for NAFLD risk assessment.
Materials and Methods
Ethical Statement
The study protocol was approved by the Ethics Committee of Shandong Provincial Hospital (Date of approval: 9-Jan-2019; no. 2019–002). This study was conducted in accordance with both the Declaration of Helsinki of 1975, as revised in 1983, and guidelines of the centre’s institutional review board. Since our research is a retrospective study using the data obtained in the previous diagnosis and treatment process, it will not adversely affect the rights and health of the subjects, and the personal identification information is protected. So, the Ethics Committee of Shandong Provincial Hospital has waived patient consent.
Study Population
This study is a longitudinal, retrospective cohort study. The subjects were 11,424 urban residents (aged ≥18 years) who underwent health examinations at the Health Management Center in Shandong Provincial Hospital (China) between January 2012 and December 2016. The subjects were followed two times, the median and maximum follow-up periods were 21 months and 59 months, respectively. The following categories were excluded: (1) patients with missing basic information; (2) patients without abdominal ultrasound data or non-NAFLD patients with abdominal ultrasound data; (3) patients with alcoholic fatty liver (AST/ALT>2 and a history of alcohol abuse);19,20 (4) patients with malignant tumours, viral hepatitis (hepatitis B or hepatitis C), cirrhosis or other disorders of the liver; and (5) women who were pregnant during the study. After the exclusion criteria were applied, 11,424 patients were recruited for the final analysis.
Physical Examinations and Laboratory Measurements
All study visits took place in the morning; at these visits, all subjects provided information on their medical history and lifestyle (such as dietary habits, smoking status, alcohol consumption, and exercise) through a questionnaire administered by trained interviewers. Height and weight were measured with an electronic scale and a wall-mounted stadiometer. The body mass index (BMI) was calculated using weight (kg) divided by the square of height (m2). Systolic blood pressure (SBP) and diastolic blood pressure (DBP) were measured twice in the right arm in a sitting position after a 15-minute rest, and the two replicate measurements were averaged. Blood samples were collected from the subjects after an overnight fast. Laboratory measurements of alanine aminotransferase (ALT), aspartate aminotransferase (AST), fasting plasma glucose (FPG), triglycerides (TG), total cholesterol (TC), low-density lipoprotein cholesterol (LDL-C), high-density lipoprotein cholesterol (HDL-C), hepatitis B surface antigen and anti-hepatitis C virus antibodies, were performed using an ARCHITECT ci16200 Integrated System (Abbott, Illinois, USA).
Ascertainment of NAFLD
The diagnosis of NAFLD was determined using abdominal ultrasound with standardized criteria. An experienced radiologist who was blinded to the patients’ clinical information performed the scans using a LOGIQ P6 apparatus (GE Ultrasound in Korea). Ultrasound diagnosis can divide NAFLD into three grades: mild, moderate and severe. According to ultrasonographic findings, the outcomes of NAFLD were classified as disease stability, progression, or improvement. Specifically, the stability of NAFLD was defined as the same severity of NAFLD at the end of follow-up compared to baseline, progression of NAFLD was defined as an increase in the severity of NAFLD at the end of follow-up as compared with the baseline and improvement of NAFLD was defined remission or regression to a less severe state at the end of follow-up than baseline.
Statistical Analysis
All metric variables conforming to a normal distribution are expressed as the mean ± standard deviation, and all metric variables with a skewed distribution are presented as the median and quartiles. For normally distributed data, comparisons among more than two groups were performed by one-way analysis of variance (ANOVA), and comparisons between two groups were conducted by Fisher’s least significant difference (LSD) test. If the distribution was skewed, a Kruskal–Wallis test by ranks was used for comparisons among more than two groups, and the Mann–Whitney U-test was used for comparisons between two groups. Enumeration data are expressed as the rate (%), and a chi-square test was applied. The follow-up period for each participant was computed as the time from the date of the first visit (baseline) to the date of change in the degree of NAFLD (61.2%) or the end of follow-up (December 31, 2016), whichever came first.
In order to examine the association between the TyG index and NAFLD outcomes, the TyG index was divided into four groups (Q1<8.6, 8.6≤Q2<8.95, 8.95<Q3≤9.34, and Q4≥9.34) defined by quartiles, and Cox proportional hazards models were used to estimate hazard ratios (HRs) and 95% confidence intervals (95% CIs). Three models were estimated: in model 1, sex and age were adjusted; in model 2, sex, age, SBP, DBP, BMI, ALT, SCr, HDL, LDL, FPG, and TG were adjusted; and in model 3, the variables in model 2 plus diet, smoking, alcohol consumption and physical activity were adjusted. Moreover, we conducted subgroup analyses to explore the potential effect modification by risk factors including age, sex, BMI, diet, smoking, alcohol consumption and physical activity. In order to further verify the correlation between the TyG and NAFLD outcomes, we performed an ordered logistic regression. A p-value <0.05 was taken to indicate a significant difference. All data were analysed using SPSS 25.0.
Results
Baseline Characteristics
A total of 11,424 patients with NAFLD verified by abdominal ultrasound were included in the study (Figure 1). At the end of follow-up, subjects were divided into three groups according to their NAFLD outcomes: the stability group, the progression group, and the improvement group. A comparison of initial baseline characteristics is shown in Table 1. The age of the participants was (48.20 ± 13.06) years, 9327 were male (81.6%), and the baseline TyG index was (9.00 ± 0.60). The progression group had a higher BMI (27.43±2.94 vs 27.08±2.81, p<0.05) and TyG index (9.06±0.59 vs 9.00±0.59, p<0.05) than the stability group. Additionally, the BMI, ALT, GGT, SCr, TG, and TyG index of the improvement group were lower than those of the stability group or the progression group. Meanwhile, the improvement group had a higher proportion of vegetarians, a lower proportion of members who smoked daily, and a higher frequency of exercise than the other two groups (Table 1).
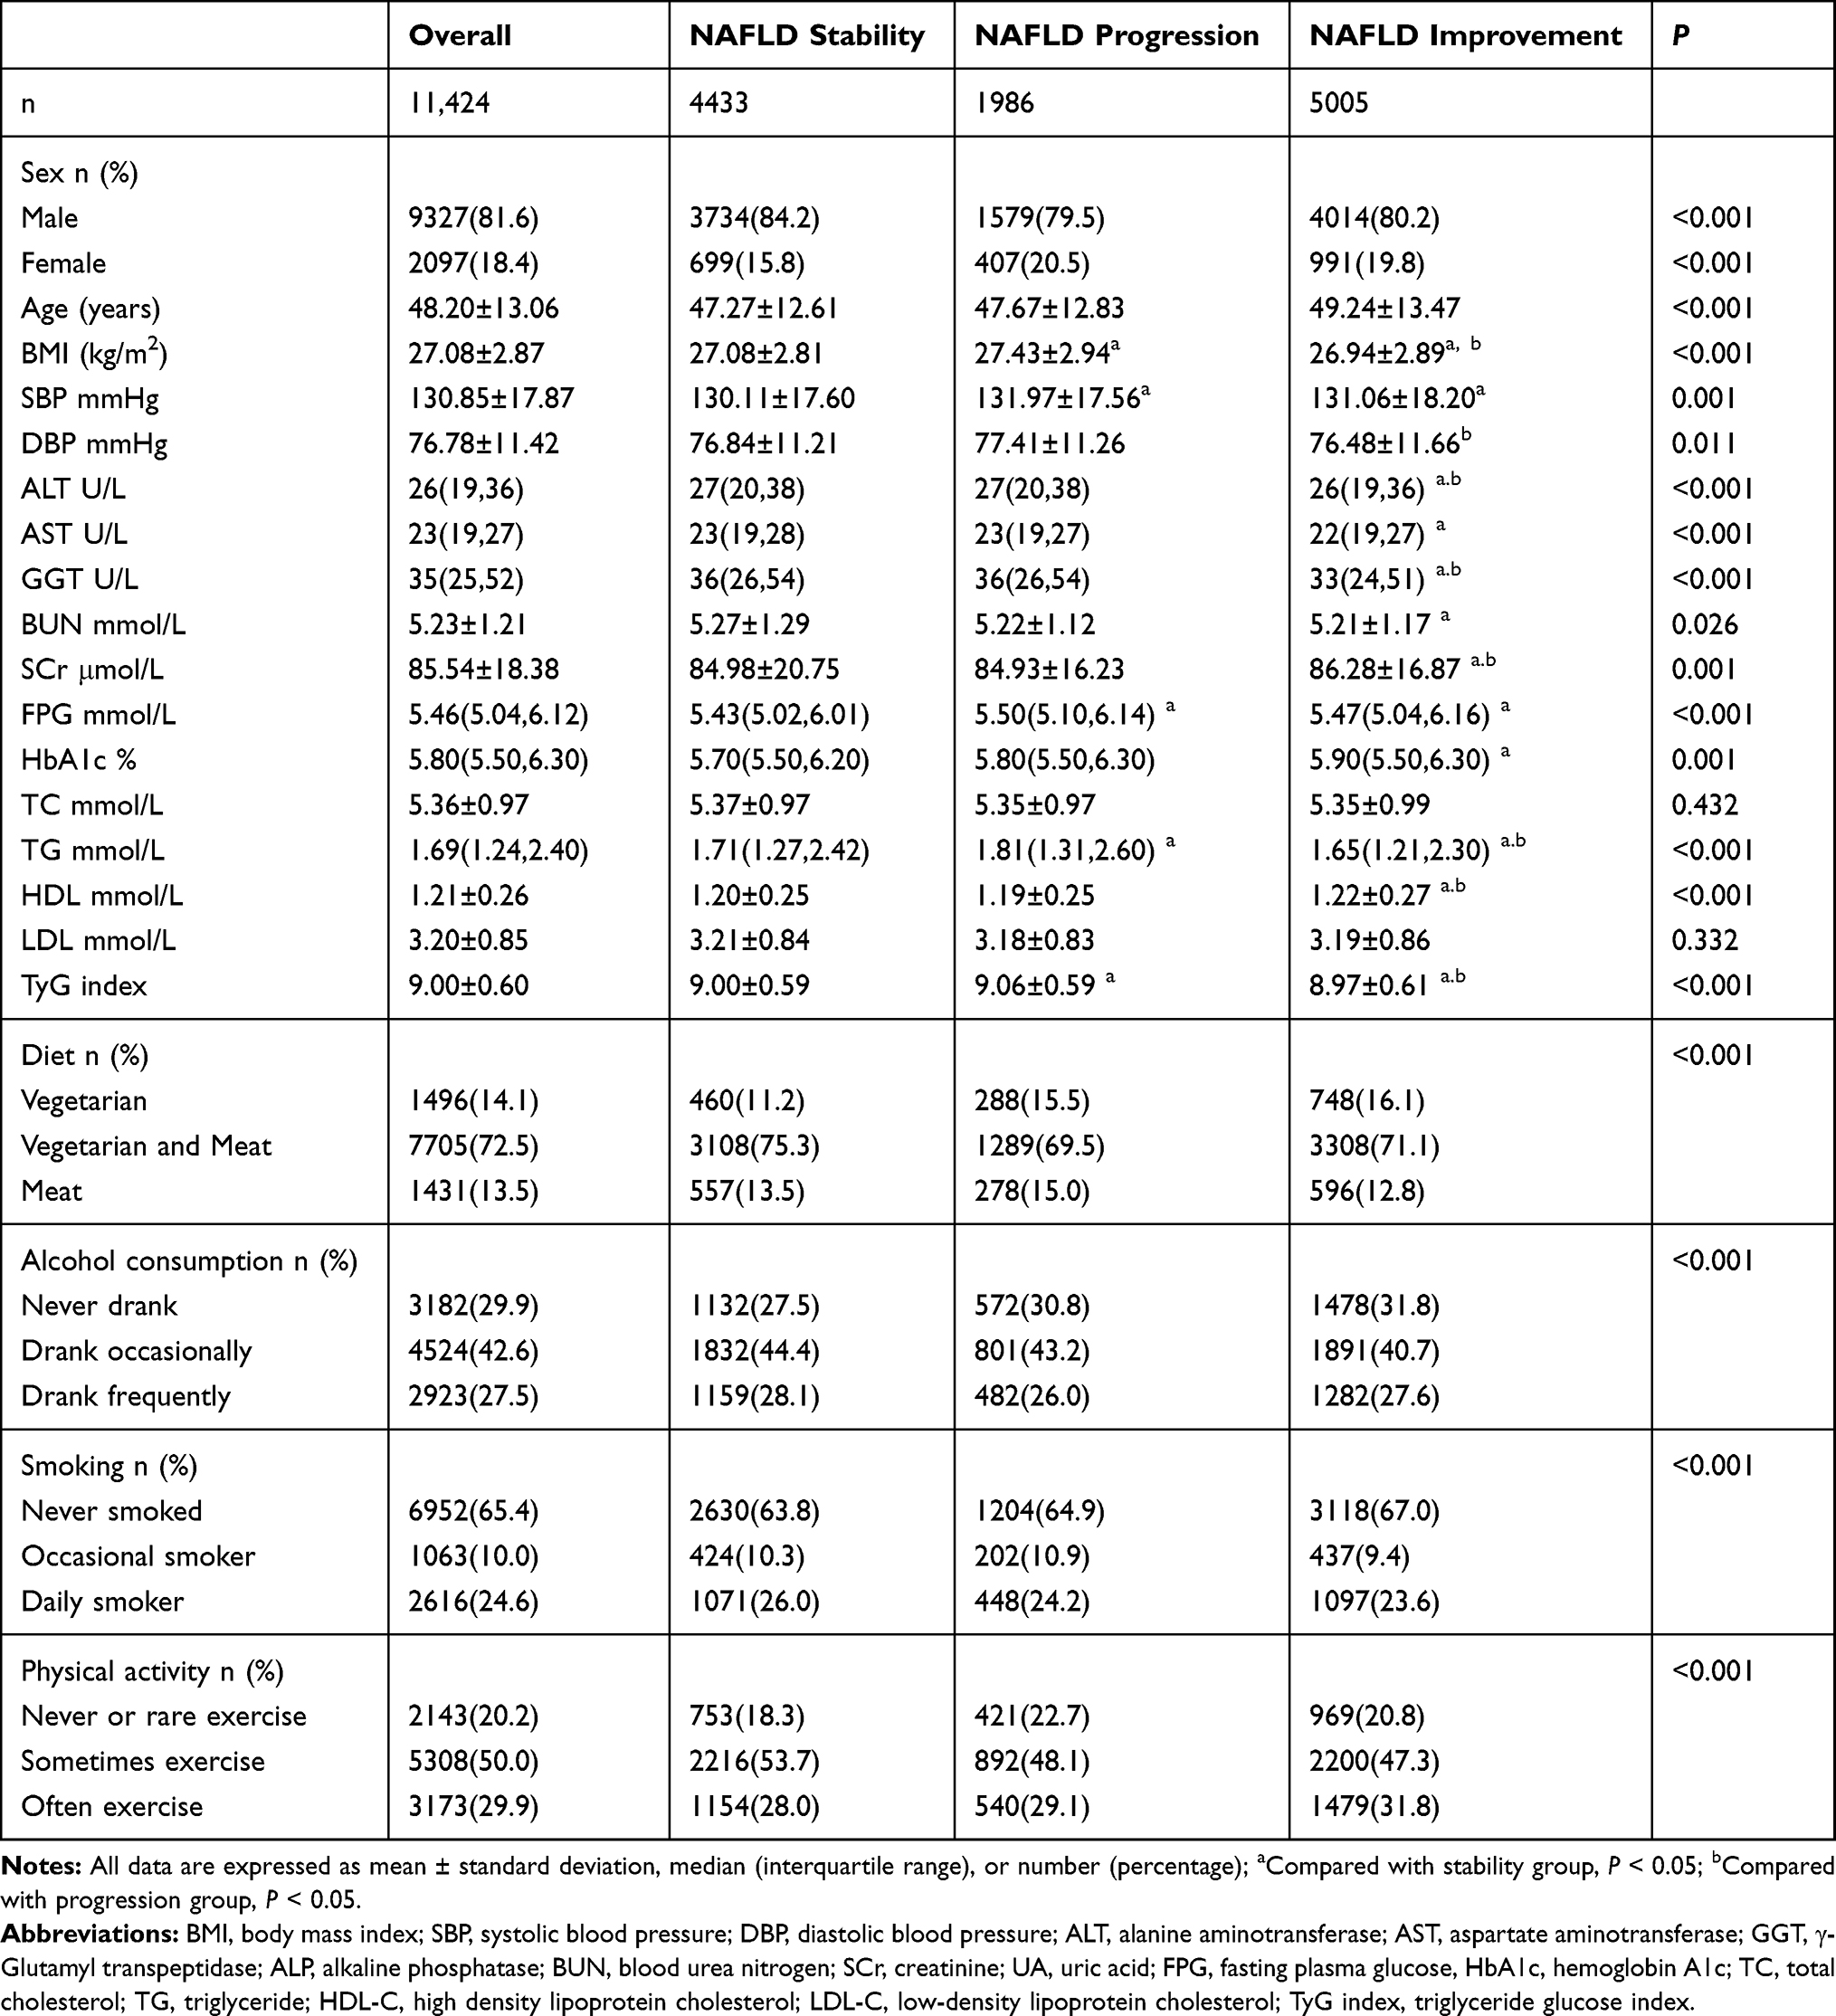 |
Table 1 Baseline Characteristics of the Subjects According to Follow-Up Outcomes |
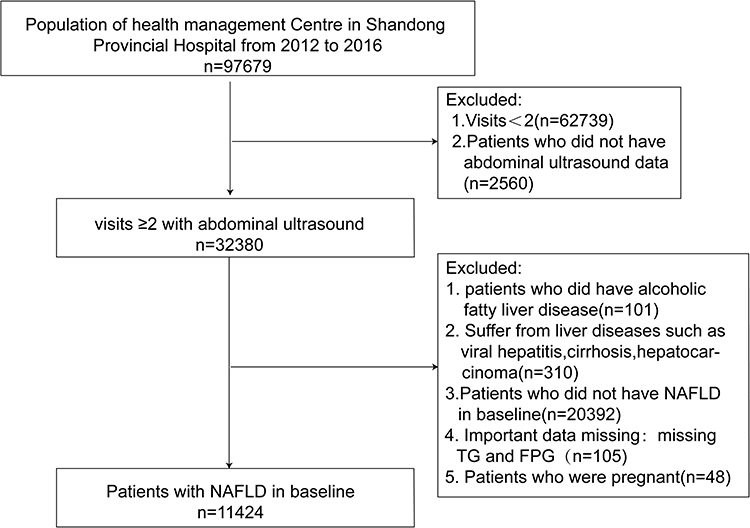 |
Figure 1 Flow chart of the study population enrolment. |
The subjects were classified into four divisions defined by quartiles of the TyG index. With the follow-up time increase, the annual progression rate and the annual improvement rate are gradually decreasing in Q1, and gradually increasing in Q4 (Supplementary Figure 1). All four divisions contained similar percentages of patients in the stability group (Figure 2A). The percentages of subjects per division increased with increasing quartiles of the TyG index in the progression group, whereas the division size decreased with increasing TyG quartiles in the improvement group (Figure 2B and C).
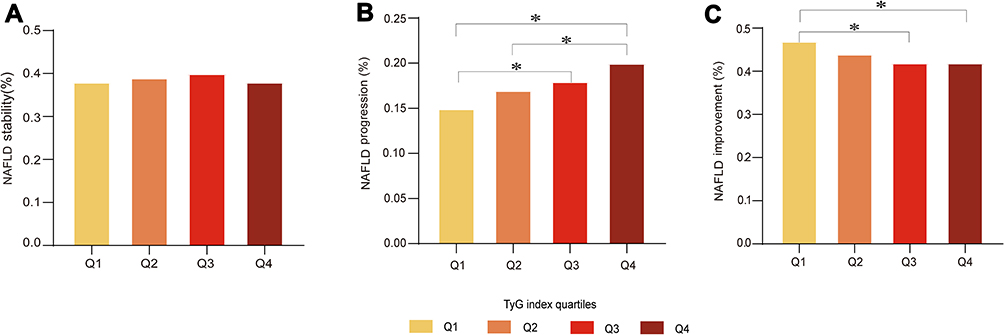 |
Figure 2 Comparison of NAFLD outcomes at varying TyG levels. (A) Percentage of NAFLD stability under TyG index quartiles. (B) Percentage of NAFLD progression under TyG index quartiles. (C) Percentage of NAFLD improvement under TyG index quartiles. *p<0.05. |
Progressively Increased Risk of NAFLD Progression with an Increased TyG Index
The TyG index had a significant positive association with the risk of NAFLD progression (Table 2). For each 1-unit increase in the TyG index, the adjusted HR of the risk of NAFLD progression increased by a factor of 1.417. When Q1 was set as a reference, the univariate Cox analysis revealed that a TyG index in Q2, Q3, or Q4 was associated with an increased HR for the progression of NAFLD in all patients [Q2:HR 1.088 (0.969 to 1.221); Q3:HR 1.187 (1.060 to 1.330); Q4:HR 1.352 (1.210 to 1.510)]. The results of the analyses adjusted for age and sex (model 1) were similar. When we further adjusted traditional risk factors and lifestyle factors, yielding model 3, the positive correlation between TyG and NAFLD progression became stronger [Q2: HR 1.082 (0.952 to 1.229); Q3: HR 1.239 (1.086 to 1.413); Q4: HR 1.448 (1.229 to 1.706)]. This correlation remains stable in ordered logistic regression [Q2: OR 1.151 (0.998 to 1.328); Q3: OR 1.345 (1.169 to 1.547); Q4: OR 1.519 (1.325 to 1.743)] (Supplementary Table 1).
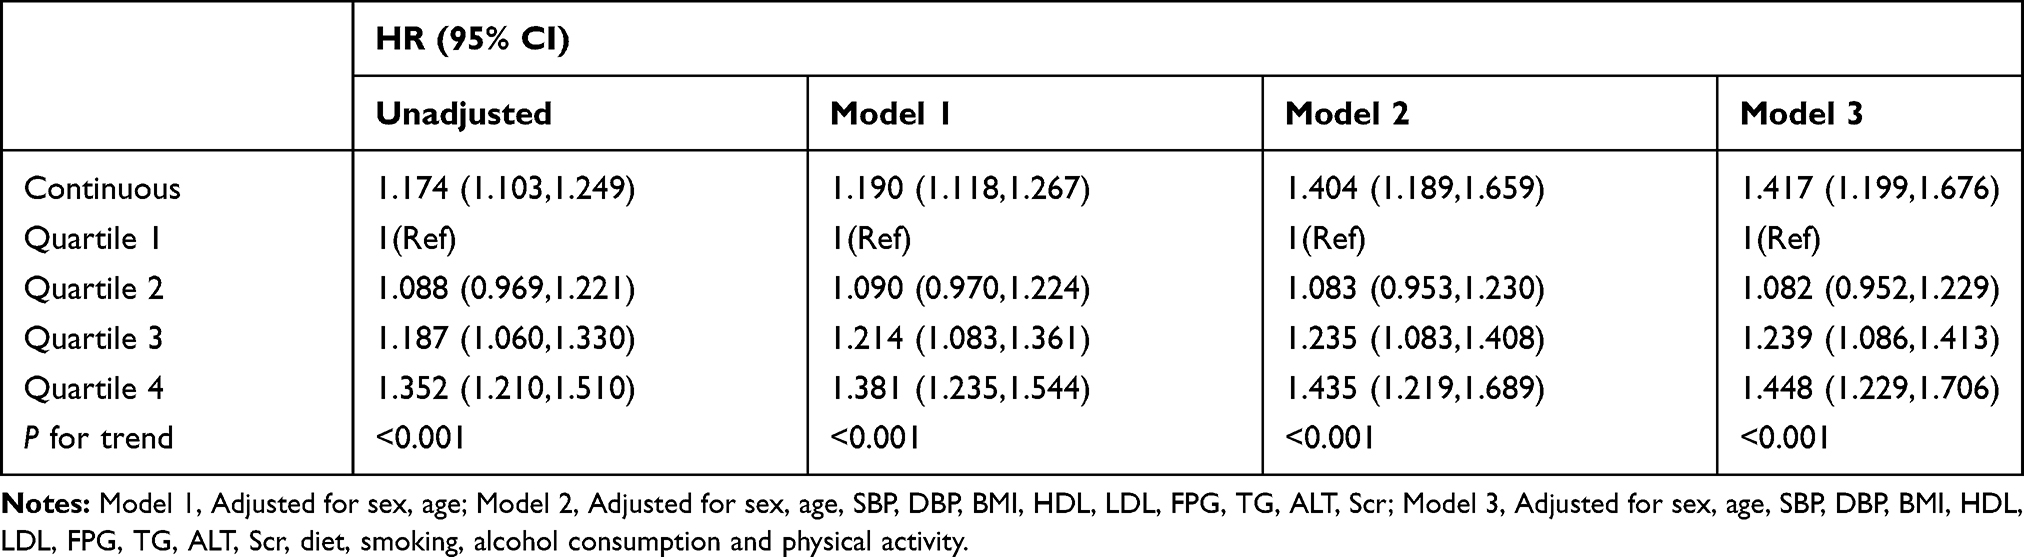 |
Table 2 Association Between TyG Index and Progression of NAFLD in Multivariate Cox Hazard Models |
Further stratified analysis was performed to investigate the independent correlation of the TyG index (per 1-unit increment) on the progression of NAFLD. The aforementioned covariates (sex, age, BMI, diet, alcohol consumption and physical activity) did not modify the relationship between the TyG index and the progression of NAFLD (Interaction-P > 0.05 in all cases). However, there was a significant positive interaction between the TyG index and smoking on the progression of NAFLD (Interaction-P=0.047) (Figure 3).
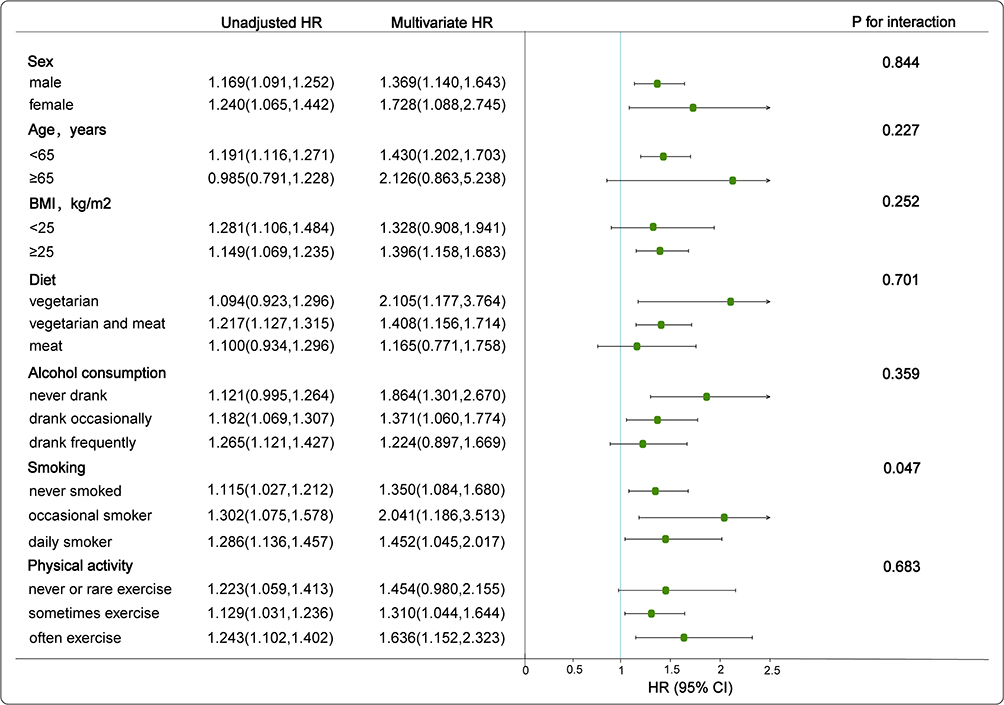 |
Figure 3 Association between TyG index and progression of NAFLD by different factors. Draw a forest plot of HR values after adjusting for sex, age, SBP, DBP, BMI, HDL, LDL, FPG, TG, ALT, Scr, diet, smoking, alcohol consumption, and physical activity. |
Progressively Reduced Probability of NAFLD Improvement with an Increased TyG Index
As shown in Table 3, each additional unit of the TyG index was associated with a 24.5% reduced probability of NAFLD improvement after adjusting for potential confounding factors. When Q1 was set as a reference, univariate Cox analysis revealed that the HR value of improvement decreased as the TyG index increased in subjects with NAFLD [Q2: HR 0.894 (0.828 to 0.966); Q3: HR 0.859 (0.794 to 0.928); Q4: HR 0.850 (0.786 to 0.918)]. This negative correlation became even stronger after adjustment for gender, age, traditional risk factors and lifestyles [Q2: HR 0.897 (0.823 to 0.976); Q3: HR 0.849 (0.775 to 0.932); Q4: HR 0.817 (0.723 to 0.923)]. This correlation remains stable in ordered logistic regression [Q2: OR 0.879 (0.786 to 0.983); Q3: OR 0.814 (0.728 to 0.911); Q4: 0.790 (0.707 to 0.884)] (Supplementary Table 2).
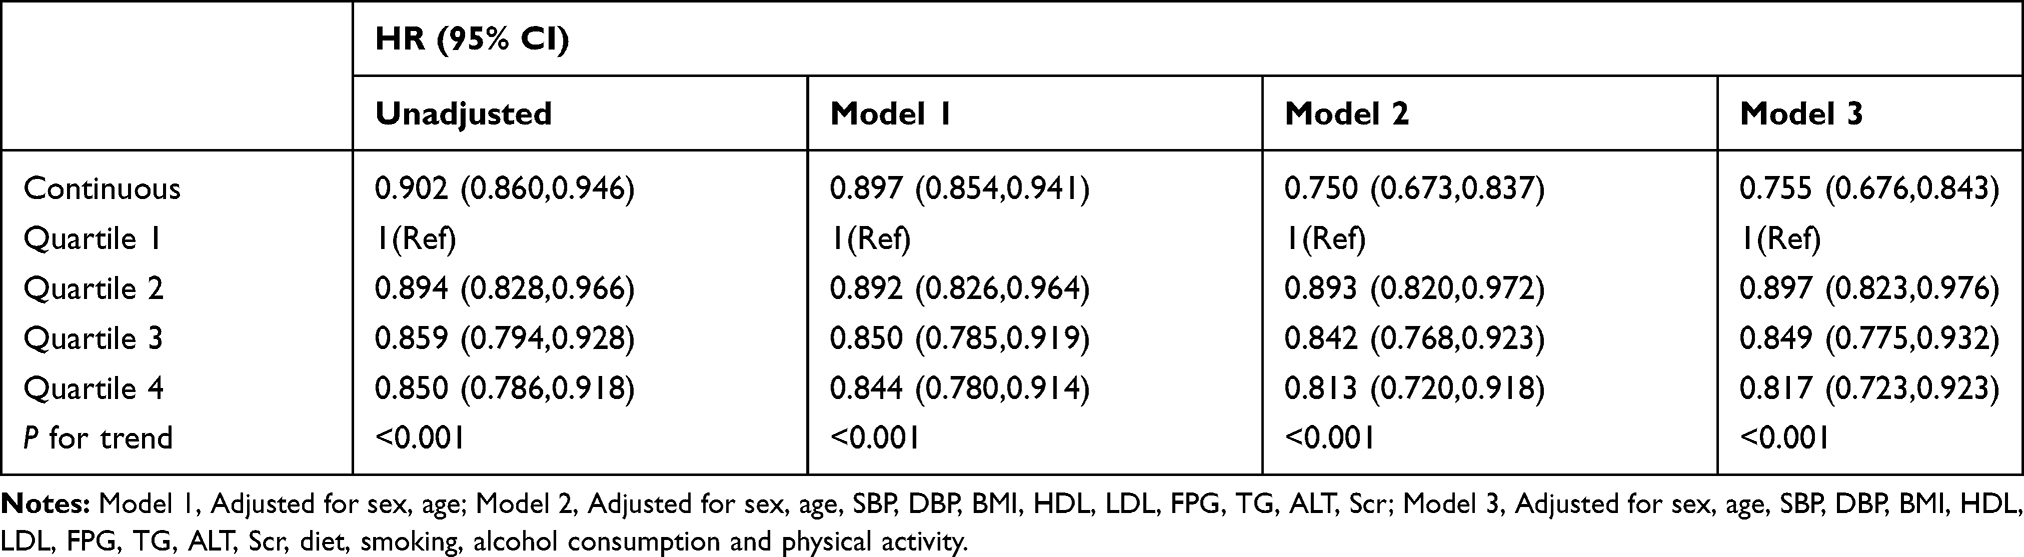 |
Table 3 Association Between TyG Index and Improvement of NAFLD in Multivariate Cox Hazard Models |
Subgroup analyses were performed to confirm the effect of the TyG index on the improvement of NAFLD in the different subgroups. The covariates of age, alcohol consumption, smoking and physical activity had no significant interaction in the multivariate Cox model (Interaction-P> 0.05 in all cases). However, the effect of the TyG index on the improvement of NAFLD showed a sex difference (Interaction-P=0.019), and the correlation between the TyG index and NAFLD improvement in the female population was better than that of males. We found that BMI and TyG index had an interactive effect on the improvement of NAFLD (Interaction-P<0.001). When BMI<25, the negative correlation between the increase of TyG index and the improvement of NAFLD becomes stronger. The same phenomenon was found in the diet group (Interaction-P =0.048). In the vegetarian group, the negative correlation between the increase of TyG index and the improvement of NAFLD was significantly enhanced (Figure 4).
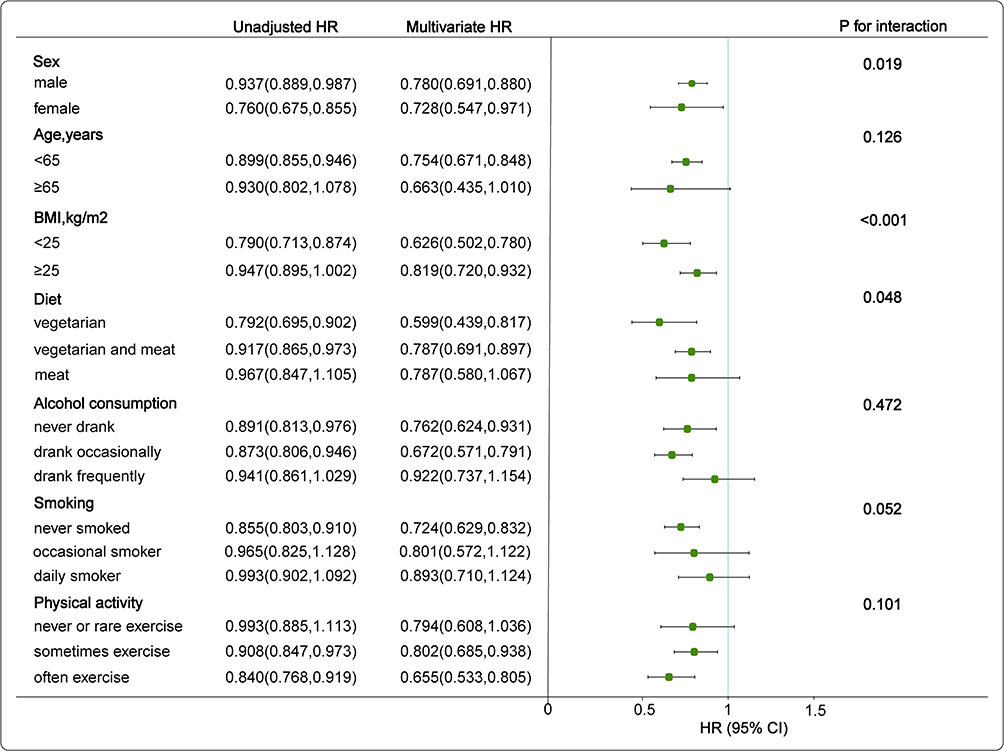 |
Figure 4 Association between TyG index and improvement of NAFLD by different factors. Draw a forest plot of HR values after adjusting for sex, age, SBP, DBP, BMI, HDL, LDL, FPG, TG, ALT, SCr, diet, smoking, alcohol consumption, and physical activity. |
Discussion
In this large longitudinal study, 38.8% of the subjects maintained the same degree of NAFLD, 17.4% of the subjects progressed to a more severe state, and 43.8% of the subjects improved. We found that basal TyG level was significantly higher in participants who progressed to NAFLD after follow-up when compared with those who sustained and improved. Patients in the highest TyG quartile (Q4) had a higher risk of NAFLD progression and a lower probability of NAFLD improvement than those in the lowest TyG quartile (Q1) after adjusting for potential confounders.
Only a few studies have reported the relationship between the TyG index and NAFLD. A cross-sectional study demonstrated that the TyG index is a viable biomarker for simple steatosis and NASH screening in asymptomatic women.21 Choe et al reported a positive correlation between the TyG index and NAFLD events in patients with chronic kidney disease.22 Tarantino et al reported the TyG index predicted NAFLD presence in bladder cancer.23 However, those studies focused on this relationship only in specific populations. Another cross-sectional study compared TyG and HOMA-IR as predictors of the prevalence of NAFLD, reporting that TyG is superior to HOMA as a NAFLD predictor and is also related to the severity of NAFLD in Korean adults.24 However, that study was cross-sectional study, making only a simple comparison between the TyG index and NAFLD events, and did not address the possibility of temporal changes in those relationships. A longitudinal cohort study showed that subjects with a high TyG index had an increased likelihood of suffering from NAFLD during the follow-up period.25 However, most of the existing studies have some obvious limitations, such as based on the specific population cohorts or failure to adjust the influence of lifestyle interventions.26,27 Evidence-based clinical guidelines for the management of NAFLD note the significance of lifestyle behaviours in patients with NAFLD.28 A healthy lifestyle may reduce NASH and hepatic fibrosis.29,30 NAFLD is increasingly emerging as a major health burden, and there are still few data on its natural history. One major reason for this is likely the difficulty of performing long-term follow-up on subjects. To our knowledge, this study is the first to provide clinical evidence elucidating the association between TyG index and the outcomes (progression and improvement) of NAFLD from a longitudinal cohort study. After 21 months of follow-up, we found that the fully adjusted HR of TyG for NAFLD progression was 1.448 (1.229 to 1.706) (P < 0.001), and that for NAFLD improvement was 0.817 (0.723 to 0.923) (P < 0.001). We focused on the relationship between baseline TyG index and the natural history of NAFLD and performed subgroup analyses stratified by lifestyle variables and other traditional risk factors. Our study showed that the TyG index was strongly related to NAFLD development and provided up-to-date information on the outcomes of NAFLD in the Chinese population.
One likely reason for the link between the TyG index and NAFLD is IR. Hepatic lipotoxicity caused by TG may be among the causes of IR. Lipotoxicity can lead to metabolic interference and a cellular stress response. When combined with hyperglycaemia, these conditions lead to islet β-cell dysfunction and IR.31,32 Thai et al demonstrated a significant correlation between the TyG index and log HOMA-IR index (r = 0.644, p < 0.0001).33 In a study carried out in Brazil, the TyG index outperformed HOMA in a hyperglycaemic clamp test and was correlated with fat distribution and fat depots, metabolic parameters and subclinical atherosclerotic markers.34 Smith et al found that the increase in circulating glucose and insulin associated with IR promoted hepatic de novo lipogenesis (DNL) in NAFLD patients.35 The carbohydrate-regulated adipogenic transcription factor ChREBP was increased in subjects with NAFLD and induced hepatic lipid accumulation.36 Excessive hepatic lipid accumulation promotes macrophage/Kupffer cell activation, exacerbating oxidative stress, inflammation and fibrosis in the liver.37 Additionally, IR induced an increase in free fatty acids (FFAs), which further contributed to oxidative stress in the liver.38,39 These mechanisms can promote NAFLD to become more severe.
Interestingly, there was an interaction effect between the TyG index and smoking on the progression of NAFLD. Smoking increases IR and is associated with NAFLD.40–42 At present, we do not have a clear answer regarding the significant positive associations between the TyG index and NAFLD progression in occasional smokers. Further research is needed to examine the relationship among occasional smoking, the TyG index and NAFLD. Meanwhile, there was a greater correlation between the TyG index and the improvement of NAFLD in the female population. A possible explanation for this inconsistency is the sex difference in IR of some factors. Compared with women, men have more risk factors related to metabolic diseases. Such as, men were more likely to be smokers and drinkers. It also manifests the importance of lifestyle on the improvement of NAFLD. In the non-obese group and the vegetarian’s group, the adjusted HR of TyG for NAFLD improvement was 0.626 (0.502 to 0.780) and 0.599 (0.439 to 0.817), respectively. This phenomenon shows that weight control and vegan diet are more beneficial to the improvement of NAFLD. The increasing prevalence of NAFLD appears to be closely associated with an increased frequency of overweight or obesity, which is related to changes in dietary habits, including the increased consumption of high-calorie foods and saturated fat. The effectiveness of weight loss and vegetarianism as lifestyle interventions seems to rely chiefly on the improvement of insulin sensitivity.43,44 In light of these discoveries, further attention should be paid to lifestyle changes, especially for obese individuals with an unhealthy lifestyle and a high TyG index.
Our findings confirmed the correlation between the TyG index and NAFLD. To the best of our knowledge, this is the first study in which the baseline TyG index is used to predict the outcomes of NAFLD, which may help target resources and interventions more effectively to those at risk. In addition, TG and FPG, as common and cost-effective laboratory markers, provide a useful tool for family doctors and primary healthcare facilities. However, our study also had several limitations. As insulin levels are rarely measured in large health management populations, we had no measures of HOMA-IR in this study, and we were not able to compare this measure with our TyG data. Therefore, the difference between the TyG index and HOMA-IR as predictors of NAFLD outcomes in the general population should be studied further in the future. Second, we did not perform hepatic biopsies in the NAFLD patients, although this method is the gold standard examination to measure intrahepatic triglyceride contents. The presence of NAFLD was assessed in our study by an experienced radiologist blinded to the patients’ clinical information. Ultrasonography, as a mature and convenient medical technology, is still one of the most commonly used first-line imaging modalities for the diagnosis and confirmation of NAFLD. Its accuracy and reliability in detecting moderate to severe fatty liver disease with a specificity of 93.6% and a sensitivity of 84.8%.45
Conclusions
In this large cohort study, the TyG index is closely related to the outcome of NAFLD. Specifically, the increased TyG level has increased the risk of NAFLD progression and reduced the possibility of NAFLD improvement, but the sex differences and lifestyle will affect this correlation. In conclusion, the TyG index might be a suitable, effective, and valuable indicator of the development of NAFLD and has significant implications for the prevention and treatment of this disease.
Acknowledgments
We thank the participants and staff for their help and support in the study.
Author Contributions
All authors made a significant contribution to the work reported, whether that is in the conception, study design, execution, acquisition of data, analysis and interpretation, or in all these areas; took part in drafting, revising or critically reviewing the article; gave final approval of the version to be published; have agreed on the journal to which the article has been submitted; and agree to be accountable for all aspects of the work.
Funding
This work was supported by grants from the National Key Research and Development Program of China (2017YFC1309800, 2017YFC0909600), and the National Natural Science Foundation (91957209).
Disclosure
The authors declare that they have no conflict of interest.
References
1. Younossi ZM, Koenig AB, Abdelatif D, Fazel Y, Henry L, Wymer M. Global epidemiology of nonalcoholic fatty liver disease-meta-analytic assessment of prevalence, incidence, and outcomes. Hepatology. 2016;64(1):73–84. doi:10.1002/hep.28431
2. Li J, Zou B, Yeo YH, et al. Prevalence, incidence, and outcome of non-alcoholic fatty liver disease in Asia, 1999–2019: a systematic review and meta-analysis. Lancet Gastroenterol Hepatol. 2019;4(5):389–398. doi:10.1016/S2468-1253(19)30039-1
3. Lee HH, Cho Y, Choi YJ, et al. Non-alcoholic steatohepatitis and progression of carotid atherosclerosis in patients with type 2 diabetes: a Korean cohort study. Cardiovasc Diabetol. 2020;19(1):81. doi:10.1186/s12933-020-01064-x
4. Chen HJ, Yang HY, Hsueh KC, et al. Increased risk of osteoporosis in patients with nonalcoholic fatty liver disease: a population-based retrospective cohort study. Medicine. 2018;97(42):e12835. doi:10.1097/MD.0000000000012835
5. Wei JL, Leung JC, Loong TC, et al. Prevalence and severity of nonalcoholic fatty liver disease in non-obese patients: a population study using proton-magnetic resonance spectroscopy. Am J Gastroenterol. 2015;110(9):1306–1314. doi:10.1038/ajg.2015.235
6. VanWagner LB, Rinella ME. Extrahepatic manifestations of nonalcoholic fatty liver disease. Curr Hepatol Rep. 2016;15(2):75–85. doi:10.1007/s11901-016-0295-9
7. Han E, Lee YH, Kim YD, et al. Nonalcoholic fatty liver disease and sarcopenia are independently associated with cardiovascular risk. Am J Gastroenterol. 2020;115(4):584–595. doi:10.14309/ajg.0000000000000572
8. Nazare JA, Smith JD, Borel AL, et al. Ethnic influences on the relations between abdominal subcutaneous and visceral adiposity, liver fat, and cardiometabolic risk profile: the international study of prediction of intra-abdominal adiposity and its relationship with cardiometabolic risk/intra-abdominal adiposity. Am J Clin Nutr. 2012;96(4):714–726. doi:10.3945/ajcn.112.035758
9. Day CP, James OF. Steatohepatitis: a tale of two “hits”? Gastroenterology. 1998;114(4):842–845. doi:10.1016/S0016-5085(98)70599-2
10. Wallace TM, Levy JC, Matthews DR. Use and abuse of HOMA modeling. Diabetes Care. 2004;27(6):1487–1495. doi:10.2337/diacare.27.6.1487
11. Raimi TH, Dele-Ojo BF, Dada SA, et al. Triglyceride-glucose index and related parameters predicted metabolic syndrome in Nigerians. Metab Syndr Relat Disord. 2021;19(2):76–82. doi:10.1089/met.2020.0092
12. Simental-Mendia LE, Rodriguez-Moran M, Guerrero-Romero F. The product of fasting glucose and triglycerides as surrogate for identifying insulin resistance in apparently healthy subjects. Metab Syndr Relat Disord. 2008;6(4):299–304. doi:10.1089/met.2008.0034
13. Guerrero-Romero F, Simental-Mendia LE, Gonzalez-Ortiz M, et al. The product of triglycerides and glucose, a simple measure of insulin sensitivity. Comparison with the euglycemic-hyperinsulinemic clamp. J Clin Endocrinol Metab. 2010;95(7):3347–3351. doi:10.1210/jc.2010-0288
14. Zhang M, Wang B, Liu Y, et al. Cumulative increased risk of incident type 2 diabetes mellitus with increasing triglyceride glucose index in normal-weight people: the rural Chinese cohort study. Cardiovasc Diabetol. 2017;16(1):30. doi:10.1186/s12933-017-0514-x
15. Barzegar N, Tohidi M, Hasheminia M, Azizi F, Hadaegh F. The impact of triglyceride-glucose index on incident cardiovascular events during 16 years of follow-up: tehran lipid and glucose study. Cardiovasc Diabetol. 2020;19(1):155. doi:10.1186/s12933-020-01121-5
16. Angoorani P, Heshmat R, Ejtahed HS, et al. Validity of triglyceride-glucose index as an indicator for metabolic syndrome in children and adolescents: the CASPIAN-V study. Eat Weight Disord. 2018;23(6):877–883. doi:10.1007/s40519-018-0488-z
17. Guo W, Lu J, Qin P, et al. The triglyceride-glucose index is associated with the severity of hepatic steatosis and the presence of liver fibrosis in non-alcoholic fatty liver disease: a cross-sectional study in Chinese adults. Lipids Health Dis. 2020;19(1):218. doi:10.1186/s12944-020-01393-6
18. Khamseh ME, Malek M, Abbasi R, Taheri H, Lahouti M, Alaei-Shahmiri F. Triglyceride glucose index and related parameters (triglyceride glucose-body mass index and triglyceride glucose-waist circumference) identify nonalcoholic fatty liver and liver fibrosis in individuals with overweight/obesity. Metab Syndr Relat Disord. 2021;19(3):167–173. doi:10.1089/met.2020.0109
19. Seitz HK, Bataller R, Cortez-Pinto H, et al. Alcoholic liver disease. Nat Rev Dis Primers. 2018;4(1):16.
20. Mathurin P, Bataller R. Trends in the management and burden of alcoholic liver disease. J Hepatol. 2015;62(1 Suppl):S38–46. doi:10.1016/j.jhep.2015.03.006
21. Simental-Mendia LE, Simental-Mendia E, Rodriguez-Hernandez H, Rodriguez-Moran M, Guerrero-Romero F. The product of triglycerides and glucose as biomarker for screening simple steatosis and NASH in asymptomatic women. Ann Hepatol. 2016;15(5):715–720. doi:10.5604/16652681.1212431
22. Choe AR, Ryu DR, Kim HY, et al. Noninvasive indices for predicting nonalcoholic fatty liver disease in patients with chronic kidney disease. BMC Nephrol. 2020;21(1):50. doi:10.1186/s12882-020-01718-8
23. Tarantino G, Crocetto F, Di Vito C, et al. Association of NAFLD and insulin resistance with non metastatic bladder cancer patients: a cross-sectional retrospective study. J Clin Med. 2021;10(2):346. doi:10.3390/jcm10020346
24. Lee SB, Kim MK, Kang S, et al. Triglyceride glucose index is superior to the homeostasis model assessment of insulin resistance for predicting nonalcoholic fatty liver disease in Korean adults. Endocrinol Metab. 2019;34(2):179–186. doi:10.3803/EnM.2019.34.2.179
25. Kitae A, Hashimoto Y, Hamaguchi M, Obora A, Kojima T, Fukui M. The triglyceride and glucose index is a predictor of incident nonalcoholic fatty liver disease: a population-based cohort study. Can J Gastroenterol Hepatol. 2019;2019:5121574. doi:10.1155/2019/5121574
26. Zheng R, Du Z, Wang M, Mao Y, Mao W. A longitudinal epidemiological study on the triglyceride and glucose index and the incident nonalcoholic fatty liver disease. Lipids Health Dis. 2018;17(1):262. doi:10.1186/s12944-018-0913-3
27. Huanan C, Sangsang L, Amoah AN, et al. Relationship between triglyceride glucose index and the incidence of non-alcoholic fatty liver disease in the elderly: a retrospective cohort study in China. BMJ Open. 2020;10(11):e039804. doi:10.1136/bmjopen-2020-039804
28. Chalasani N, Younossi Z, Lavine JE, et al. The diagnosis and management of nonalcoholic fatty liver disease: practice guidance from the American association for the study of liver diseases. Hepatology. 2018;67(1):328–357.
29. Kistler KD, Brunt EM, Clark JM, et al. Physical activity recommendations, exercise intensity, and histological severity of nonalcoholic fatty liver disease. Am J Gastroenterol. 2011;106(3):460–468. doi:10.1038/ajg.2010.488
30. O’Gorman P, Naimimohasses S, Monaghan A, et al. Improvement in histological endpoints of MAFLD following a 12-week aerobic exercise intervention. Aliment Pharmacol Ther. 2020;52(8):1387–1398. doi:10.1111/apt.15989
31. Alcala M, Calderon-Dominguez M, Serra D, Herrero L, Ramos MP, Viana M. Short-term vitamin E treatment impairs reactive oxygen species signaling required for adipose tissue expansion, resulting in fatty liver and insulin resistance in obese mice. PLoS One. 2017;12(10):e0186579. doi:10.1371/journal.pone.0186579
32. Masschelin PM, Cox AR, Chernis N, Hartig SM. The impact of oxidative stress on adipose tissue energy balance. Front Physiol. 2019;10:1638. doi:10.3389/fphys.2019.01638
33. Thai PV, Tien HA, Van Minh H, Valensi P. Triglyceride glucose index for the detection of asymptomatic coronary artery stenosis in patients with type 2 diabetes. Cardiovasc Diabetol. 2020;19(1):137. doi:10.1186/s12933-020-01108-2
34. Vasques AC, Novaes FS, de Oliveira Mda S, et al. TyG index performs better than HOMA in a Brazilian population: a hyperglycemic clamp validated study. Diabetes Res Clin Pract. 2011;93(3):e98–e100. doi:10.1016/j.diabres.2011.05.030
35. Smith GI, Shankaran M, Yoshino M, et al. Insulin resistance drives hepatic de novo lipogenesis in nonalcoholic fatty liver disease. J Clin Invest. 2020;130(3):1453–1460. doi:10.1172/JCI134165
36. Ter Horst KW, Vatner DF, Zhang D, et al. Hepatic insulin resistance is not pathway selective in humans with nonalcoholic fatty liver disease. Diabetes Care. 2021;44(2):489–498. doi:10.2337/dc20-1644
37. Matsuzawa N, Takamura T, Kurita S, et al. Lipid-induced oxidative stress causes steatohepatitis in mice fed an atherogenic diet. Hepatology. 2007;46(5):1392–1403. doi:10.1002/hep.21874
38. Mendez-Sanchez N, Arrese M, Zamora-Valdes D, Uribe M. Current concepts in the pathogenesis of nonalcoholic fatty liver disease. Liver Int. 2007;27(4):423–433. doi:10.1111/j.1478-3231.2007.01483.x
39. Shah P, Basu A, Rizza R. Fat-induced liver insulin resistance. Curr Diab Rep. 2003;3(3):214–218. doi:10.1007/s11892-003-0066-1
40. Wu F, Pahkala K, Juonala M, et al. Childhood and adulthood passive smoking and nonalcoholic fatty liver in midlife: a 31-year cohort study. Am J Gastroenterol. 2021. doi:10.14309/ajg.0000000000001141
41. Liu Y, Dai M, Bi Y, et al. Active smoking, passive smoking, and risk of nonalcoholic fatty liver disease (NAFLD): a population-based study in China. J Epidemiol. 2013;23(2):115–121. doi:10.2188/jea.JE20120067
42. Yang Y, Yang C, Lei Z, et al. Cigarette smoking exposure breaks the homeostasis of cholesterol and bile acid metabolism and induces gut microbiota dysbiosis in mice with different diets. Toxicology. 2021;450:152678. doi:10.1016/j.tox.2021.152678
43. Nseir W, Hellou E, Assy N. Role of diet and lifestyle changes in nonalcoholic fatty liver disease. World J Gastroenterol. 2014;20(28):9338–9344. doi:10.3748/wjg.v20.i28.9338
44. Cortez-Pinto H, Machado M. Impact of body weight, diet and lifestyle on nonalcoholic fatty liver disease. Expert Rev Gastroenterol Hepatol. 2008;2(2):217–231. doi:10.1586/17474124.2.2.217
45. Hernaez R, Lazo M, Bonekamp S, et al. Diagnostic accuracy and reliability of ultrasonography for the detection of fatty liver: a meta-analysis. Hepatology. 2011;54(3):1082–1090. doi:10.1002/hep.24452
 © 2021 The Author(s). This work is published and licensed by Dove Medical Press Limited. The full terms of this license are available at https://www.dovepress.com/terms.php and incorporate the Creative Commons Attribution - Non Commercial (unported, v3.0) License.
By accessing the work you hereby accept the Terms. Non-commercial uses of the work are permitted without any further permission from Dove Medical Press Limited, provided the work is properly attributed. For permission for commercial use of this work, please see paragraphs 4.2 and 5 of our Terms.
© 2021 The Author(s). This work is published and licensed by Dove Medical Press Limited. The full terms of this license are available at https://www.dovepress.com/terms.php and incorporate the Creative Commons Attribution - Non Commercial (unported, v3.0) License.
By accessing the work you hereby accept the Terms. Non-commercial uses of the work are permitted without any further permission from Dove Medical Press Limited, provided the work is properly attributed. For permission for commercial use of this work, please see paragraphs 4.2 and 5 of our Terms.