")
Back to Journals » Diabetes, Metabolic Syndrome and Obesity » Volume 15
Association Between the Risk of Non-Alcoholic Fatty Liver Disease in Patients with Type 2 Diabetes and Chronic Kidney Disease
Authors Zhao P, Yan J, Pan B, Liu J , Fu S, Cheng J, Wang L, Jing G, Li Q
Received 30 December 2021
Accepted for publication 1 April 2022
Published 14 April 2022 Volume 2022:15 Pages 1141—1151
DOI https://doi.org/10.2147/DMSO.S356497
Checked for plagiarism Yes
Review by Single anonymous peer review
Peer reviewer comments 3
Editor who approved publication: Professor Ming-Hui Zou
Pingping Zhao,1 Junxin Yan,1 Binjing Pan,1 Jingfang Liu,1,2 Songbo Fu,1,2 Jianguo Cheng,1,2 Liting Wang,1,2 Gaojing Jing,1,2 Qiong Li1,2
1The First Clinical Medical College, Lanzhou University, Lanzhou, Gansu, People’s Republic of China; 2Department of Endocrinology, The First Hospital of Lanzhou University, Lanzhou, Gansu, People’s Republic of China
Correspondence: Jingfang Liu, Department of Endocrinology, the First Hospital of Lanzhou University, Lanzhou, Gansu, 730000, People’s Republic of China, Tel +86 931-8356242, Email [email protected]
Objective: To explore the relationship between non-alcoholic fatty liver disease (NAFLD) and chronic kidney disease (CKD) in patients with type 2 diabetes mellitus (T2DM).
Methods: A total of 1168 patients with T2DM were divided into the non-CKD and CKD groups, and the difference in the prevalence of NAFLD was compared. The differences in serum creatinine (SCr) and urine albumin-to-creatinine ratio (UACR) levels were compared between the non-NAFLD and NAFLD groups. Patients with T2DM were divided into three groups according to their UACR levels (UACR < 30 mg/g [U1 group]; UACR ≤ 30 mg/g to < 300 mg/g [U2 group]; and UACR ≥ 300 mg/g [U3 group]) or estimated glomerular filtration rate (eGFR) levels (≥ 90 mL/min [G1 group]; eGFR ≤ 60 mL/min to < 90 mL/min [G2 group]; and eGFR < 60 mL/min (G3 group]). The difference in the prevalence and risks of NAFLD in the different UACR or eGFR level groups was analyzed.
Results: The prevalence of NAFLD in the CKD group was higher than that in the non-CKD group (63.5% vs 50.5%, p < 0.001). The SCr and UACR levels in the NAFLD group were higher than those in the non-NAFLD group (both p< 0.05). The prevalence of NAFLD in the U3 group (75.6%) was higher than that in the U1 (50.5%, p < 0.05) and U2 (60.1%, p < 0.05) groups, and the prevalence of NAFLD in the U2 group (60.1%) was higher than that in the U1 group (50.5%, p < 0.05). The risk of NAFLD in the U3 group was higher than that in the U2 group (odds ratio [OR] = 3.032 and 1.473). Despite adjusting the parameters further, the NAFLD risk in the U3 group remained higher than that in the U2 group (OR = 1.660 and 2.342).
Conclusion: The risk of NAFLD in patients with T2DM is closely related to CKD.
Keywords: type 2 diabetes, non-alcoholic fatty liver disease, chronic kidney disease
Introduction
According to a report by the International Diabetes Federation in 2019, there are approximately 463 million patients with diabetes worldwide, 90% of whom have type 2 diabetes mellitus (T2DM). The number of patients with diabetes in China is approximately 129.8 million, accounting for a quarter of the global total. Diabetes mellitus has become an important public health problem.1
Chronic kidney disease (CKD) secondary to diabetes has become the main cause of end-stage renal disease in China.2 It has been reported that 20–40% of patients with diabetes will eventually develop kidney damage.3,4 According to a survey of more than 60,000 patients with T2DM in 28 countries, the prevalence rate of CKD was 27.9%.5 In the United States, its prevalence was 23.7%, according to the National Nutrition and Health Survey.5,6 Meanwhile, a retrospective survey of chronic complications of T2DM conducted by the Chinese Diabetes Association in 2001 showed that the prevalence of renal complications in patients with T2DM in tertiary hospitals was 34.7%.7
Non-alcoholic fatty liver disease (NAFLD) is a chronic metabolic disease closely related to insulin resistance (IR) and one of the causes of CKD.8–10 Furthermore, NAFLD is associated with an increased risk of T2DM11,12 and increased prevalence and morbidity of CKD.13–15 However, a negative correlation has also been found between NAFLD and the prevalence of diabetic retinopathy or nephropathy in Korean and Iranian patients with T2DM,16,17 and another study showed that there is no relationship between CKD and NAFLD.18 Thus, the relationship between CKD and NAFLD remains controversial.
Most scholars believe that the relationship between NAFLD and CKD is bidirectional in patients with T2DM.19 The same pathogenic mechanisms between CKD and NAFLD were revealed, such as excessive oxidative stress, out of control renin-angiotensin-aldosterone system (renin-angiotensin-aldosterone system, [RAAS]), and changes in intestinal flora.20 This study aimed to explore the relationship between NAFLD and CKD in patients with T2DM.
Participants and Methods
Participants
A total of 1213 patients diagnosed with T2DM in the Department of Endocrinology of Lanzhou University First Hospital from April 2016 to December 2020 were selected according to the inclusion and exclusion criteria. Eventually, 1168 patients were enrolled in this study. This study was approved by the Ethics Committee of the First Hospital of Lanzhou University, and all participants provided written informed consent. The STROBE flow chart is shown in Figure 1.
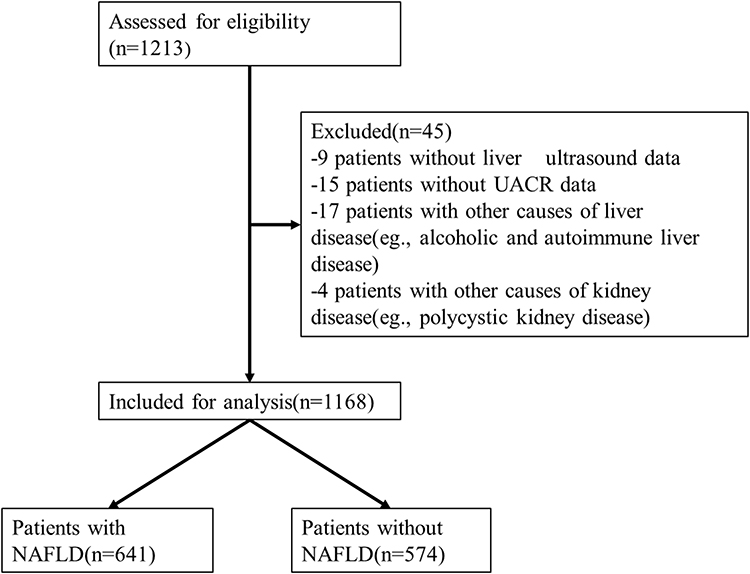 |
Figure 1 Diagram of the study design. |
Inclusion Criteria
- Patients with T2DM aged ≥ 18 years and (2) duration of T2DM ≥ 1 year.
Exclusion Criteria
- Patients with kidney diseases caused by diseases other than diabetes, such as primary nephrotic syndrome, glomerulonephritis, renal artery stenosis, acute renal failure, polycystic kidney disease, and urinary tract infection; (2) patients with abnormal liver function due to other causes, such as malignant tumors, liver cirrhosis, chronic and heavy alcohol consumption (>140 g of ethanol per week for men and >70 g for women), positive markers of viral hepatitis, autoimmune hepatitis, and a history of drug use of liver injury; and (3) lack of clinical data.
Methods
Data Collection
The name, sex, age, height, weight, systolic and diastolic blood pressure, diabetes duration, hypertension (HP), history of other diseases, and therapeutic drugs of each participant were reviewed.
The levels of aspartate aminotransferase (AST), alanine aminotransferase (ALT), alkaline phosphatase (ALP), gamma-glutamyl transferase (GGT), triglycerides (TG), total cholesterol (TC), high-density lipoprotein cholesterol (HDL-C), low-density lipoprotein cholesterol (LDL-C), serum uric acid (SUA), serum creatinine (SCr), and blood urea nitrogen (BUN) levels were measured using a BS-220 automatic biochemical analyzer (Shenzhen Mindray Bio-Medical Electronics Co., Ltd.; Shenzhen, China). In addition, the glycosylated hemoglobin (HbAlc) level was measured using high-performance liquid chromatography (Bio-Rad-D10; Bio-Rad Laboratories; Hercules, California). Furthermore, fasting plasma glucose (FPG), fasting insulin (FINS), and 2-hour postprandial plasma glucose (2hPG) levels were measured using a chemiluminescence assay (ADVIA Centaur-XP; Siemens Healthineers; Erlangen, Germany). Urinary microalbumin level was determined by rate scattering turbidimetry, while urinary creatinine (CR) was measured using the creatinine oxidase method.
The body mass index (BMI) was calculated as weight (kg)/height (m2).
The homeostasis model assessment of insulin resistance (HOMA-IR) was calculated using the following formula: HOMA-IR = FPG × FINS/22.5.
The urine albumin-to-creatinine ratio (UACR) was calculated as follows: albumin (mg/24 h)/Cr (g/24 h).
The estimated glomerular filtration rate (eGFR) was calculated using the following formula: eGFR = 186 × SCr - 1.154 × age - 0.203 (female × 0.742) mL/(min/1.73).21
Diagnostic Criteria
T2DM was diagnosed according to the World Health Organization 1999 criteria.
NAFLD was diagnosed according to the criteria published by the American Society of Liver Diseases in 2017. Each participant was examined using abdominal ultrasound by an experienced sonographer. The presence of any two of the following abdominal ultrasound findings suggested diffuse fatty liver: (1) the near-field echo of the liver showing diffuse enhancement stronger than that of the kidney and spleen; (2) unclear intrahepatic duct structure; and (3) gradually weakening far-field echo of the liver.
The diagnostic criteria of CKD were based on the UACR level ≥ 30 mg/g or eGFR level < 60 mL/min.
Study Population Grouping
Depending on the presence or absence of CKD in the patients with T2DM, the study population was divided into the CKD and non-CKD groups. The difference in the prevalence of NAFLD and other indicators between the CKD and non-CKD groups were compared.
Depending on the presence or absence of NAFLD in the patients with T2DM, the study population was divided into the NAFLD and non-NAFLD groups. The differences in the SCr, eGFR, and UACR levels between the non-NAFLD and NAFLD groups were compared.
Patients with T2DM were grouped according to the UACR or eGFR level as follows: U1 group: UACR < 30 mg/g; U2 group: UACR ≤ 30 mg/g to < 300 mg/g; and U3 group: UACR ≥ 300 mg/g and G1 group: ≥ 90 mL/min; G2 group: eGFR ≤ 60 mL/min to < 90 mL/min; and G3 group: eGFR < 60 mL/min. The differences in the prevalence and risk of NAFLD in the different UACR or eGFR level groups were compared.
Statistical Methods
The data were analyzed using the Statistical Package for the Social Sciences software (version 26.0; IMB; Armonk, New York). Normally distributed measurement data are expressed as the mean ± standard deviation ( ), and non-normally distributed measurement data are expressed as the median and interquartile range. The numerical data are expressed as frequencies and percentages (%). The t-test and Mann–Whitney U-test were used for the normally and non-normally distributed data, respectively, while the chi-square test was used for the numerical data. The p value of intra-group multiple comparisons was adjusted using the Bonferroni method. The risks of NAFLD were analyzed using stratified logistic regression analysis. A p-value <0.05 was considered statistically significant.
Results
Comparison of the Prevalence of NAFLD and Other Indicators Between the CKD and Non-CKD Groups
A total of 1168 patients with T2DM were divided into the CKD and non-CKD groups. CKD was diagnosed in 394 patients (33.7%). Of the participants, 737 were male (63.1%) and 431 were female (36.9%). The mean age was 59.66 ± 19.88 years (range 35–85 years).
The prevalence of NAFLD in the CKD group was higher than that in the non-CKD group (63.5% vs 50.5%, p<0.001). In addition, age; duration of diabetes; prevalence of HP; systolic blood pressure (SBP); and AST, ALP, SUA, HbAlc, FPG, 2hPG, HOMA-IR, SCr, BUN, and UACR levels in the CKD group were higher than those in the non-CKD group. However, the ALT, HDL-C, and eGFR levels in the CKD group were lower than those in the non-CKD group (Table 1).
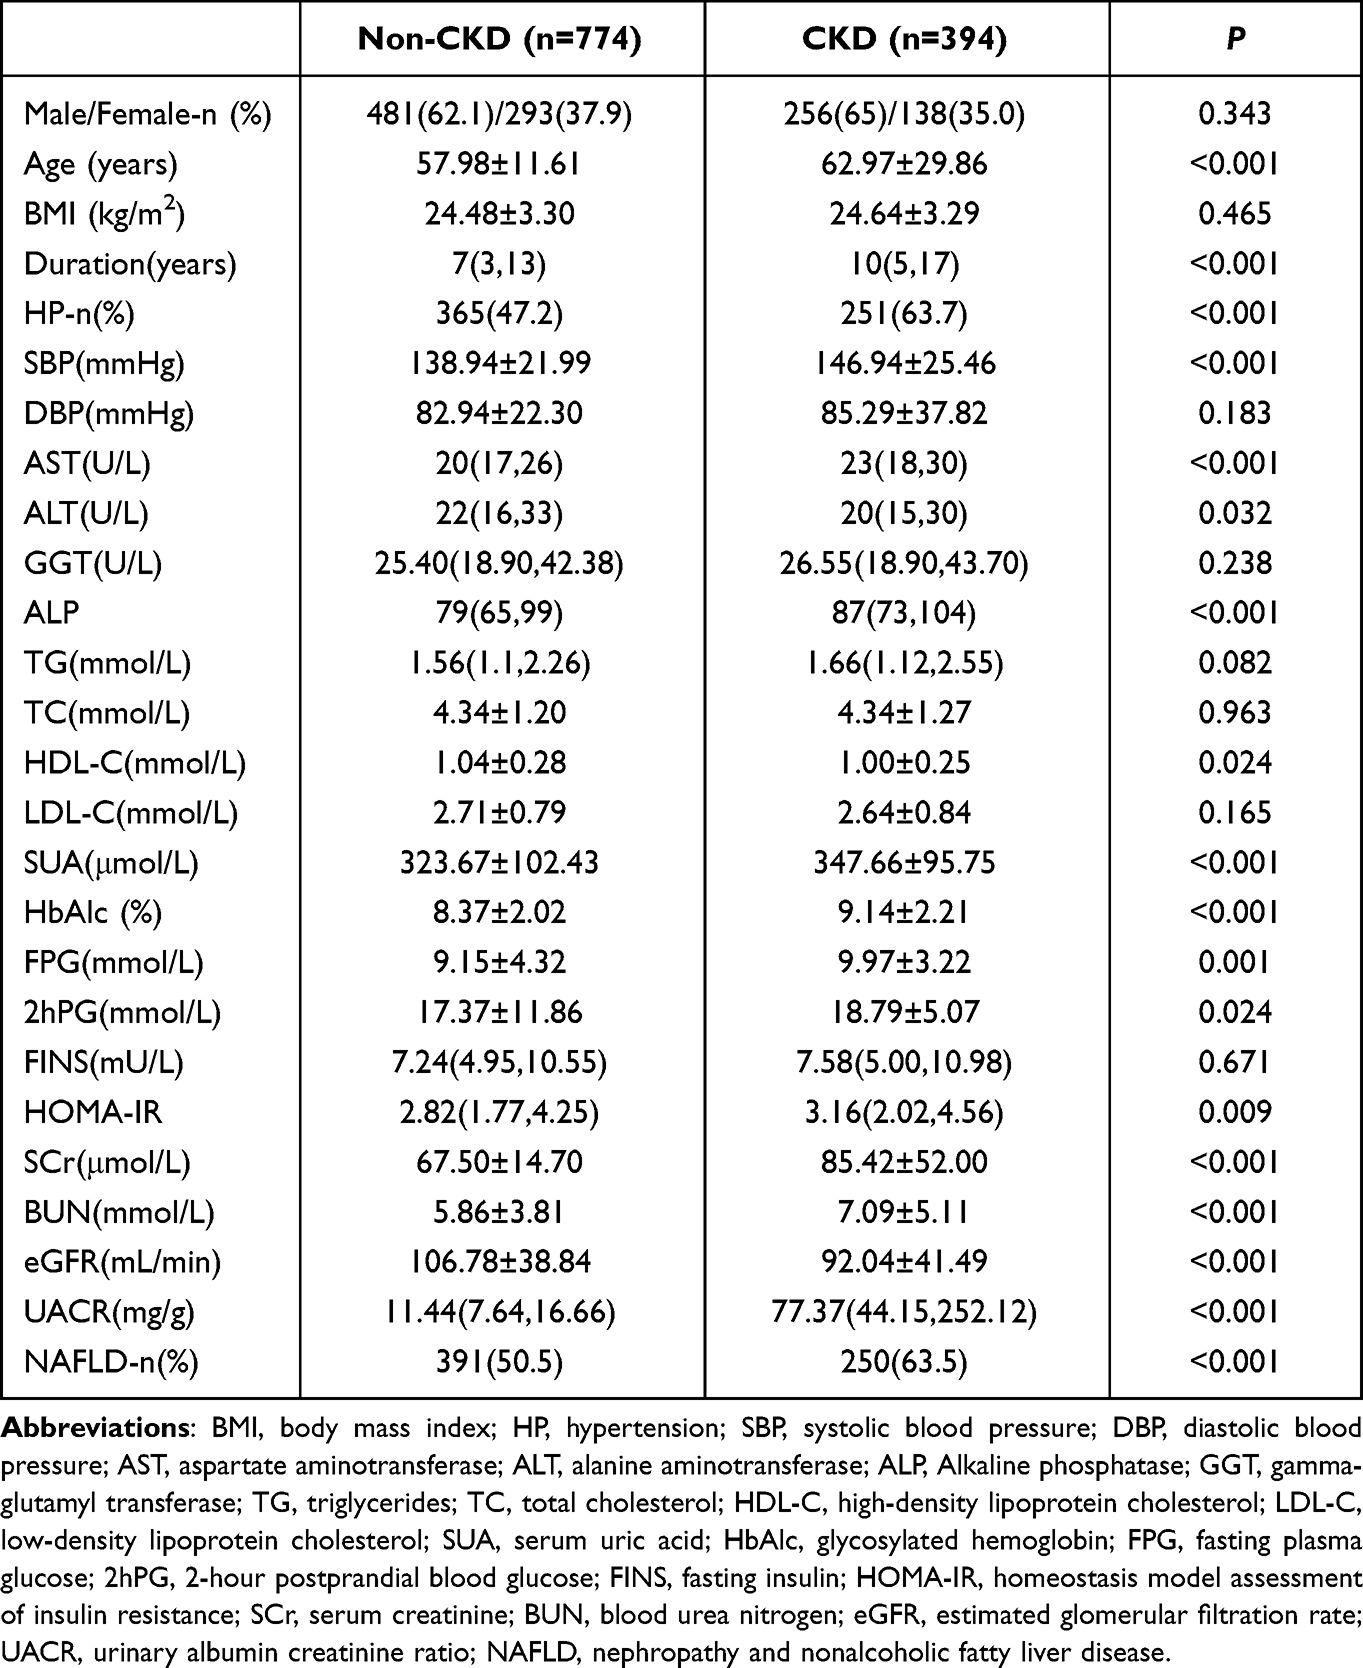 |
Table 1 Comparison of the Prevalence of NAFLD and the Other Indicators Between CKD and Non-CKD Groups |
Comparison of the SCr, UACR, and eGFR Levels Between the NAFLD and Non-NAFLD Groups
The SCr (76.36 ± 35.93 µmol/L) and UACR (20.49 [10.42, 62.31] mg/g) levels in the NAFLD group were higher than those in the non-NAFLD group (70.05 ± 30.19 µmol/L, p<0.05 and 14.56 [8.47, 32.84] mg/g, p<0.001). Conversely, the eGFR level in the NAFLD group was lower than that in the non-NAFLD group (98.00 ± 47.00 mL/min vs 106.44 ± 31.61 mL/min, p<0.001) (Figure 2).
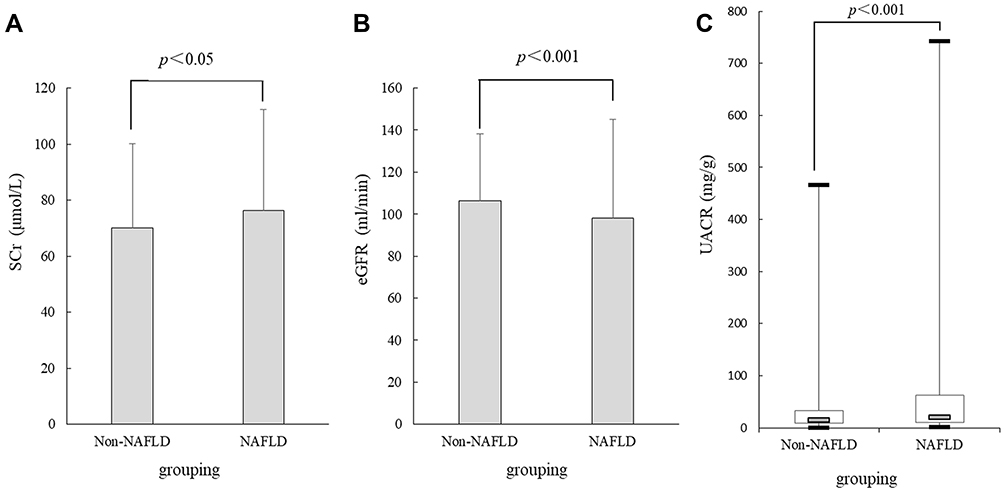 |
Figure 2 Comparison of the SCr, UACR, and eGFR levels between the NAFLD and non-NAFLD groups. (A) SCr level, (B) eGFR level, (C) UACR level. Abbreviations: SCr, serum creatinine; eGFR, estimated glomerular filtration rate; UACR, urinary albumin creatinine ratio; NAFLD, non-alcoholic fatty liver disease. |
Comparison of the Prevalence of NAFLD in the Different UACR Level Groups
The prevalence of NAFLD in U3 group (75.6%) was higher than that in U1 group (50.5%, p<0.05) and U2 group (60.1%, p<0.05), and the prevalence of NAFLD in U2 group (60.1%) was higher than that in U1 group (50.5%, p<0.05)(Figure 3A).
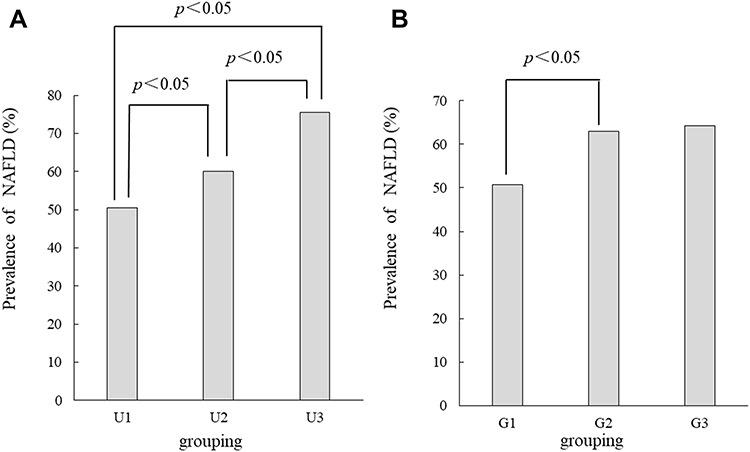 |
Figure 3 Comparison of the prevalence of NAFLD in the different UACR level groups or eGFR level groups. (A) The prevalence of NAFLD in different UACR levels groups, (B) the prevalence of NAFLD in different eGFR levels groups. Abbreviations: eGFR, estimated glomerular filtration rate; UACR, urinary albumin creatinine ratio; NAFLD, non-alcoholic fatty liver disease. |
Comparison of the Prevalence of NAFLD in the Different eGFR Level Groups
The prevalence of NAFLD in G2 group (63.0%) was higher than that in G1group (50.8%, p<0.05), and no significant difference was found between G1 and G3 groups (50.8% vs 64.3%, p>0.05), or between G2 and G3 groups (63.0% vs 64.3%, p>0.05) (Figure 3B).
Correlation Analysis of NAFLD and CKD in Patients with T2DM Using Univariate Logistic Regression Analysis
T2DM with or without NAFLD was defined as a dependent variable, whereas age; sex; duration of diabetes; BMI; SBP; diastolic blood pressure; and AST, ALT, ALP, GGT, TG, TC, HDL-C, LDL-C, SUA, HbAlc, FPG, 2hPG, FINS, HOMA-IR, SCr, BUN, UACR, and eGFR levels were considered as the independent variables. The univariate logistic regression analysis showed that NAFLD was positively correlated with SBP and UACR, SCr, AST, ALT, ALP, GGT, TG, TC, SUA, HbAlc, FPG, and HOMA-IR levels (all p<0.05), and negatively correlated with eGFR level, age, duration of diabetes, and HDL-C level (both p<0.05; Table 2).
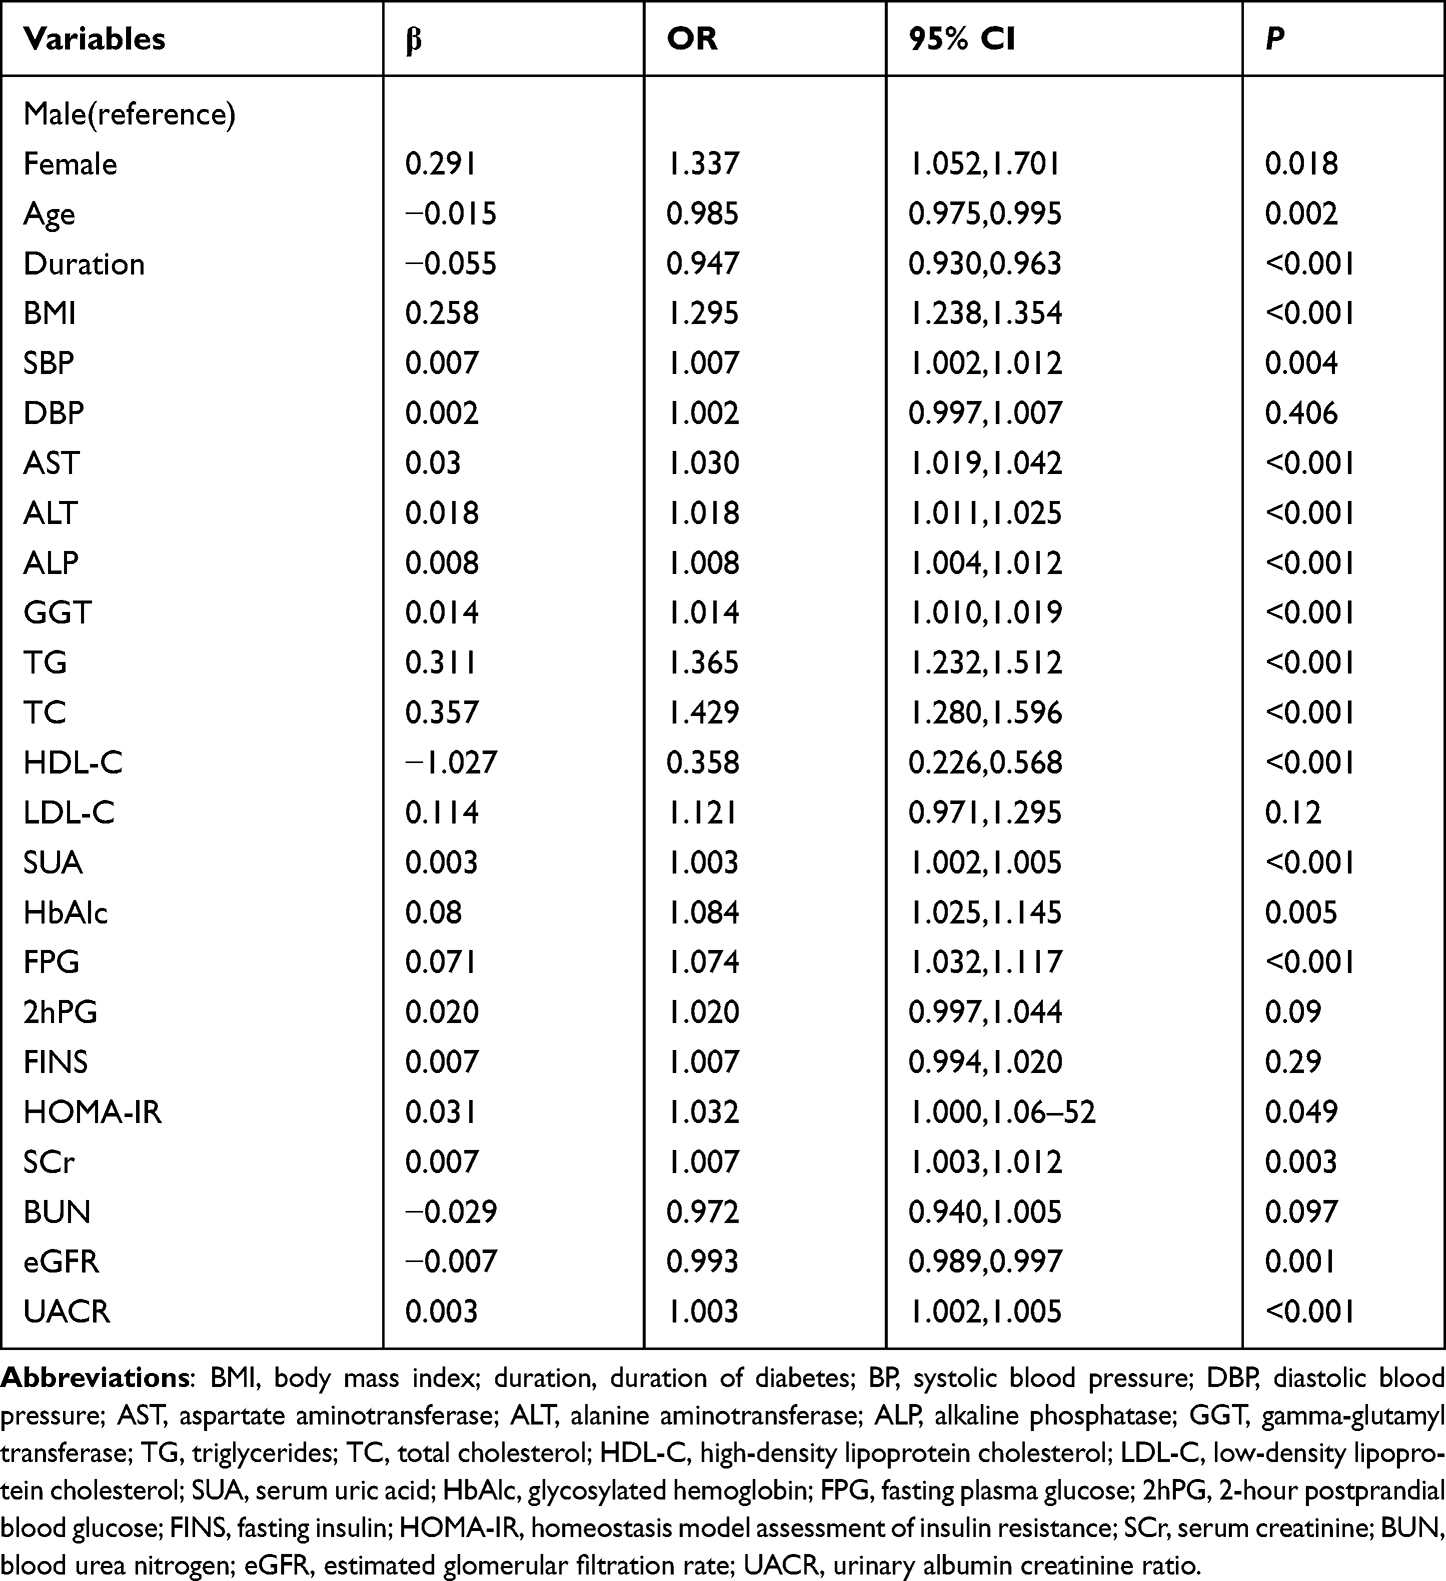 |
Table 2 Correlation Between NAFLD and CKD in T2DM Patients by Univariate Logistic Regression Analysis |
Risk Analysis of NAFLD in the Different UACR Level Groups Using Stratified Logistic Regression Analysis
T2DM with or without NAFLD was considered a dependent variable, and the U1, U2, and U3 groups defined as the independent variables. With the U1 group as the reference group, the risk of NAFLD in the different UACR level groups was analyzed using stratified logistic regression analysis.
In model 1, the risk of NAFLD in the U3 group (odds ratio [OR]=3.032, 95% confidence interval [CI] (1.817, 5.058), p<0.001) was higher than that in U2 group (OR = 1.473, 95% CI [1.127, 1.926], p=0.005). In model 2, after adjusting for sex; age; duration of diabetes; BMI; SBP; and AST, ALT, ALP, GGT, TG, TC, and HDL-C levels, the risk of NAFLD in the U3 group (OR=3.601, 95% CI (1.966, 6.596), p<0.001) was still more than twice than that in the U2 group (OR=1.762, 95% CI [1.279, 2.428], p= 0.001). In model 3, after further adjusting for SUA, HbAlc, FPG, HOMA-IR SCr, BUN, and eGFR levels based on the model 2, the risk of NAFLD in the U3 group (OR=2.342, 95% CI [1.203, 4.559], p=0.012) was still higher than that in the U2 group (OR=1.660, 95% CI [1.193, 2.310], p=0.003; Table 3).
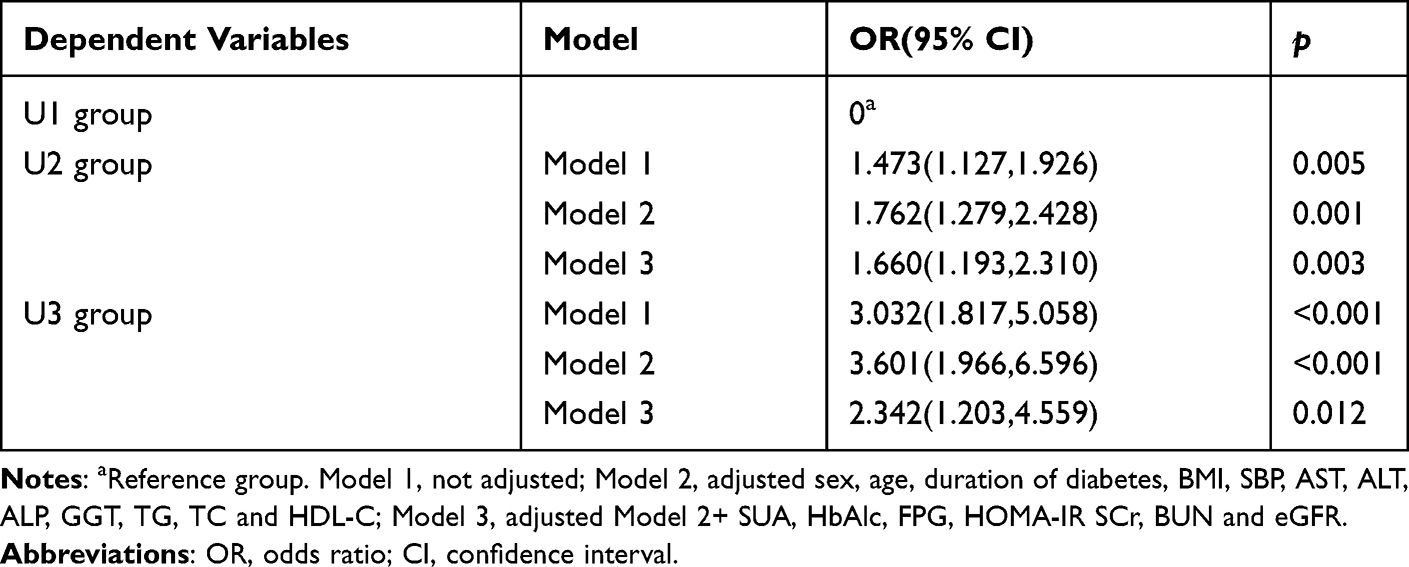 |
Table 3 Risk Analysis of NAFLD in the Different UACR Levels by Stratified Logistic Regression Analysis |
Discussion
In this study, patients with T2DM and the prevalence of NAFLD in the CKD group was higher than that in the non-CKD group, the SCr and UACR levels in the NAFLD group were higher than those in the non-NAFLD group, while eGFR level in the NAFLD group was lower than that in the non-NAFLD group. In addition, the increase in UACR levels was closely related to the prevalence and risk of NAFLD.
This study had some limitations. First, our research was a cross-sectional study, limiting our ability to assess and conclude a causal relationship between the variables studied. Nevertheless, it is noteworthy that there is a correlation between NAFLD and CKD. Second, the gold standard for NAFLD is puncture biopsy; however, in this study, the diagnosis of NAFLD was based on ultrasound. Thus, the severity could not be graded to further explore the relationship between the severity of NAFLD and CKD.
Similar to our results, Lee3 and Targher et al22 reported that CKD in patients with T2DM was positively correlated with the presence of NAFLD. However, NAFLD was also reported to be closely related to microalbuminuria in newly diagnosed and early patients with diabetes.23 A large meta-analysis showed that the prevalence and incidence of CKD increased by approximately two times in the NAFLD population compared with the non-NAFLD population. Furthermore, the prevalence and incidence of CKD were higher in the patients with non-alcoholic steatohepatitis than in those with NAFLD.24
Several scholars believe that there is a two-way relationship between NAFLD and CKD. CKD increases the risk and progression of NAFLD.20 Another study reported that the severity of the fibrosis associated with NAFLD also increases the risk of CKD incidence and progression,25 this may be related to the severity of the fibrosis associated with NAFLD was based on non-invasive testing methods in the study. However, it was recently observed using liver biopsy that steatohepatitis represents the sole feature of liver damage in T2DM.26 Therefore, the difference between NAFLD and NASH in patients with T2DM may need to be confirmed by more relevant studies. Moreover, the specific mechanism underlying this relationship remains unclear, although it may be due to the common pathogenesis of NAFLD and CKD, such as IR, dyslipidemia, obesity, inflammation, cellular oxidative stress, impaired regulation of the renin-angiotensin system (RAS), and changes in the intestinal flora.
IR is considered a major factor in the induction of NAFLD and CKD. An important etiology of NAFLD in the human liver is the two-way induction of IR and NAFLD.27,28 In human kidneys, IR can directly lead to the production and circulation of advanced glycation end products, activation of the sympathetic nervous system, and changes in hemodynamics and hormone levels.29
It is believed that IR and NAFLD promote each other. IR is closely related to the liver and peripheral IR. NAFLD acts on cells in the peripheral adipose and muscle tissues, directly weakening insulin’s ability to inhibit adipose tissue degradation and enhancing the body’s degradation of adipose tissue. Under normal circumstances, insulin promotes fat synthesis in the liver. In theory, IR leads to a decrease in synthetic fat in the liver, but this is not the case. Therefore, most scholars believe that there is selectivity in the liver IR as it only affects liver glucose metabolism. Meanwhile, it does not affect lipid metabolism in the liver and increases or, at least, maintains fat synthesis, called “liver selective IR.” This weakens the ability of the liver to inhibit very-low-density lipoprotein, leading to an increase in blood lipids.30–32 In turn, NAFLD overproduces glucose and very-low-density lipoprotein and promotes the secretion of a variety of inflammatory factors, liver cytokines, and insulin, resulting in persistently high insulin levels, systemic IR, impairment of the islet β-cell function, and gradual depletion of the islet β-cell reserve.28,30–32
Dyslipidemia is an important risk factor for NAFLD as it is further aggravated by the latter. In a diabetes intervention and complication cohort epidemiological analysis, the reduced risk of moderate-level proteinuria progressing to severe-level proteinuria or end-stage renal disease was closely associated with low levels of low-density lipoprotein cholesterol and TG.33 Patients with NAFLD usually have complications of IR and hyperinsulinemia, which can affect lipid metabolism. Dyslipidemia and ectopic accumulation of lipids in the kidney lead to lipotoxicity, which promotes podocyte injury, renal tubular injury, mesangial hyperplasia, endothelial activation, and formation of macrophage-derived foam cells.29
Obesity is also closely related to NAFLD and CKD, with BMI being positively correlated with the occurrence of kidney disease.27,34 Obesity may lead to both NAFLD and CKD. Although in some cases, the association between NAFLD and CKD may result from obesity, and the correlation between NAFLD and CKD in T2DM could have an important clinical impact, some studies showed that both conditions correlate with high cardiovascular risk.35–37 Further studies that clarify the possible additive role on the cardiovascular risk of the coexistence of the two conditions are needed.
Oxidative stress is another important factor that promotes NAFLD and CKD.19 Oxidative stress and a decrease in inflammation may have protective effects against NAFLD and CKD.27
Some scholars believe that RAS plays a key role in the pathogenesis of NAFLD and CKD.29,31,38 In the liver, angiotensin-converting enzymes promote IR, new adipogenesis, and production of pro-inflammatory cytokines such as IL-6 and tumor growth factor-β, which trigger fiber formation and promote histological changes in non-alcoholic steatohepatitis.39 In the kidney, the activation of RAS plays a key role in the accumulation of ectopic lipids, which leads to glomerulosclerosis, oxidative stress, and inflammation through the vasoconstriction of the glomerular efferent arterioles.39 The role of the RAS system in the liver and kidney makes it a main inhibitory target for reducing NAFLD fibrosis and CKD.39,40
Conclusion
The risk of NAFLD in patients with T2DM is closely related to CKD.
Abbreviations
T2DM, type 2 diabetes mellitus; NAFLD, non-alcoholic fatty liver disease; CKD, chronic kidney disease; BMI, body mass index; HP, hypertension; SBP, systolic blood pressure; DBP, diastolic blood pressure; AST, aspartate aminotransferase; ALT, alanine aminotransferase; ALP, alkaline phosphatase; GGT, gamma-glutamyl transferase; TG, triglycerides; TC, total cholesterol; HDL-C, high-density lipoprotein cholesterol; LDL-C, low-density lipoprotein cholesterol; SUA, serum uric acid; HbAlc, glycosylated hemoglobin; FPG, fasting plasma glucose; 2hPG, 2-hour postprandial blood glucose; FINS, fasting insulin; HOMA-IR, homeostasis model assessment of insulin resistance; SCr, serum creatinine; BUN, blood urea nitrogen; eGFR, estimated glomerular filtration rate; UACR, urinary albumin creatinine ratio.
Data Sharing Statement
The data of this study is not publicly available due to data protection by the First Hospital of Lanzhou University. However, these are available from the corresponding author on reasonable request.
Ethics Approval
All procedures performed in studies involving human participants were in accordance with the institutional ethical standards, and with the 1964 Helsinki declaration and its later amendments or comparable ethical standards, the approval number is LDYYLL2021-337.
Consent for Publication
All authors support the submission to this journal.
Author Contributions
All authors made a significant contribution to the work reported, whether that is in the conception, study design, execution, acquisition of data, analysis and interpretation, or in all these areas; took part in drafting, revising or critically reviewing the article; gave final approval of the version to be published; have agreed on the journal to which the article has been submitted; and agree to be accountable for all aspects of the work.
Funding
This study was funded by the National Natural Science Foundation of China (No. 81960155) and Health industry scientific research project of Gansu Province (No. GSWSKY-2019-07).
Disclosure
The authors declare that they have no conflicts of interest for this work.
References
1. Guo L. Prevalence of diabetes and coping strategies. Chin J Clin Healthcare. 2020;23(4):433–436.
2. Zheng Y, Ley SH, Hu FB. Global aetiology and epidemiology of type 2 diabetes mellitus and its complications. Nat Rev Endocrinol. 2018;14(2):88–98. doi:10.1038/nrendo.2017.151
3. Lee YJ, Wang CP, Hung WC, et al. Common and unique factors and the bidirectional relationship between chronic kidney disease and nonalcoholic fatty liver in type 2 diabetes patients. Diabetes Metab Syndr Obes. 2020;13:1203–1214. doi:10.2147/DMSO.S237700
4. Tong L, Adler SG. Diabetic kidney disease. Clin J Am Soc Nephrol. 2018;13(2):335–338. doi:10.2215/CJN.04650417
5. Litwak L, Goh SY, Hussein Z, et al. Prevalence of diabetes complications in people with type 2 diabetes mellitus and its association with baseline characteristics in the multinational A1chieve study. Diabetol Metab Syndr. 2013;5(1):57. doi:10.1186/1758-5996-5-57
6. de Boer IH, Rue TC, Hall YN, et al. Temporal trends in the prevalence of diabetic kidney disease in the United States. JAMA. 2011;305(24):2532–2539. doi:10.1001/jama.2011.861
7. Hu Y, Shi R, Mo R, et al. Nomogram for the prediction of diabetic nephropathy risk among patients with type 2 diabetes mellitus based on a questionnaire and biochemical indicators: a retrospective study. Aging. 2020;12(11):10317–10336. doi:10.18632/aging.103259
8. Targher G, Chonchol M, Bertolini L, et al. Increased risk of CKD among type 2 diabetics with nonalcoholic fatty liver disease. J Am Soc Nephrol. 2008;19(8):1564–1570. doi:10.1681/ASN.2007101155
9. Li Y, Zhu S, Li B, et al. Association between non-alcoholic fatty liver disease and chronic kidney disease in population with prediabetes or diabetes. Int Urol Nephrol. 2014;46(9):1785–1791. doi:10.1007/s11255-014-0796-9
10. Jang HR, Kang D, Sinn DH, et al. Nonalcoholic fatty liver disease accelerates kidney function decline in patients with chronic kidney disease: a cohort study. Sci Rep. 2018;8(1):4718. doi:10.1038/s41598-018-23014-0
11. Loomba R, Sanyal AJ. The global NAFLD epidemic. Nat Rev Gastroenterol Hepatol. 2013;10(11):686–690. doi:10.1038/nrgastro.2013.171
12. Anstee QM, Targher G, Day CP. Progression of NAFLD to diabetes mellitus, cardiovascular disease or cirrhosis. Nat Rev Gastroenterol Hepatol. 2013;10(6):330–344. doi:10.1038/nrgastro.2013.41
13. Targher G, Chonchol M, Zoppini G, et al. Risk of chronic kidney disease in patients with non-alcoholic fatty liver disease: is there a link? J Hepatol. 2011;54(5):1020–1029. doi:10.1016/j.jhep.2010.11.007
14. Armstrong MJ, Adams LA, Canbay A, et al. Extrahepatic complications of nonalcoholic fatty liver disease. Hepatology. 2014;59(3):1174–1197. doi:10.1002/hep.26717
15. Sinn DH, Kang D, Jang HR, et al. Development of chronic kidney disease in patients with non-alcoholic fatty liver disease: a cohort study. J Hepatol. 2017;67(6):1274–1280. doi:10.1016/j.jhep.2017.08.024
16. Afarideh M, Aryan Z, Ghajar A, et al. Association of non-alcoholic fatty liver disease with microvascular complications of type 2 diabetes. Prim Care Diabetes. 2019;13(6):505–514. doi:10.1016/j.pcd.2019.03.009
17. Kim BY, Jung CH, Mok JO, et al. Prevalences of diabetic retinopathy and nephropathy are lower in Korean type 2 diabetic patients with non-alcoholic fatty liver disease. J Diabetes Investig. 2014;5(2):170–175. doi:10.1111/jdi.12139
18. Zhan YT, Zhang C, Li L, et al. Non-alcoholic fatty liver disease is not related to the incidence of diabetic nephropathy in type 2 diabetes. Int J Mol Sci. 2012;13(11):14698–14706. doi:10.3390/ijms131114698
19. Jha JC, Banal C, Chow BS, et al. Diabetes and kidney disease: role of oxidative stress. Antioxid Redox Signal. 2016;25(12):657–684. doi:10.1089/ars.2016.6664
20. Cojocariu C, Singeap AM, Girleanu I, et al. Non-alcoholic fatty liver disease-related chronic kidney disease. Can J Gastroenterol Hepatol. 2020;4:20206630296.
21. Levey AS, Coresh J, Greene T, et al. Using standardized serum creatinine values in the modification of diet in renal disease study equation for estimating glomerular filtration rate. Ann Intern Med. 2006;145(4):247–254. doi:10.7326/0003-4819-145-4-200608150-00004
22. Targher G, Bertolini L, Rodella S, et al. Non-alcoholic fatty liver disease is independently associated with an increased prevalence of chronic kidney disease and proliferative/laser-treated retinopathy in type 2 diabetic patients. Diabetologia. 2008;51(3):444–450. doi:10.1007/s00125-007-0897-4
23. Hwang ST, Cho YK, Yun JW, et al. Impact of non-alcoholic fatty liver disease on microalbuminuria in patients with prediabetes and diabetes. Intern Med J. 2010;40(6):437–442. doi:10.1111/j.1445-5994.2009.01979.x
24. Yang L, Chu TK, Lian J, et al. Risk factors of chronic kidney diseases in Chinese adults with type 2 diabetes. Sci Rep. 2018;8(1):14686. doi:10.1038/s41598-018-32983-1
25. Bril F, Cusi K. Nonalcoholic fatty liver disease: the new complication of type 2 diabetes mellitus. Endocrinol Metab Clin North Am. 2016;45(4):765–781. doi:10.1016/j.ecl.2016.06.005
26. Masarone M, Rosato V, Aglitti A, et al. Liver biopsy in type 2 diabetes mellitus: steatohepatitis represents the sole feature of liver damage. PLoS One. 2017;12(6):e0178473. doi:10.1371/journal.pone.0178473
27. Kanbay M, Bulbul MC, Copur S, et al. Therapeutic implications of shared mechanisms in non-alcoholic fatty liver disease and chronic kidney disease. J Nephrol. 2021;34(3):649–659. doi:10.1007/s40620-020-00751-y
28. Rinaldi L, Pafundi PC, Galiero R, et al. Mechanisms of non-alcoholic fatty liver disease in the metabolic syndrome. A Narrative Review Antioxidants. 2021;10(2):270.
29. Marcuccilli M, Chonchol M. NAFLD and chronic kidney disease. Int J Mol Sci. 2016;17(4):562. doi:10.3390/ijms17040562
30. Maliakkal BJ. Pathogenesis of non-alcoholic fatty liver disease and implications on cardiovascular outcomes in liver transplantation. Transl Gastroenterol Hepatol. 2020;5:36. doi:10.21037/tgh.2019.12.02
31. Tilg H, Moschen AR, Roden M. NAFLD and diabetes mellitus. Nat Rev Gastroenterol Hepatol. 2017;14(1):32–42. doi:10.1038/nrgastro.2016.147
32. Valenti L, Bugianesi E, Pajvani U, et al. Nonalcoholic fatty liver disease: cause or consequence of type 2 diabetes? Liver Int. 2016;36(11):1563–1579. doi:10.1111/liv.13185
33. de Boer IH, Rue TC, Cleary PA, et al. Long-term renal outcomes of patients with type 1 diabetes mellitus and microalbuminuria: an analysis of the diabetes control and complications trial/epidemiology of diabetes interventions and complications cohort. Arch Intern Med. 2011;171(5):412–420. doi:10.1001/archinternmed.2011.16
34. Tziomalos K, Athyros VG. Diabetic nephropathy: new risk factors and improvements in diagnosis. Rev Diabetic Stud. 2015;12(1–2):110–118. doi:10.1900/RDS.2015.12.110
35. Galiero R, Caturano A, Vetrano E, et al. Pathophysiological mechanisms and clinical evidence of relationship between nonalcoholic fatty liver disease (NAFLD) and cardiovascular disease. Rev Cardiovasc Med. 2021;22(3):755–768. doi:10.31083/j.rcm2203082
36. Minutolo R, Sasso FC, Chiodini P, et al. Management of cardiovascular risk factors in advanced type 2 diabetic nephropathy: a comparative analysis in nephrology, diabetology and primary care settings. J Hypertens. 2006;24(8):1655–1661. doi:10.1097/01.hjh.0000239303.93872.31
37. Sasso FC, Pafundi PC, Simeon V, et al. Efficacy and durability of multifactorial intervention on mortality and MACEs: a randomized clinical trial in type-2 diabetic kidney disease. Cardiovasc Diabetol. 2021;20(1):145. doi:10.1186/s12933-021-01343-1
38. Musso G, Cassader M, Cohney S, et al. Emerging liver-kidney interactions in nonalcoholic fatty liver disease. Trends Mol Med. 2015;21(10):645–662. doi:10.1016/j.molmed.2015.08.005
39. Sanchez-Niño MD, Bozic M, Córdoba-Lanús E, et al. Beyond proteinuria: VDR activation reduces renal inflammation in experimental diabetic nephropathy. Am J Physiol Renal Physiol. 2012;302(6):F647–657. doi:10.1152/ajprenal.00090.2011
40. Umanath K, Lewis JB. Update on diabetic nephropathy: core curriculum 2018. Am J Kidney Dis. 2018;71(6):884–895. doi:10.1053/j.ajkd.2017.10.026
 © 2022 The Author(s). This work is published and licensed by Dove Medical Press Limited. The full terms of this license are available at https://www.dovepress.com/terms.php and incorporate the Creative Commons Attribution - Non Commercial (unported, v3.0) License.
By accessing the work you hereby accept the Terms. Non-commercial uses of the work are permitted without any further permission from Dove Medical Press Limited, provided the work is properly attributed. For permission for commercial use of this work, please see paragraphs 4.2 and 5 of our Terms.
© 2022 The Author(s). This work is published and licensed by Dove Medical Press Limited. The full terms of this license are available at https://www.dovepress.com/terms.php and incorporate the Creative Commons Attribution - Non Commercial (unported, v3.0) License.
By accessing the work you hereby accept the Terms. Non-commercial uses of the work are permitted without any further permission from Dove Medical Press Limited, provided the work is properly attributed. For permission for commercial use of this work, please see paragraphs 4.2 and 5 of our Terms.