")
Back to Journals » Diabetes, Metabolic Syndrome and Obesity » Volume 15
Association Between Some Different Obesity Anthropometric Indices and Type 2 Diabetes Mellitus in Middle-Aged and Elderly Chinese Men and Women in Beijing, China: A Cross-Sectional Study
Authors Zhang X, Yan W, Wang B, Wang L, Mu Y , Wang S
Received 23 January 2022
Accepted for publication 10 May 2022
Published 11 June 2022 Volume 2022:15 Pages 1799—1807
DOI https://doi.org/10.2147/DMSO.S359657
Checked for plagiarism Yes
Review by Single anonymous peer review
Peer reviewer comments 3
Editor who approved publication: Professor Ming-Hui Zou
Xuebing Zhang,1,* Wenhua Yan,2,* Bing Wang,3 Lianjie Wang,1 Yiming Mu,2 Shidong Wang1
1Department of Endocrinology, Dongzhimen Hospital Beijing University of Chinese Medicine, Beijing, 100700, People’s Republic of China; 2Department of Endocrinology, First Medical Centre of Chinese PLA General Hospital, Beijing, 100853, People’s Republic of China; 3Department of Endocrinology, Emergency General Hospital, Beijing, 100028, People’s Republic of China
*These authors contributed equally to this work
Correspondence: Shidong Wang, Tel +86 13910965659, Email [email protected]
Background: Obesity can lead to the development of type 2 diabetes mellitus (T2DM). However, the predictive power of different obesity anthropometric indices (ObAIs) for T2DM varies with race and geographical area. Therefore, the study aimed to investigate the association between different ObAIs and T2DM and determine the best index for screening T2DM in middle-aged and elderly men and women in Beijing, China.
Methods: A cross-sectional study was conducted in Shijingshan district (Beijing, China) from November 2011 to August 2012, involving a total of 14,558 subjects aged ≥ 40 years. Data on demographic information, lifestyle, history of T2DM, hypertension and dyslipidemia were collected. Body height, body weight, waist circumference (WC), hip circumference, and blood pressure were recorded. The oral glucose tolerance test or a standard meal test and blood lipid test were performed. The relationship between different ObAIs and T2DM was analyzed using multiple logistic regression.
Results: After adjustment for age, smoking status, alcohol intake, occupation and education degree, diabetes family history, hypertension and dyslipidemia, body mass index (BMI), WC, waist-to-hip ratio (WHR), and waist-to-height ratio (WHtR) were positively associated with T2DM in both men and women. Compared with the lowest BMI, WC, WHR, and WHtR quartiles, ORs of the highest quartiles were 2.131 (95% CI: 1.465– 3.099), 1.752 (95% CI: 1.270– 2.417), 1.342 (95% CI: 1.072– 1.678), 2.739 (95% CI: 2.293– 3.271) in men and 1.837 (95% CI: 1.584– 2.130), 3.122 (95% CI: 1.980– 4.924), 3.781 (95% CI: 2.855– 5.007), 2.379 (85% CI: 2.040– 2.775), respectively, in women. The areas under ROC curve of BMI, WC, WHR, and WHtR for men were 0.584 (95% CI: 0.568– 0.600), 0.509 (95% CI: 0.492– 0.525), 0.501 (95% CI: 0.485– 0.518), and 0.642 (95% CI: 0.627– 0.658) and 0.619 (95% CI: 0.607– 0.632), 0.709 (95% CI: 0.697– 0.720), 0.741 (95% CI: 0.730– 0.752), and 0.654 (95% CI: 0.642– 0.666), respectively, for women.
Conclusion: WHtR and WHR have been found to perform better as predictors of T2DM in middle-aged and elderly Chinese men and women, respectively.
Keywords: obesity, anthropometric indices, type 2 diabetes mellitus, middle-aged and elderly, Chinese
Introduction
Due to changes in lifestyle habits, T2DM prevalence has rapidly increased in many countries, especially in a quickly changing developing country such as China. The global diabetes prevalence in 2019 is estimated to be 9.3%, affecting 463 million people and among them, more than 90% have type 2 diabetes mellitus (T2DM).1 In China, prevalence of T2DM has more rapidly increased from less than 1% in 19802 to 11.2% in 2017.3. Meanwhile, the worldwide prevalence of overweight and obesity has also dramatically increased, affecting a third of the world’s population over the same time period.4 This condition is particularly alarming in Asia.5 Up to 2020, more than half of adults are involved in overweight or obesity in China. A prospective cohort study has proven that the T2DM prevalence has grown in Chinese population as a consequence of an overweight and obesity pandemic, the so-called diabesity.6 Therefore, early detection of obesity can help in screening T2DM and identifying high-risk individuals.
It is well known that obesity is a major independent and modifiable risk factor for the risk of future T2DM and many epidemiological studies have demonstrated that overweight/obesity was positively associated with an increased T2DM risk.7,8 Obesity anthropometric indices (ObAIs) are predictors of developing T2DM, including body mass index (BMI), waist circumference (WC), waist-to-hip ratio (WHR) and waist-to-height ratio (WHtR). BMI is one of the most commonly used ObAIs representing overall obesity to identify the risk of future T2DM. However, it cannot distinguish between fat mass and fat-free mass. Compared with BMI, WC, WHtR, and WHR are commonly used to define the central obesity. Many previous studies have explored the relationship between different ObAIs and T2DM. A Japanese study showed that BMI could similarly predict the presence of T2DM just as the WC in middle-aged subjects.9 Another study indicated that BMI was a better predictor of diabetes than WC in young and middle-aged Chinese women.10 In contrast, a meta-analyses demonstrated that WHtR had significantly greater discriminatory power compared with BMI for T2DM.11 A rural Bangladeshi population study reported that WHR was more closely associated with T2DM than WC and BMI.12 The conclusions are uniform due to different enrolled populations. Research studies have shown that predicting power of different ObAIs for T2DM varies with age, sex, region and ethnicity.13,14 At present, few studies have explored the association between different ObAIs and T2DM in middle-aged and elderly Chinese population in Northern China. Therefore, we conducted this survey in order to investigate the association between different ObAIs and T2DM and determine the best index for screening T2DM in adults aged 40 and older in northern China.
Methods
Study Population
This study was an urban-community-population-based cross-sectional survey, which used cluster sampling method. We conducted this survey in Shijingshan district with estimated 616,000 permanent inhabitants (Beijing, China) from November 2011 to August 2012. We randomly selected three communities with a total of 21,428 permanent inhabitants aged 40 years and older in the district. Each household in the three communities was notified by telephone or door-to-door visit by full-time community staff in order for everyone to be contacted. The subjects which refused to participate in this survey, had poor health, had type 1 diabetes mellitus and were difficult to communicate with were excluded (n = 2154). Among them, 19,274 residents (men 6784; women 12,490) signed the informed consent before the investigation. The response rate was 89.9%. The subjects who had incomplete demographic information, no availability of fasting blood glucose or 2-hour blood glucose (n = 129) were excluded, as were those with impaired glucose tolerance (IGT, n=4587). Finally, 14,558 individuals with T2DM or NGT were included in our study. The enrolled subjects were in the age range 40–93 years and in the BMI range 15.4–53.7kg/m2. A total of 4629 type 2 diabetic subjects were in the study, including 2524 diagnosed and 2105 undiagnosed diabetes. Our study was approved by the Chinese PLA General Hospital Ethics Committee (NO.EC2012-046).
Sample Size Evaluation
In the study, we calculate the minimum sample size by using the formula n=tα2pq/d2 (where t=1.96, α=95% for both sides; q=1 − p),15 p, which is the prevalence of T2DM in Chinese adults over 40 years of age, was 16.8%,16 and d, which is the absolute error or precision, was 10% p in our study. The sample size was 5369 by calculating. The study included 14,558 subjects far exceeding the required sample size.
Clinical Data and Biochemical Indicators
Standard questionnaires, which included demography, lifestyle, history of diabetes, stroke, coronary heart disease (CHD), hypertension and dyslipidemia, were completed by trained physicians. All subjects were checked by trained physicians according to established standard methods. Physical examination items included body height, body weight, waist circumference, hip circumference, blood pressure, and heart rate. Body height was measured at bare feet accurate to 0.1 cm. Body weight was measured in light clothes accurate to 0.1 kg. The waist circumference was measured at the midpoint between the rib cage and iliac crests, while participants were fasting and gently exhaled, and the hip circumference was measured at the level of the greater femoral trochanter. Waist circumference and hip circumference were measured to an accuracy of 0.1 cm. Waist circumference/hip circumference (WHR) and waist circumference/height (WHtR) were accurate to 0.01. BMI was calculated as weight (kg) divided by height squared (m2). Blood pressure was measured in a sitting position for three times after 5-minute rest with an interval of 1 minute, using OMRON electronic BP monitor. The average blood pressure was used for analysis. Triglyceride (TG), total cholesterol (TC), high-density lipoprotein cholesterol (HDL-C), and low-density lipoprotein cholesterol (LDL-C) were measured by chemiluminescent on auto-analyzer. Glycosylated hemoglobin (HbA1c) was measured by high pressure liquid chromatography.
75g Oral Glucose Tolerance Test or Standard Meal Test
After at least 10 hours of overnight fasting, a venous specimen was collected for the measurement of plasma glucose. Subjects without a history of diabetes were given a standard 75 g glucose solution, whereas subjects with a previous history of diabetes were given a standard meal containing 80 g carbohydrates. Blood specimens for glucose measurement were collected 2 hours after either the oral glucose tolerance test or the standard meal test. Blood glucose was measured using the Hexokinase method on an auto-analyzer.
Definition
The diagnosis of diabetes mellitus was based on the 1999 World Health Organization standards, ie fasting blood glucose ≥7.0 mmol/L, or 2-hour blood glucose ≥11.1 mmol/L, or already using insulin and/or oral antidiabetic medicine, or a self-reported history. The determination of hypertension was in accordance with the standards of Chinese Diabetes Society (CDS) metabolic syndrome diagnosis (2020).17 The average blood pressure among the three measurements ≥140/90 mmHg, or taking antihypertensive medicine, was defined as hypertension. Determination of dyslipidemia was in accordance with 2016 Chinese guidelines for the management of dyslipidemia in adults.18 Dyslipidemia was defined as TC level of ≥5.2 mmol/L, or TG level of ≥1.7 mmo1/L, or HDL-C level of <1.0 mmol/L or LDL-C ≥3.4 mmol/L, or taking lipid-regulating medicine. Smoking was defined as smoking one or more cigarettes daily for at least half a year. Regular drinking was defined as at least once a week for half a year.
Statistical Analysis
Statistical analysis was performed on SPSS software version 16.0 (SPSS Inc., USA). Normally distributed continuous variables were presented as means ± standard deviation (SD) as tested using t test. Non-normally distributed continuous variables were presented as median (interquartile ranges) as tested using Wilcoxon rank sum test. Categorical variables were presented as n (%). The percentage difference between groups was compared using χ2 test. Multiple logistic regression was used to evaluate the association between different ObAIs and T2DM in three models with adjustment for different confounders. In model 1, no confounders were adjusted. In model 2, some confounders were adjusted including age, smoking status, alcohol intake, occupation and education degree, diabetes family history. In model 3, the analysis was conducted after adjustment for age, smoking status, alcohol intake, occupation and education degree, diabetes family history, hypertension and dyslipidemia. As a result of too many questions related to diet and physical exercise, which could reduce the response rate of subjects, and therefore, we did not consider the diet and physical exercise factors in the study. The optimal cut-off value was determined when the sum of sensitivity and specificity was maximal. The 2-tailed test was used, and P < 0.05 was regarded as statistically significant.
Results
Baseline Characteristics of Subjects with T2DM or Normal Glucose Tolerance (NGT)
A total of 5144 men (T2DM 1917; NGT 3227) and 9414 women (T2DM 2712; NGT 6702) were included in the study. The percentage of postmenopausal women was 77.4% in the study. Average age, BMI, WC, WHR, WHtR, systolic blood pressure (SBP), diastolic blood pressure (DBP), TG, LDL-C, HbA1c, FPG, and PG2h levels were significantly higher in T2DM subjects than those with NGT. HDL-C level was significantly lower in the subjects with T2DM than in the NGT population. Proportions of diabetes family history, hypertension and dyslipidemia were higher in T2DM group than in NGT group (Table 1).
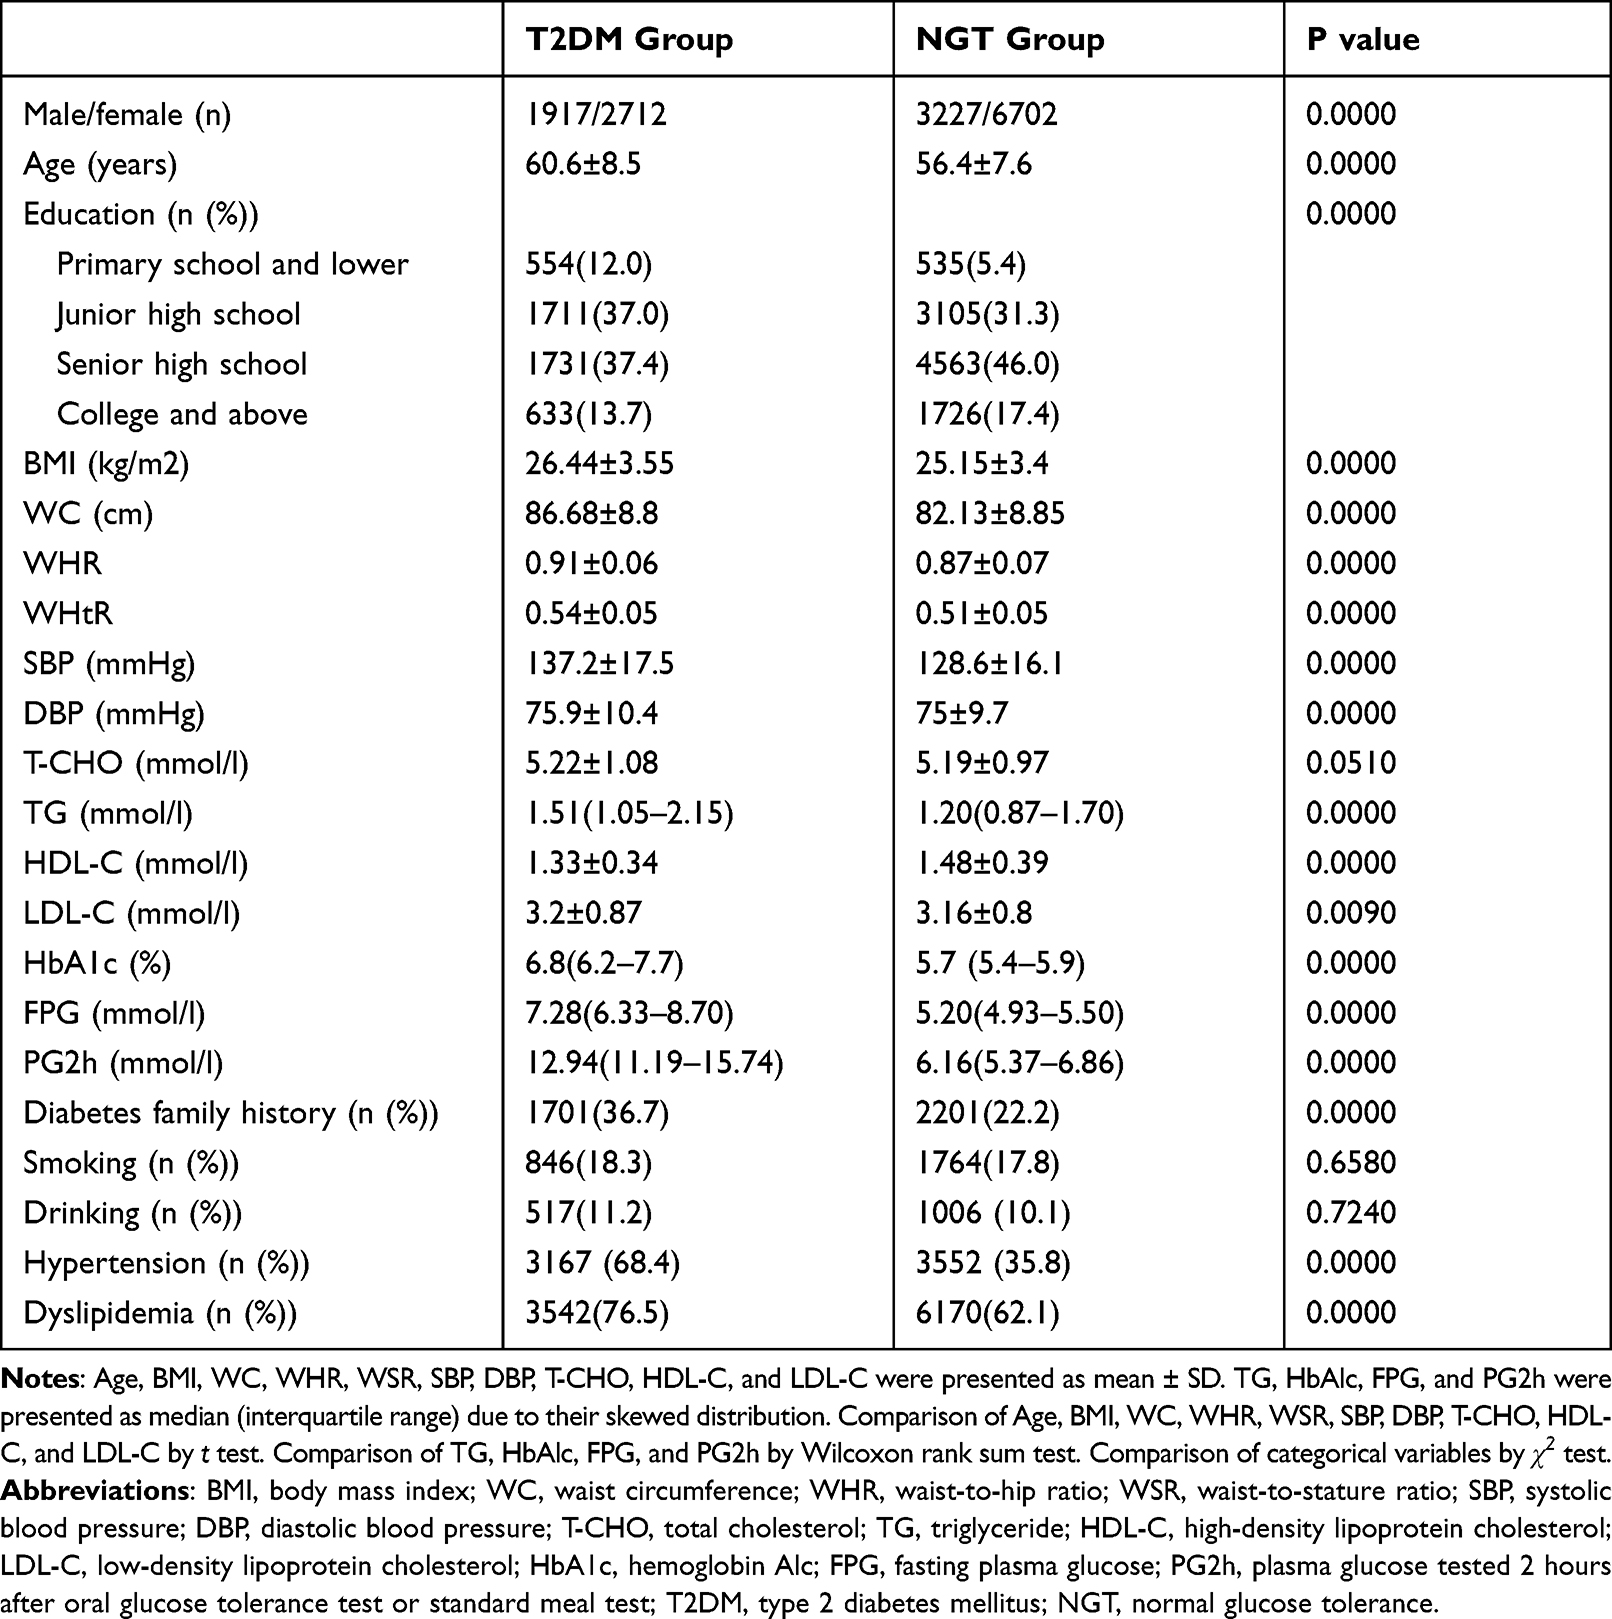 |
Table 1 Baseline Characteristics of Subjects with T2DM and NGT |
Multivariate Logistic Regression Between Different ObAIs and T2DM
We analyzed the association between different ObAIs and T2DM separately in men and in women. BMI quartiles were as follows: <23.7 kg/m2, 23.7–25.5 kg/m2, 25.6–27.6 kg/m2, ≥27.7 kg/m2 in men; <23 kg/m2, 23–25.0 kg/m2, 25.1–27.5 kg/m2, ≥27.6kg/m2 in women. Waist circumference quartiles were as follows: <81 cm, 81–86.4 cm, 86.5–91.9 cm, ≥92 cm in men; <75.6 cm, 75.6–80.9 cm, 81–86.9 cm, ≥87 cm in women. WHR quartiles were as follows: <0.88, 0.88–0.90, 0.91–0.94, ≥0.95 in men; <0.83, 0.83–0.86, 0.87–0.90, ≥0.91 in women. WHtR quartiles were as follows: <0.49, 0.49–0.51, 0.52–0.54, ≥0.55 in men; <0.48, 0.48–0.50, 0.51–0.54, ≥0.55 in women. Tables 2 and 3 show that BMI, WC, WHR, and WHtR were positively associated with T2DM in both men and women. Compared with the lowest BMI, WC, WHR, or WHtR quartiles, ORs of the highest quartiles were 2.131 (95% CI: 1.465–3.099), 1.752 (95% CI: 1.270–2.417), 1.342 (95% CI: 1.072–1.678), 2.739 (95% CI: 2.293–3.271) in men and 1.837 (95% CI: 1.584–2.130), 3.122 (95% CI: 1.980–4.924), 3.781 (95% CI: 2.855–5.007), 2.379 (85% CI: 2.040–2.775), respectively, in women after adjustment for age, smoking status, alcohol intake, occupation and education degree, diabetes family history, hypertension and dyslipidemia (Tables 2 and 3). WHtR was more closely associated with T2DM than WC and WHR in men. However, in women, WHR and WC were the best indices for predicting T2DM compared with BMI and WHtR.
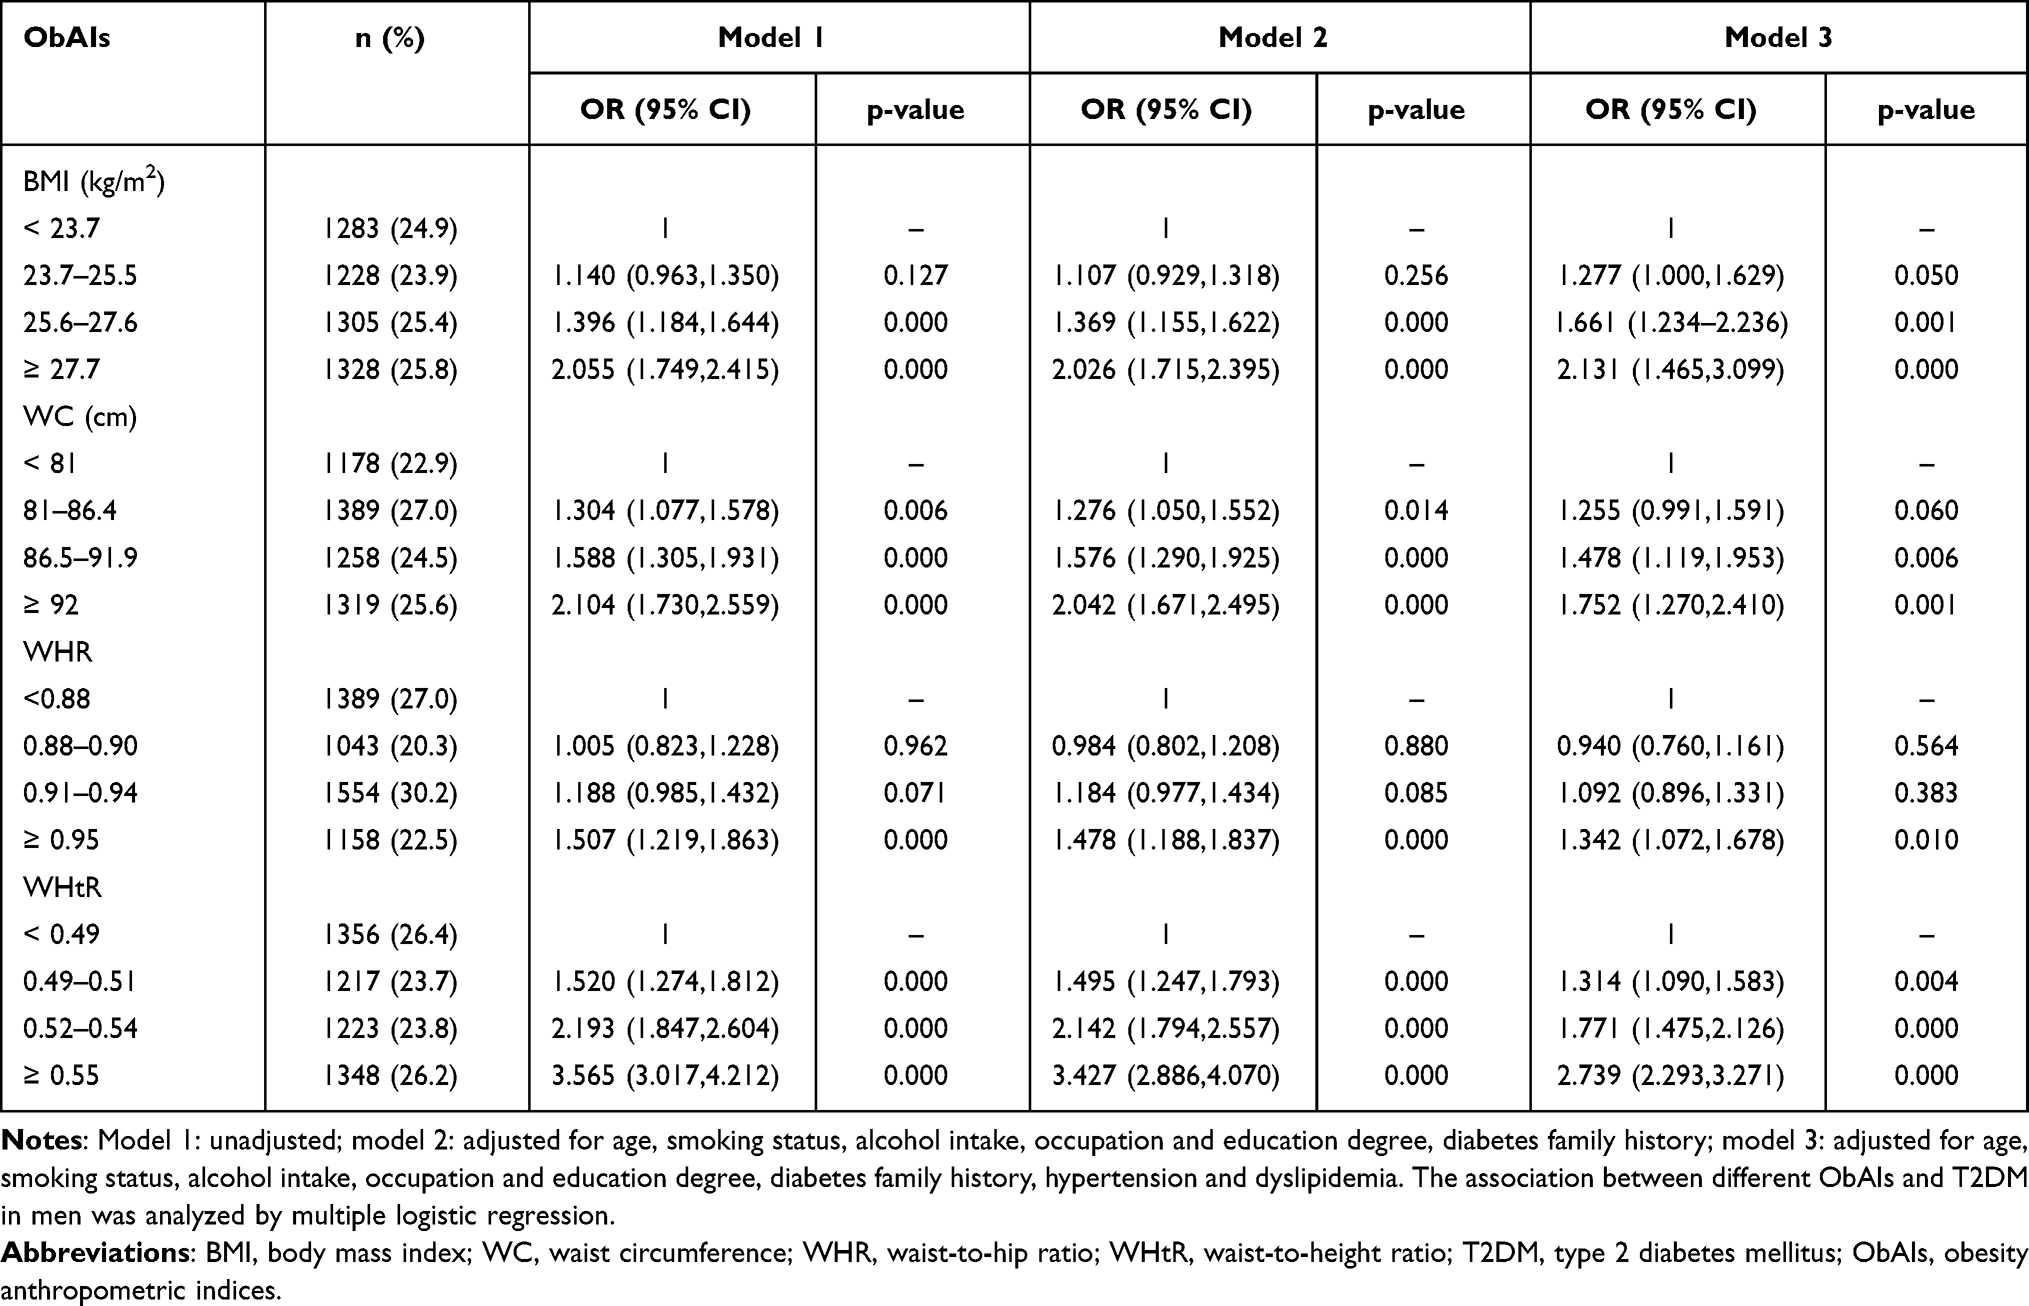 |
Table 2 OR and 95% CI for T2DM According to Quartiles of Different ObAIs in Men |
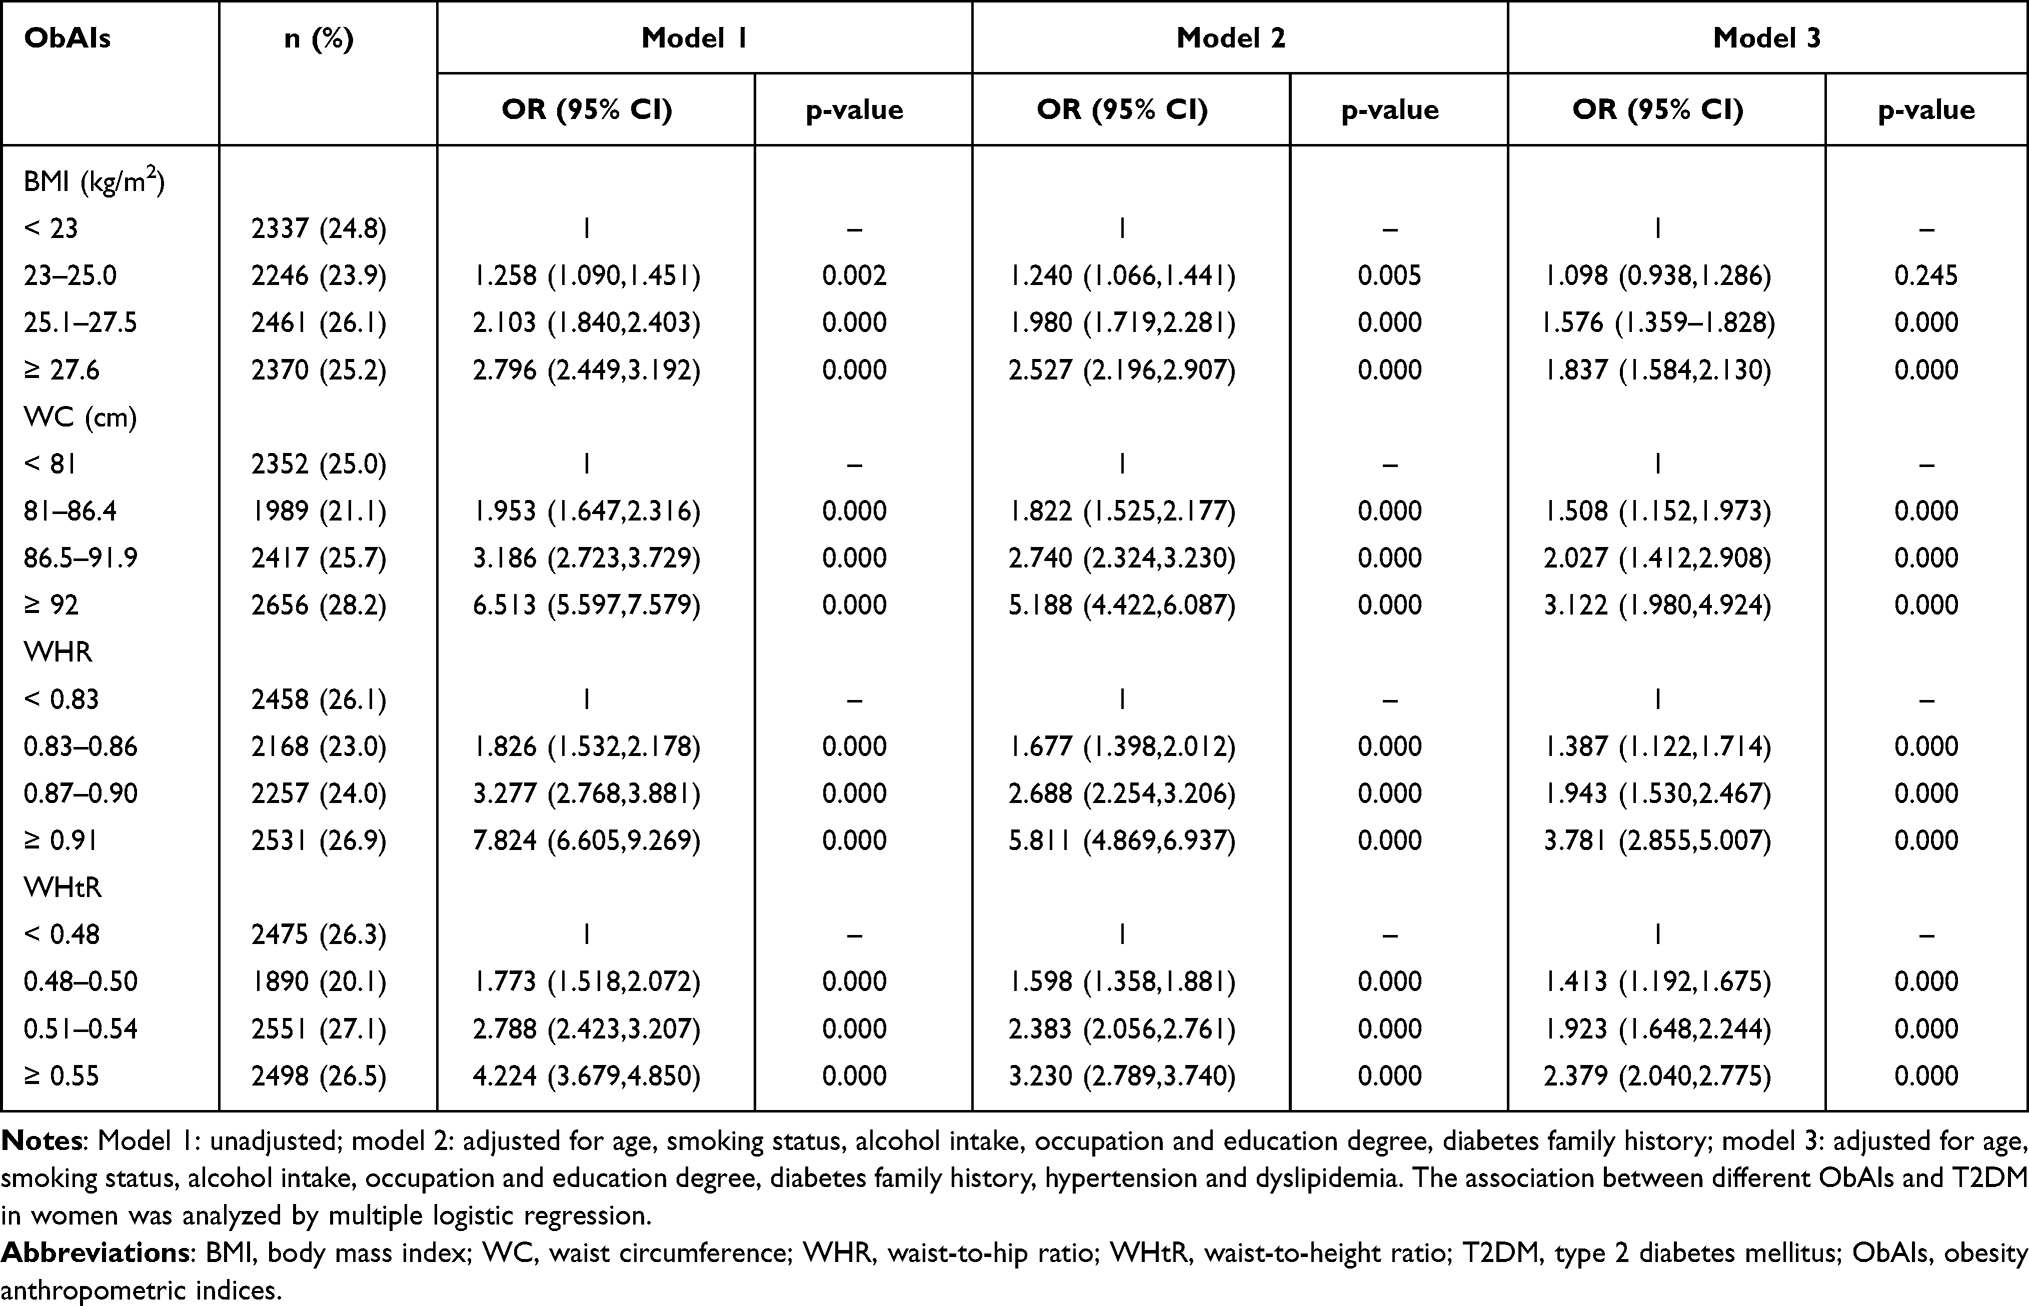 |
Table 3 OR and 95% CI for T2DM According to Quartiles of Different ObAIs in Women |
The areas under ROC curve of BMI, WC, WHR, and WHtR for men were 0.584 (95% CI: 0.568–0.600), 0.509 (95% CI: 0.492–0.525), 0.501 (95% CI: 0.485–0.518), 0.642 (95% CI: 0.627–0.658) and 0.619 (95% CI: 0.607–0.632), 0.709 (95% CI: 0.697–0.720), 0.741 (95% CI: 0.730–0.752), 0.654 (95% CI: 0.642–0.666), respectively, for women (Figure 1). The optimal cut-off values of BMI and WHtR were 25.0 kg/m2 and 0.52, respectively, in men. The optimal cut-off values of BMI, WC, WHR, and WHtR were 25.2 kg/m2, 82.9 cm, 0.90, and 0.51, respectively, in women.
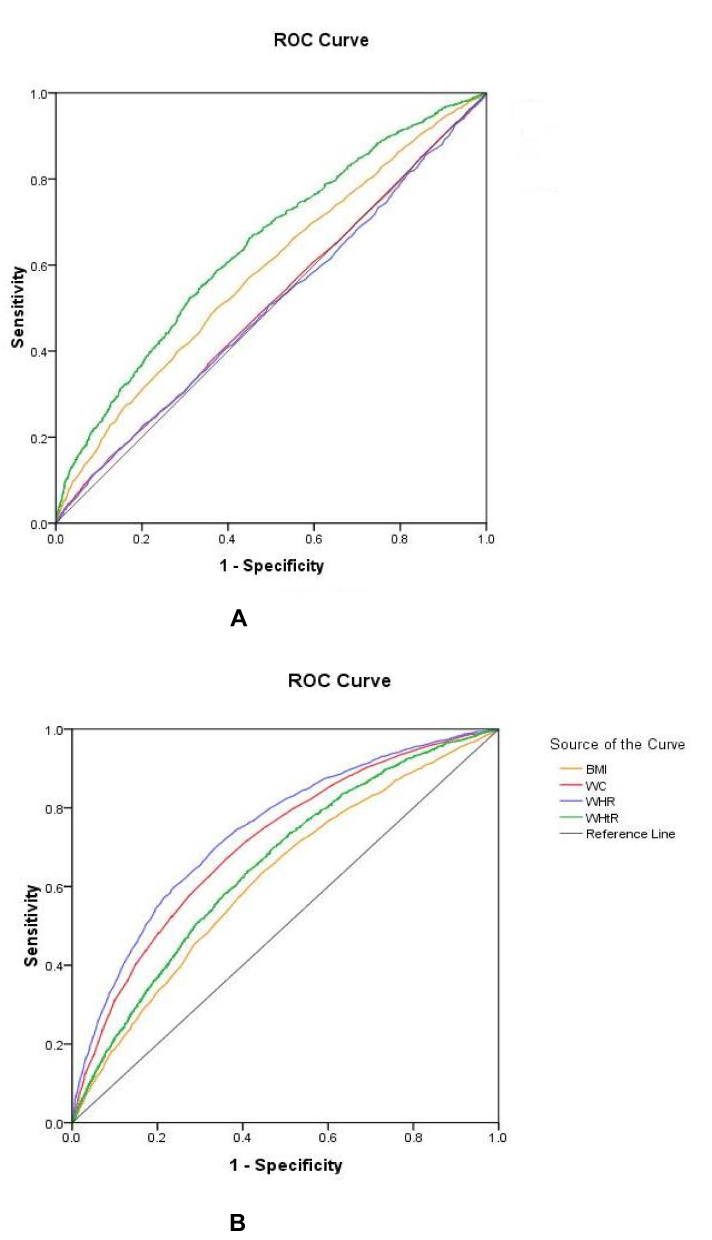 |
Figure 1 ROC curves of ObAIs for T2DM in men (A) and in women (B). |
Discussion
In the study, WHtR and WHR have been found to perform better as predictors of T2DM in middle-aged and elderly Chinese men and women, respectively. The result is consistent with some previous Chinese studies. A large investigation, including 244,266 Chinese adults aged ≥20 years from seven nationwide health examination centers in China, found that WHtR and WC were better predictors of T2DM in both sexes.19 Wang et al have reported that WHtR was the best predictor for future T2DM among men aged ≥50 years.20 Another recent study from China also demonstrated that WC and WHtR were more closely related to T2DM than BMI among participants ≥40 years of age.21 A possible explanation is that WHtR, WC and WHR can better reflect the accumulation of abdominal fat. Recent studies have suggested that abdominal obesity correlates more closely to T2DM than general obesity, involving native Asians, Asian immigrants, and Europeans.22–24 Abdominal adiposity, a feature of ectopic fat syndrome, is associated with chronic inflammation, abnormal hormone secretion and various metabolic disturbances that contribute to insulin resistance and insulin secretory defect, resulting in T2DM.25 In particular, Asian population is characterized by relatively higher body fat content at lower BMI values as compared with Caucasians,26 and seems to be more prone to visceral fat accumulation,27 which accounts for the rapid increase in T2DM prevalence in China. A recent cohort study has shown that abdominal obesity has a positive association with the risk of T2DM in Chinese middle-aged and older adults with normal-BMI.28 In conclusion, the abdominal ObAIs should be more powerful and sensitive predictors for T2DM compared with BMI. In our study, the ObAI for predicting T2DM was different between men and women. A possible explanation is that the body fat distribution is different between men and women, especially in postmenopausal women. In men, the adipose tissue is distributed throughout the body except for ectopic fat deposition in the abdomen. WHtR eliminating the effect of height could reflect both general and central obesity. Postmenopausal women are characterized by abdominal obesity because of aging and absence of estrogen protection, appearing as “apple” shape.29,30 WHR and WC are commonly used to reflect abdominal obesity. In our study, the average age of women was 56.9 years and nearly 80% of participants were postmenopausal women.
According to our results, the power of BMI in predicting T2DM was inferior to WHR, WC, and WHtR in women. Conversely, some Chinese studies showed that BMI was a better predictor for T2DM in women. Wang et al reported that BMI was the best predictor for T2DM among women aged ≥50 years in Jinan, China.20 A cross-sectional study conducted in Nantong, China, reported that the optimal ObAI related to T2DM was BMI for women aged ≥60 years.31 BMI reflecting overall obesity cannot distinguish between fat mass and fat-free mass. In addition, body fat distribution would change according to menopausal status, with central obesity more pronounced in postmenopausal women. Prospective research has demonstrated that WC is a better predictor of T2DM risk for postmenopausal Asian women.32 The difference in conclusion was possible due to the small sample size in the above two studies.
In our study, the optimal cut-off value of WHtR was 0.52 similar with previous studies.19,33,34 The optimal cut-off value of WC was 82.9 cm for women in our study. The result was in accordance with the Chinese metabolic syndrome diagnostic cut-off value of WC from IDF.35
Our study provides simple, early, and economical screening parameters to detect a higher risk for incident T2DM in middle-aged and elderly Chinese men and women.
The strengths of our study were the population-based design, large sample size, and excessive information on confounders. Our study had some limitations. First, WC as an ObAI cannot distinguish between subcutaneous and visceral adiposity in the abdomen. Secondly, our study was a cross-sectional survey, which cannot explore causality. We anticipate more prospective surveys to evaluate the relationship between different ObAIs and T2DM. Thirdly, some confounding factors such as physical activity and diet were not evaluated in the multivariate logistic regression analysis, and therefore, we could not confirm the association between the above two confounders and T2DM. In addition to, medication such as insulin may affect the body weight in the subjects with a history of T2DM, and therefore, confounding bias was unavoidable. Finally, we conducted the survey in Beijing, and therefore, the results could not be generalized to other regions in China.
In summary, obesity, especially central obesity, is an independent and modifiable risk factor for T2DM development. WHtR was the best index of men, and WHR followed by WC was the best index of women for predicting T2DM among the population aged 40 and older that is at a higher risk of developing T2DM in Beijing, China. Therefore, it is very important to strengthen obesity management for delaying and preventing T2DM development.
Ethical Approval and Informed Consent
This study complies with the Declaration of Helsinki and was approved by the First Medical Centre of Chinese PLA General Hospital Ethics Committee.
Acknowledgments
This study was supported by grants from the National Key New Drug Creation and Manufacturing Program of the Ministry of Science and Technology (2011ZX09307001-08). We would like to thank all authors for their contributions.
Disclosure
The authors declare no conflicts of interest in this work.
References
1. Saeedi P, Petersohn I, Salpea P, et al. Global and regional diabetes prevalence estimates for 2019 and projections for 2030 and 2045: results from the International Diabetes Federation Diabetes Atlas, 9(th) edition. Diabetes Res Clin Pract. 2019;157:107843. doi:10.1016/j.diabres.2019.107843
2. National Diabetes Research Group. Diabetes mellitus survey of 300,000 in fourteen provinces and cities of China. Chin Med J. 1981;20:678–681.
3. Li Y, Teng D, Shi X, et al. Prevalence of diabetes recorded in mainland China using 2018 diagnostic criteria from the American Diabetes Association: national cross sectional study. BMJ. 2020;369:m997. doi:10.1136/bmj.m997
4. Chooi YC, Ding C, Magkos F. The epidemiology of obesity. Metabolism. 2019;92:6–10. doi:10.1016/j.metabol.2018.09.005
5. Misra A, Bhardwaj S. Obesity and the metabolic syndrome in developing countries: focus on South Asians. Nestle Nutr Inst Workshop Ser. 2014;78:133–140.
6. Wang C, Li J, Xue H, et al. Type 2 diabetes mellitus incidence in Chinese: contributions of overweight and obesity. Diabetes Res Clin Pract. 2015;107(3):424–432. doi:10.1016/j.diabres.2014.09.059
7. Boffetta P, McLerran D, Chen Y, et al. Body mass index and diabetes in Asia: a cross-sectional pooled analysis of 900,000 individuals in the Asia cohort consortium. PLoS One. 2011;6(6):e19930. doi:10.1371/journal.pone.0019930
8. Yu HJ, Ho M, Liu X, et al. Association of weight status and the risks of diabetes in adults: a systematic review and meta-analysis of prospective cohort studies. Int J Obes. 2022;23:1–3.
9. Satoh H, Kishi R, Tsutsui H. Body mass index can similarly predict the presence of multiple cardiovascular risk factors in middle-aged Japanese subjects as waist circumference. Intern Med. 2010;49(11):977–982. doi:10.2169/internalmedicine.49.3006
10. Ying X, Song Z-Y, Zhao C-J, et al. Body mass index, waist circumference, and cardiometabolic risk factors in young and middle-aged Chinese women. J Zhejiang Univ Sci B. 2010;11(9):639–646. doi:10.1631/jzus.B1000105
11. Ashwell M, Gunn P, Gibson S. Waist-to-height ratio is a better screening tool than waist circumference and BMI for adult cardiometabolic risk factors: systematic review and meta-analysis. Obes Rev. 2012;13(3):275–286. doi:10.1111/j.1467-789X.2011.00952.x
12. Siddiquee T, Bhowmik B, Karmaker RK, et al. Association of general and central obesity with diabetes and prediabetes in rural Bangladeshi population. Diabetes Metab Syndr. 2015;9(4):247–251. doi:10.1016/j.dsx.2015.02.002
13. Cornier MA, Després JP, Davis N, et al. Assessing adiposity: a scientific statement from the American Heart Association. Circulation. 2011;124(18):1996–2019. doi:10.1161/CIR.0b013e318233bc6a
14. Adeboye B, Bermano G, Rolland C. Obesity and its health impact in Africa: a systematic review. Cardiovasc J Afr. 2012;23(9):512–521. doi:10.5830/CVJA-2012-040
15. Zhang FL, Guo ZN, Wu YH, et al. Prevalence of stroke and associated risk factors: a population based cross sectional study from northeast China. BMJ Open. 2017;7(9):e015758. doi:10.1136/bmjopen-2016-015758
16. Xu Y, Wang L, He J, et al. Prevalence and control of diabetes in Chinese adults. JAMA. 2013;310(9):
17. Chinese Diabetes Society. [Guideline for the prevention and treatment of type 2 diabetes mellitus in China (2020 edition)]. Chin J Diabetes Mellitus. 2021;13(4):315–409. Chinese.
18. Joint committee issued Chinese guideline for the management of dyslipidemia in adults. [2016 Chinese guideline for the management of dyslipidemia in adults]. Zhonghua Xin Xue Guan Bing Za Zhi. 2016;44(10):833–853. Chinese. doi:10.3760/cma.j.issn.0253-3758.2016.10.005
19. Zeng Q, He Y, Dong S, et al. Optimal cut-off values of BMI, waist circumference and waist: height ratio for defining obesity in Chinese adults. Br J Nutr. 2014;112(10):1735–1744. doi:10.1017/S0007114514002657
20. Wang S, Ma W, Yuan Z, et al. Association between obesity indices and type 2 diabetes mellitus among middle-aged and elderly people in Jinan, China: a cross-sectional study. BMJ Open. 2016;6(11):e012742. doi:10.1136/bmjopen-2016-012742
21. Zhang FL, Ren JX, Zhang P, et al. Strong association of Waist Circumference (WC), Body Mass Index (BMI), Waist-to-Height Ratio (WHtR), and Waist-to-Hip Ratio (WHR) with diabetes: a population-based cross-sectional study in Jilin Province, China. J Diabetes Res. 2021;2021:8812431. doi:10.1155/2021/8812431
22. Bennet L, Stenkula K, Cushman SW, et al. BMI and waist circumference cut-offs for corresponding levels of insulin sensitivity in a Middle Eastern immigrant versus a native Swedish population-the MEDIM population based study. BMC Public Health. 2016;16(1):1242. doi:10.1186/s12889-016-3892-1
23. Hartwig S, Kluttig A, Tiller D, et al. Anthropometric markers and their association with incident type 2 diabetes mellitus: which marker is best for prediction? Pooled analysis of four German population-based cohort studies and comparison with a nationwide cohort study. BMJ Open. 2016;6(1):e9266. doi:10.1136/bmjopen-2015-009266
24. Lu Y, Yang H, Xu Z, et al. Association between different obesity patterns and the risk of developing type 2 diabetes mellitus among adults in Eastern China: a cross-sectional study. Diabetes Metab Syndr Obes. 2021;14:2631–2639. doi:10.2147/DMSO.S309400
25. Scheen AJ, Van Gaal LF. Combating the dual burden: therapeutic targeting of common pathways in obesity and type 2 diabetes. Lancet Diabetes Endocrinol. 2014;2(11):911–922. doi:10.1016/S2213-8587(14)70004-X
26. Deurenberg P, Deurenberg-Yap M, Guricci S. Asians are different from Caucasians and from each other in their body mass index/body fat per cent relationship. Obes Rev. 2002;3(3):141–146. doi:10.1046/j.1467-789X.2002.00065.x
27. Xia MF, Chen Y, Lin HD, et al. A indicator of visceral adipose dysfunction to evaluate metabolic health in adult Chinese. Sci Rep. 2016;1(6):38214. doi:10.1038/srep38214
28. Chen X, Duan M, Hou R, et al. Prevalence of abdominal obesity in Chinese middle-aged and older adults with a normal body mass index and its association with type 2 diabetes mellitus: a nationally representative cohort study from 2011 to 2018. Diabetes Metab Syndr Obes. 2021;14:4829–4841. doi:10.2147/DMSO.S339066
29. Toth MJ, Tchernof A, Sites CK, et al. Effect of menopausal status on body composition and abdominal fat distribution. Int J Obes Relat Metab Disord. 2000;24(2):226–231. doi:10.1038/sj.ijo.0801118
30. Misso ML, Jang C, Adams J, et al. Differential expression of factors involved in fat metabolism with age and the menopause transition. Maturitas. 2005;51(3):299–306. doi:10.1016/j.maturitas.2004.08.013
31. Ge Q, Li M, Xu Z, et al. Comparison of different obesity indices associated with type 2 diabetes mellitus among different sex and age groups in Nantong, China: a cross-section study. BMC Geriatr. 2022;22(1):20. doi:10.1186/s12877-021-02713-w
32. Luo J, Hendryx M, Laddu D, et al. Racial and ethnic differences in anthropometric measures as risk factors for diabetes. Diabetes Care. 2019;42(1):126–133. doi:10.2337/dc18-1413
33. Wei W, Xin X, Shao B, et al. The relationship between anthropometric indices and type 2 diabetes mellitus among adults in north-east China. Public Health Nutr. 2014;31:1–9.
34. Li WC, Chen IC, Chang YC, et al. Waist-to-height ratio, waist circumference and body mass index as indices of cardiometabolic risk among 36,642 Taiwanese adults. Eur J Nutr. 2013;52(1):57–65. doi:10.1007/s00394-011-0286-0
35. Alberti KG, Zimmet P, Shaw J. Metabolic syndrome a new world-wide definition. A consensus statement from the international diabetes federation. Diabet Med. 2006;23(5):469–480. doi:10.1111/j.1464-5491.2006.01858.x
 © 2022 The Author(s). This work is published and licensed by Dove Medical Press Limited. The full terms of this license are available at https://www.dovepress.com/terms.php and incorporate the Creative Commons Attribution - Non Commercial (unported, v3.0) License.
By accessing the work you hereby accept the Terms. Non-commercial uses of the work are permitted without any further permission from Dove Medical Press Limited, provided the work is properly attributed. For permission for commercial use of this work, please see paragraphs 4.2 and 5 of our Terms.
© 2022 The Author(s). This work is published and licensed by Dove Medical Press Limited. The full terms of this license are available at https://www.dovepress.com/terms.php and incorporate the Creative Commons Attribution - Non Commercial (unported, v3.0) License.
By accessing the work you hereby accept the Terms. Non-commercial uses of the work are permitted without any further permission from Dove Medical Press Limited, provided the work is properly attributed. For permission for commercial use of this work, please see paragraphs 4.2 and 5 of our Terms.