")
Back to Journals » Diabetes, Metabolic Syndrome and Obesity » Volume 15
Association Between Serum Vitamin D Levels and Ketosis Episodes in Hospitalized Patients with Newly Diagnosed Ketosis-Prone Type 2 Diabetes
Authors He X , Luo Y , Hao J , Wang C , Gan K, Zhen Y, Ren L
Received 20 September 2022
Accepted for publication 15 November 2022
Published 12 December 2022 Volume 2022:15 Pages 3821—3829
DOI https://doi.org/10.2147/DMSO.S389609
Checked for plagiarism Yes
Review by Single anonymous peer review
Peer reviewer comments 2
Editor who approved publication: Professor Gian Paolo Fadini
Xiaoyu He,1 Yu Luo,1,2 Jianan Hao,1,3 Cuiyu Wang,1 Kexin Gan,1 Yunfeng Zhen,1 Luping Ren1
1Endocrinology Department, Hebei General Hospital, Shijiazhuang, Hebei, People’s Republic of China; 2Graduate School, North China University of Science and Technology, Tangshan, Hebei, People’s Republic of China; 3Graduate School, Hebei Medical University, Shijiazhuang, Hebei, People’s Republic of China
Correspondence: Luping Ren, Department of Endocrinology, Hebei General Hospital, 348 Heping West Road, Shijiazhuang, 050051, People’ s Republic of China, Tel +86 311 859 889 75, Email [email protected]
Purpose: This study aimed to investigate the relationship between 25-hydroxyvitamin D (25OHD) and the onset of ketosis in newly diagnosed patients with ketosis-prone type 2 diabetes (KPT2D).
Patients and Methods: A total of 162 patients with non-autoimmune newly diagnosed diabetes mellitus were included in this cross-sectional study. Patients were classified into KPT2D (n = 71) or non-ketotic type 2 diabetes (NKT2D, n = 91). Anthropometric parameters, islet functions, biochemical parameters, and body composition were determined in both KPT2D and NKT2D groups. Correlation analysis was performed to determine the associations between 25OHD and plasma ketones. The risk factors associated with ketosis episodes in patients with new-onset KPT2D were evaluated using binary logistic regression analysis.
Results: Vitamin D deficiency was observed in both patients with KPT2D and NKT2D. Compared with the NKT2D group, serum 25OHD values were lower in the participants of the KPT2D group [14.20 (10.68, 19.52) vs 16.98 (13.54,2.96) ng/mL, P = 0.011]. Serum 25OHD was associated with plasma ketones (R = − 0.387). Serum 25OHD is an independent protective factor for ketosis or ketoacidosis episodes in patients with new onset of KPT2D (P = 0.037, OR = 0.921).
Conclusion: Vitamin D levels are associated with ketosis episodes in patients with KPT2D. Serum 25OHD is an independent protective factor for ketosis episodes in patients with KPT2D.
Keywords: vitamin D, newly onset ketosis-prone diabetes, ketosis-onset, diabetic ketosis
Introduction
Diabetic ketoacidosis (DKA) is an acute and serious complication resulting from diabetes. It is commonly observed in patients with type 1 diabetes (T1D).1 However, more researchers have observed that patients with diabetes ketosis or DKA have mixed symptoms of T1D and type 2 diabetes (T2D) as their initial symptoms.2 Recently, patients with new-onset T2D with major symptoms as unprovoked ketosis or DKA are often diagnosed as patients with ketosis-prone type 2 diabetes (KPT2D).3,4 The latest World Health Organization literature defines KPT2D as a hybrid form of diabetes.5 A recent study suggested that the number of patients with KPT2D has increased rapidly, which can be associated with changes in diet structure and lifestyle.3 A previous study has suggested that 90% of these individuals will suffer episodes of ketosis within 10 years.6 Patients with KPT2D with ketosis but no acidosis often have no distinct clinical symptoms in the early stage.7 Under these circumstances, failure to diagnose ketosis early can lead to serious consequences.
Vitamin D deficiency is common globally and is linked with various diseases.8 Studies in recent years have shown that high and low vitamin D levels are also association with the pathogenesis of diabetes.9 Vitamin D increases insulin secretion by directly stimulating the β cells of the pancreas via its nuclear receptors.10 Cade et al showed that a single administration of 1alpha,25-dihydroxy vitamin D3 (1,25 (OH)2D3) improves insulin secretion in rats with vitamin D deficiency within 3 h.9 Furthermore, vitamin D also increases insulin sensitivity. In a human study, serum 25-hydroxyvitamin D (25OHD) concentration was positively associated with insulin sensitivity measured using hyperglycemic clamping.10 Nagpal et al showed that three doses of 1,20,000 IU of vitamin D3 for two weeks significantly improved the 3-h oral glucose test (OGTT)-derived insulin sensitivity indices in healthy abdominally obese Asian Indian men group compared with the placebo group.11 Above findings suggested that serum vitamin D is closely associated with the functions of pancreatic islet cells.
Absolute deficiency of insulin secretion is observed during the pathogenesis and development of DKA.12 The above studies have shown that vitamin D can affect islet function, therefore, we can speculate that 25OHD can be related to the DKA episode. Previous studies have shown DKA in children with T1D is associated with vitamin D. An observational study by Al-Zubeidi in patients with new-onset T1D showed a significant relationship between vitamin D values and DKA. Low levels of vitamin D are often found in patients with T1D and even lower levels are in patients with DKA.13 Huynh et al showed that most children with a definite diagnosis of low vitamin D levels had bicarbonate levels < 18 mmol/L. Furthermore, they also found that the remission of diabetic acidosis in children was associated with the recovery of low serum vitamin D levels. The authors speculated that low levels of vitamin D can perform a crucial function in determining if DKA is present during diagnosis in children with T1D.14
Presently, no studies has shown the association between vitamin D levels and ketosis in patients with new onset KPT2D. Therefore, in this study, we aimed to investigate the relationship between 25OHD and ketosis or DKA episodes in newly diagnosed patients with KPT2D.
Patients and Methods
Study Design
This was a cross-sectional study conducted consistent with the provisions of the Declaration of Helsinki. The present study protocol was approved by Hebei General Hospital (Shijiazhuang, Hebei province, China) Ethics Committee (review no: 2022–394). All patients provided their signed informed consent. The subjects’ information was kept confidential.
Subjects Collected
A total of 162 subjects were recruited in the study, which included 71 newly diagnosed KPT2D patients (KPT2D group) and 91 newly diagnosed non-ketotic T2D patients (NKT2D group). All patients were inpatients of the Department of Endocrinology, Hebei General Hospital from January 2018 to December 2020. All enrolled patients were long-time residents of Hebei, China (North of China) and were of age ≥18 years old. All patients met the 2011 World Health Organization diagnostic criteria for diabetes mellitus.
Inclusion Criteria
Newly Onset KPT2D with Ketosis
- Duration of diabetes≤3 months;
- Urinary ketone body++(≥80 mg/dL or 0.5–15 mmol/L) or plasma ketones ≥1.0 mmol/L, FCP >1.1 mmol/L or OGTT peak C-peptide >1.5 mmol/L measured at the time of admission;
- No insulin autoantibodies, such as ICAS, GAD65, and IA-2.
Non-Ketotic T2D
- Duration of diabetes ≤3 months;
- No DKA or urinary ketone bodies at the time of admission, plasma ketones ≤0.6 mmol/L;
- No insulin autoantibodies, such as ICAS, GAD65, and IA-2.
Exclusion Criteria
- Severe liver and kidney disease, ALT >2.5-times the normal, creatinine >124 mmol/L;
- Exclude another coexisting ketosis, starvation ketosis, alcoholic ketosis, hepatitis B, hepatitis C, and HIV+;
- Special types of diabetes, such as maternally Inherited diabetes and deafness (MIDD) and secondary diabetes;
- Malignancy, pregnancy, taking drugs that affect glucose metabolism, such as glucocorticoids.
Data Collection
The subjects’ basic information and biochemical indicators were obtained at their admission. Their basic information included sex, age, blood pressure, weight, and height. Body mass index (BMI) was calculated as weight (kg)/height2 (m2). All patients’ blood indicators were tested in the same laboratory. The tested biochemical indicators included total protein, albumin (ALB), alanine aminotransferase (ALT), aspartate aminotransferase (AST), gamma-glutamyl transpeptidase (GGT), blood urine nitrogen (BUN), blood creatinine (SCr), blood uric acid (UA), glomerular filtration rate (GFR), 25OHD, triglycerides (TG), total cholesterol (TC), low-density lipoprotein cholesterol (LDL-C), high-density lipoprotein cholesterol (HDL-C), blood calcium levels (Ca2+), hemoglobin A1c (HbA1c), fasting blood glucose (FBG), fasting insulin level, and fasting C-peptide (FCP) level. Serum 25OHD levels were measured by using the electrochemiluminescence method (Roche reagent) at the Department of Nuclear Medicine, Hebei General Hospital. The indexes of homeostasis model assessment of insulin resistance (HOMA-IR), β-cell insulin secretion (HOMA-β), and early insulin secretory function (ΔI30/ΔG30) were calculated according to the insulin and glucose levels using the following equation: HOMA-β = 20 × fasting insulin level/(FBG - 3.5); HOMA-IR = fasting insulin × FBG/22.5; ΔI30/ΔG30 = 0.5-h insulin - fasting insulin)/(0.5-h glucose - FBG)). All patients underwent glucose tolerance tests, insulin measurements, and a C-peptide test. The AUC of C-peptide and insulin were used to evaluate the islet function (AUC=1/4×(S0+2×S30+3×S60+4×S120+2×S180), (S0, S30, S60, S120, and S180 were the insulin levels or the C-peptide levels at 0, 30, 60, 120, and 180 min, respectively).
Statistical Analysis
The data were analyzed using the SPSS 26.0 software. For continuous variables, Student’s t-test (normally distributed data, presented as mean ± SD) and Mann–Whitney U-test (data with a skewed distribution, presented as the median, 25th, and 75th percentiles) were used to compare the differences between the KPT2D and NKT2D groups. Categorical count data were expressed as the number of cases (percentage), and the χ2 test was used for comparison between the two groups. The relationship between the clinical variables was evaluated by calculating the correlational coefficients. A binary logistic regression analysis was performed for risk factors for ketosis episodes in KPT2D. P < 0.05 was considered to indicate a statistically significant difference.
Results
The Characteristics and Anthropometric Features of the Subjects
Compared to the NKT2D group, the participants in the KPT2D group were younger [36 (30, 47) vs 50 (38, 60) years, P <0.001] and predominantly male (80.3 vs 61.5%, P = 0.01; Table 1). No significant difference was found in weight, BMI, and blood pressure.
 |
Table 1 Clinical and Anthropometric Features of the KPT2D and NKT2D Groups |
Laboratory Findings of Subjects
The biochemical results are presented in Table 2. As shown in the results, the mean 25OHD values were less than 20 ng/mL in both groups, which indicated that 25OHD deficiency was common in patients with diabetes. Compared with the patients with NKT2D, 25OHD [14.20 (10.68, 19.52) vs 16.98 (13.54, 21.96) ng/mL, P = 0.011) decreased significantly in patients with KPT2D (Figure 1). The levels of total protein (65.25 ± 7.81 vs 68.13 ± 6.39 g/L, P = 0.011) and HDL-C [0.91 (0.77, 1.11) vs 1.04 (0.88, 1.23) mmol/L, P = 0.006] were lower significantly in patients with KPT2D compare with patients with NKT2D. The KPT2D group had higher levels of HbA1c [12.00 (11.00, 13.30) vs 10.30 (8.60, 11.60) %, p < 0.001], FBG[12.22 (9.96, 15.45) vs 8.83 (7.20, 11.27) mmol/L, P < 0.001], GFR [112.44 (101.94, 124.78) vs 105.75 (96.02, 115.15) mL/min, P = 0.006], TC [5.44 (4.64, 6.50) vs 5.00 (4.09, 5.85) mmol/L, P = 0.009], TG [2.13 (1.29, 4.87) vs 1.53 (1.17, 2.52) mmol/L, P = 0.012], and LDL-C [3.67 ± 1.03 vs 3.18 ± 0.90 mmol/L, P = 0.002] compared with the NKT2D group. No significant difference was found in the ALB, ALT, AST, GGT, BUN, SCr, and Ca2+ between the two groups.
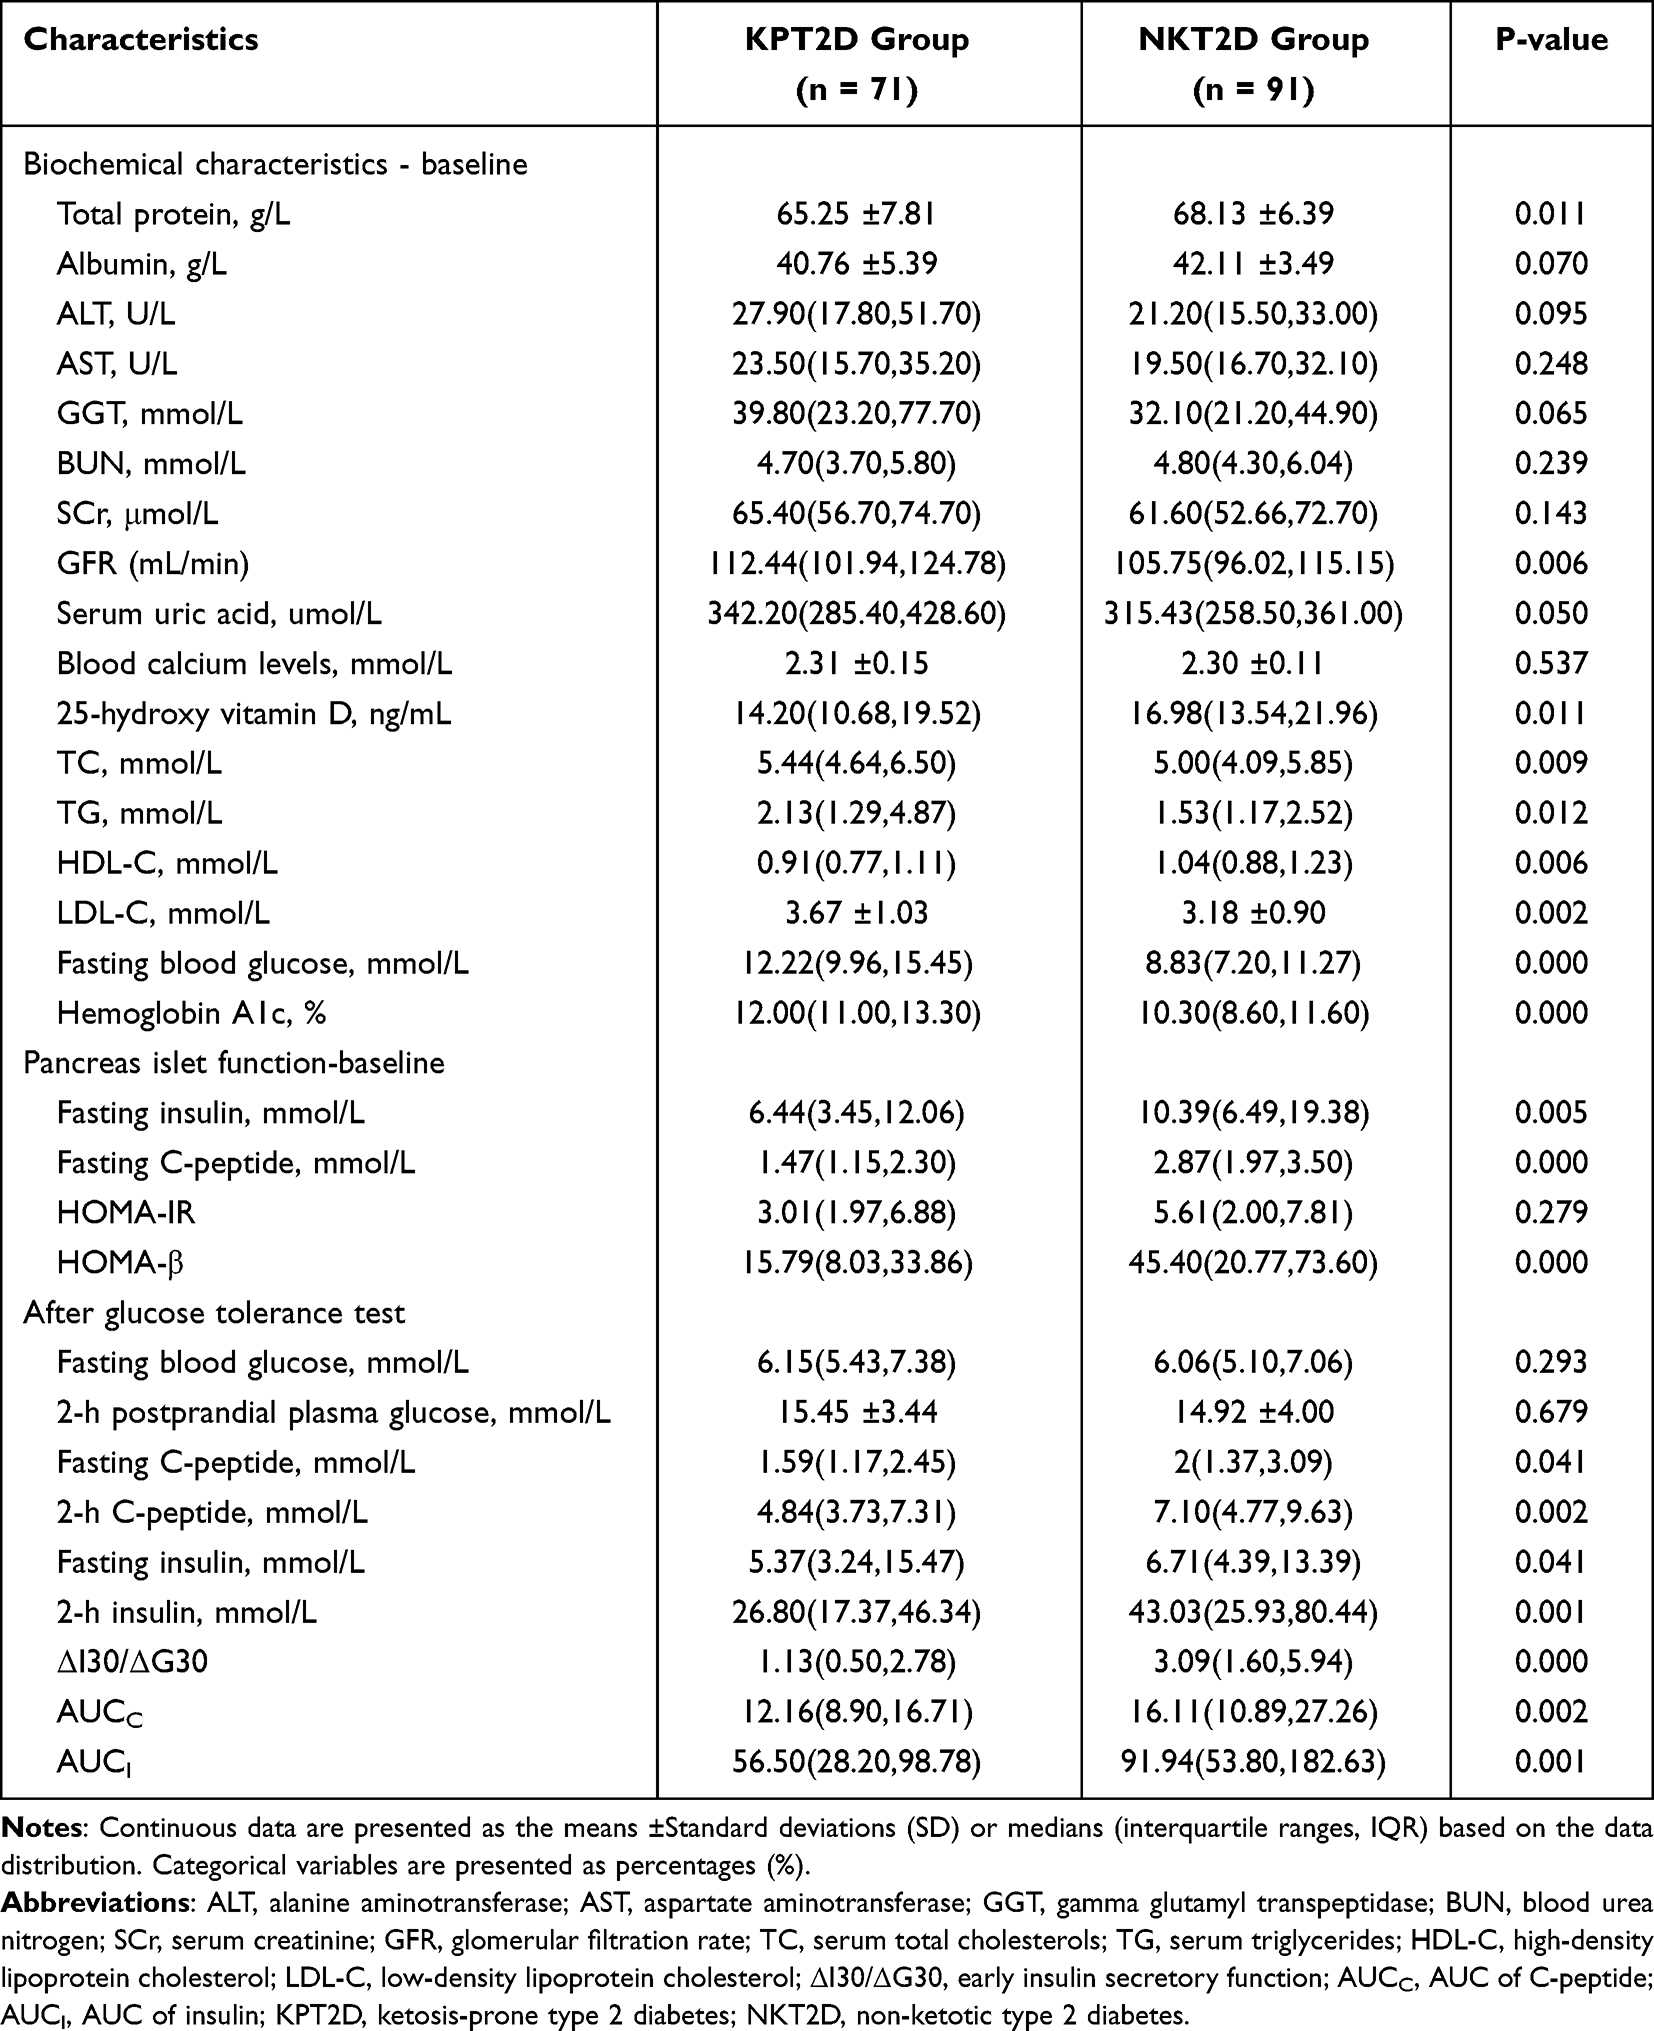 |
Table 2 Laboratory Findings in the KPT2D and NKT2D Groups |
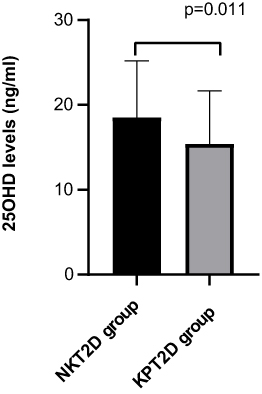 |
Figure 1 Distribution of the 25OHD levels in the two groups. Notes: Comparison of the 25OHD levels between the KPT2D and NKT2D groups, P = 0.011. |
The fasting insulin in KPT2D group were decreased when compared with NKT2D group [6.44 (3.45, 12.06) vs 10.39 (6.49, 19.38) mmol/L, P = 0.005]. Patients with KPT2D also had lower FCP levels [1.47 (1.15, 2.30) vs 2.87 (1.97, 3.50) mmol/L, P < 0.001] and lower HOMA-β [15.79 (8.03, 33.86) vs 45.40 (20.77, 73.60), P < 0.001]. No significant difference was found in HOMA-IR between the two groups. The AUCC [12.16 (8.90, 16.71) vs 16.11 (10.89, 27.26), P = 0.002], AUCI [56.50 (28.20, 98.78) vs 91.94 (53.80, 182.63), P = 0.001] and ΔI30/ΔG30 [1.13 (0.50, 2.78) vs 3.09 (1.60, 5.94), P < 0.001] were decreased in the KPT2D group compared with the NKT2D group.
After OGTT, compared with patients with NKT2D, patients with KPT2D had lower levels of FCP [1.59 (1.17, 2.45) vs 2.00 (1.37, 3.09) mmol/L, P = 0.041], 2h-C-peptide [4.84 (3.73, 7.31) vs 7.10 (4.77, 9.63) mmol/L, P = 0.002], fasting insulin [5.37 (3.24, 15.47) vs 6.71 (4.39, 13.39) mmol/L, P = 0.041], and 2h insulin [26.80 (17.37, 46.34) vs 43.03 (25.93, 80.44) mmol/L, P = 0.001]. No significant difference was found in FBG and 2 h postprandial plasma glucose (2h-PPG).
Correlation Between Other Factors and 25OHD Levels
The results of the correlation analysis are shown in Table 3. Plasma ketones (Rs = −0.387, P = 0.020) and HbA1c (RS = −0.375, P = 0.022) negatively correlated with 25OHD levels. HOMA-β (RS = 0.264, P = 0.031) (Figure 2A) and ΔI30/ΔG30 (RS = 0.223, P = 0.033) positively correlated with serum 25OHD levels. No significant difference was found in 25OHD and HOMA-IR (Figure 2B).
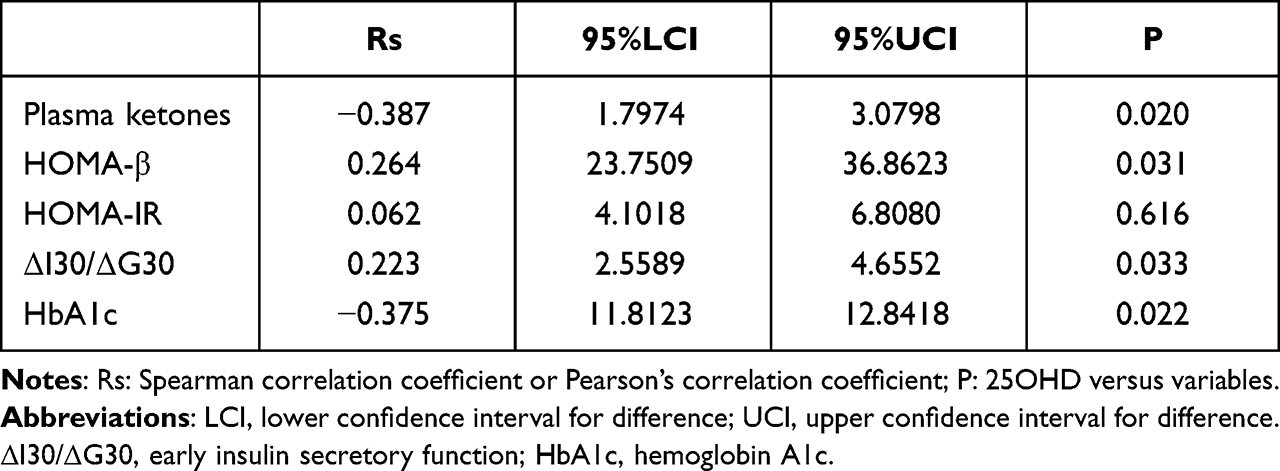 |
Table 3 Correlation Between the 25OHD Level and a Variety of Parameters |
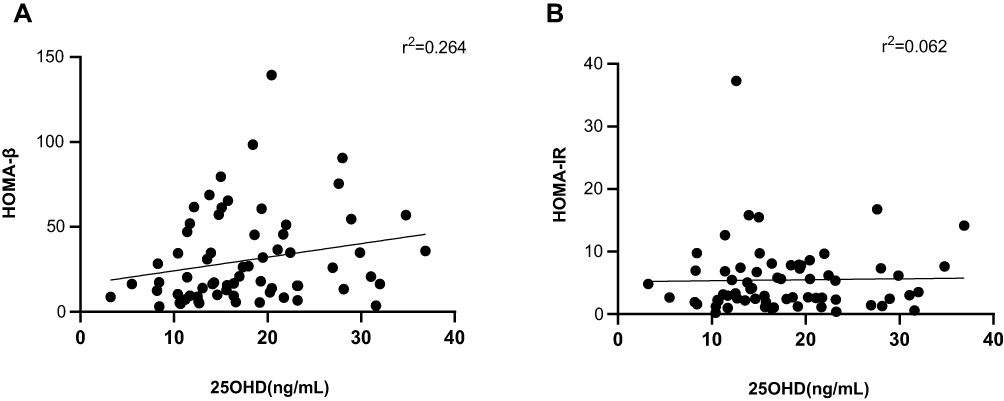 |
Figure 2 Correlational analysis of the 25OHD levels with HOMA-β and HOMA-IR in all subjects. Notes: (A) The correlational analysis between the 25OHD level and HOMA-β, P = 0.031; (B) the correlational analysis between the 25OHD level and HOMA-IR, P = 0.616. |
Relationship Between 25OHD and Ketosis Episodes
Based on all the significantly correlated variables (25OHD, HbA1c, FBG, total protein, TG, LDL-C, gender, and age), we performed binary logistic regression analyses. In the multivariate model that included 25OHD, HbA1c, FBG, total protein, TG, LDL-C, gender, and age, 25OHD was a significant protective factor for the risk of ketosis [odds ratio (OR) = 0.921, 95% confidence interval 0.853–0.995, P = 0.037) (Table 4).
 |
Table 4 Parameters of the Binary Logistic Regression Model |
Discussion
To our knowledge, this is the first study to show a significant correlation between ketosis or DKA and serum 25OHD levels in newly-onset KPT2D. Our results showed that serum 25OHD values are decreased in patients with KPT2D compared with patients with NKT2D and were significantly associated with ketosis onset in patients with KPT2D. We further founded that 25OHD levels were negatively correlated with plasma ketone levels. To investigate the risk factors of ketosis episodes in patients with KPT2D, we performed a binary logistic regression analysis and found that 25OHD is an independent protective factor for the ketosis episode in patients with KPT2D.
To explore the potential role which serum 25OHD may play in the ketosis onset, we further investigate the correlation between 25OHD and pancreatic islet function. We found that 25OHD was positively correlated with HOMA-β and early insulin secretory function, which indicated that 25OHD can regulate insulin secretion. The results of many previous studies were consistent with our results. An in vivo study showed that insulin levels are lower in vitamin D-deficient or vitamin D receptor-insensitive mice, and vitamin D supplementations can improve insulin production.15 Previous in vitro studies showed that 1,25(OH)2D3 promotes insulin release from pancreatic islets.16 Furthermore, in a non-randomized study consisting of 10 women with T2D (of which 7 women had vitamin D deficiency at baseline), first-stage insulin secretion during intravenous glucose loading increased to 34% from baseline after 1 month of oral cholecalciferol (D3) 1332 IU/D treatment.17 These findings showed that vitamin D can improve insulin secretion. The development of ketosis or DKA is closely associated with vitamin D deficiency. Many mechanisms can affect the vitamin D on insulin secretion. First, it is known that 1, 25-dihydroxy vitamin D promotes insulin synthesis and secretion by binding to vitamin D receptors or by regulating calcium transport in islet β-cells.18 Second, 1, 25-dihydroxy vitamin D can promote insulin secretion by activating human insulin gene transcription via 25(OH)D-1a-hydroxylase (CYP27B1) in pancreatic islet cells. Third, vitamin D3 activates the AMPK pathway, inhibiting the mTOR pathway, thereby inhibiting the activation of NLRP3 inflammasome and alleviating pyroptosis in dysfunctional β-cell.19 Overall, vitamin D can regulate islet function via various mechanisms.
Our study showed no significant correlation between 25OHD and HOMA-IR in the whole sample. Previous studies have drawn inconsistent conclusions on the effects of 25OHD on insulin sensitivity. Some studies showed that vitamin D can play a positive part in improving insulin sensitivity. In an in vivo study, insulin sensitivity was determined in non-obese T2D rats that were fed an 8-week high-fat diet by a hyperinsulinemic-euglycemic clamp test. The study found that insulin sensitivity significantly decreased in vitamin D-deficient rats.20 In a human study, Naharci et al found that insulin sensitivity significantly increased in 28 geriatric patients (aged ≥ 65 years) with impaired fasting glucose (IFG) treated with vitamin D3 and ionized calcium.21 Pittas et al showed improved HOMA-IR after 3 years of daily supplementation of calcium citrate and vitamin D3 in Caucasian patients with IFG.22 However, Gulseth et al showed that the supplementation with high levels of vitamin D does not improve glycemic control and insulin sensitivity in patients with T2D.23 A placebo-controlled trial by Mousa et al found no significant difference in insulin sensitivity in 28 overweight or obese healthy patients with vitamin D deficiency who were treated with 1,00,000 IU cholecalciferol orally (followed by 4000 IU cholecalciferol daily) for 16 weeks compared with controls.24 The inconsistent findings may be due to the different research designs of these studies. The relationship between insulin sensitivity and vitamin D should be confirmed by a prospective study. In addition, further studies are required to show that vitamin D supplementation can be used as an adjuvant to prevent ketosis in patients with KPT2D.
Variables associated with increased glucose levels, such as FBG and HbA1c, were higher in patients with KPT2D than in NKT2D patients. The results showed that FBG and HbA1c were independent risk factors for patients with KPT2D with ketosis onset. The result is consistent with the results of previous research.5
Moreover, our study showed that TG, TC, and LDL-C were significantly increased in patients with KPT2D compared with patients with NKT2D. These findings suggested that glucotoxicity combined with lipotoxicity led to impaired islet function, insulin receptor insensitivity, and ultimately decreased insulin secretion capacity, which resulted in ketone body production.
Baseline data from this study showed that patients with KPT2D were younger and predominantly male. This is consistent with previous studies.25 The reason for this gender difference is not clear. Body fat distribution and its associated insulin sensitivity are now considered the main factor for the gender differences in DKA onset.26,27
The present study has certain limitations that should be considered. First, this is a cross-sectional study; therefore, the evidence it provides is insufficient. Second, this study included patients with newly onset KPT2D and NKT2D and the findings may not be applicable to all patients with diabetes. Finally, this study did not consider the effect of seasonal fluctuations of 25OHD levels.
Conclusion
To conclude, in this study, we showed that 25OHD is significantly associated with the development of ketosis in patients with KPT2D. Serum 25OHD levels could be a protective factor for the development of ketosis in patients with KPT2D.
Acknowledgments
We are grateful to all participants of this study.
Disclosure
The authors declare no conflicts of interest.
References
1. Ye S, Ran H, Zhang H, et al. Elevated serum triglycerides are associated with ketosis-prone type 2 diabetes in young individuals. Diabetes Metab Syndr Obes. 2021;14:497–504. doi:10.2147/DMSO.S296085
2. Umpierrez GE, Smiley D, Kitabchi AE. Narrative review: ketosis-prone type 2 diabetes mellitus. Ann Intern Med. 2006;144(5):350–357. doi:10.7326/0003-4819-144-5-200603070-00011
3. Du S, Zhang H, Wu H, Ye S, Li W, and Su Q . Prevalence and gender differences of metabolic syndrome in young ketosis-prone type 2 diabetic individuals: a retrospective study. Diabetes Metab Syndr Obes. 2020;13:2719–2727. doi:10.2147/DMSO.S252492
4. Tan H, Zhou Y, Yu Y. Characteristics of diabetic ketoacidosis in Chinese adults and adolescents -- a teaching hospital-based analysis. Diabetes Res Clin Pract. 2012;97(2):306–312. doi:10.1016/j.diabres.2012.05.004
5. Wang Y, Lu C, Augusto Monteiro Cardoso Lopes M, et al. A Cross-sectional study of atherosclerosis in newly diagnosed patients with ketosis-prone type 2 diabetes. Diabetes Metab Syndr Obes. 2022;15:933–941. doi:10.2147/DMSO.S349467
6. Thomas CC, Philipson LH. Update on diabetes classification. Med Clin North Am. 2015;99(1):1–16. doi:10.1016/j.mcna.2014.08.015
7. Zhu B, Bu L, Zhang M, et al. HbA1c as a screening tool for ketosis in patients with type 2 diabetes mellitus. Sci Rep. 2016;6:39687. doi:10.1038/srep39687
8. van Schoor NM, Lips P. Worldwide vitamin D status. Best Pract Res Clin Endocrinol Metab. 2011;25(4):671–680. doi:10.1016/j.beem.2011.06.007
9. Cade C, Norman AW. Rapid normalization/stimulation by 1,25-dihydroxyvitamin D3 of insulin secretion and glucose tolerance in the vitamin D-deficient rat. Endocrinology. 1987;120(4):1490–1497. doi:10.1210/endo-120-4-1490
10. Chiu KC, Chu A, Go VL, and Saad MF . Hypovitaminosis D is associated with insulin resistance and beta cell dysfunction. Am J Clin Nutr. 2004;79(5):820–825. doi:10.1093/ajcn/79.5.820
11. Nagpal J, Pande JN, Bhartia A. A double-blind, randomized, placebo-controlled trial of the short-term effect of vitamin D3 supplementation on insulin sensitivity in apparently healthy, middle-aged, centrally obese men. Diabet Med. 2009;26(1):19–27. doi:10.1111/j.1464-5491.2008.02636.x
12. Gosmanov AR, Gosmanova EO, Dillard-Cannon E. Management of adult diabetic ketoacidosis. Diabetes Metab Syndr Obes. 2014;7:255–264. doi:10.2147/DMSO.S50516
13. Al-Zubeidi H, Leon-Chi L, Newfield RS. Low vitamin D level in pediatric patients with new onset type 1 diabetes is common, especially if in ketoacidosis. Pediatr Diabetes. 2016;17(8):592–598. doi:10.1111/pedi.12342
14. Huynh T, Greer RM, Nyunt O, et al. The association between ketoacidosis and 25(OH)-vitamin D levels at presentation in children with type 1 diabetes mellitus. Pediatr Diabetes. 2009;10(1):38–43. doi:10.1111/j.1399-5448.2008.00439.x
15. Tai K, Need AG, Horowitz M, Chapman IM, and Vitamin D . Glucose, insulin, and insulin sensitivity. Nutrition. 2008;24(3):279–285. doi:10.1016/j.nut.2007.11.006
16. Wu M, Lu L, Guo K, Lu J, and Chen H . Vitamin D protects against high glucose-induced pancreatic beta-cell dysfunction via AMPK-NLRP3 inflammasome pathway. Mol Cell Endocrinol. 2022;547:111596. doi:10.1016/j.mce.2022.111596
17. Borissova AM, Tankova T, Kirilov G, Dakovska L, and Kovacheva R . The effect of vitamin D3 on insulin secretion and peripheral insulin sensitivity in type 2 diabetic patients. Int J Clin Pract. 2003;57(4):258–261.
18. Boucher BJ. Vitamin D insufficiency and diabetes risks. Curr Drug Targets. 2011;12(1):61–87. doi:10.2174/138945011793591653
19. Sadek KM, Shaheen H. Biochemical efficacy of vitamin D in ameliorating endocrine and metabolic disorders in diabetic rats. Pharm Biol. 2014;52(5):591–596. doi:10.3109/13880209.2013.854812
20. Park S, Kim DS, Kang S. Vitamin D deficiency impairs glucose-stimulated insulin secretion and increases insulin resistance by reducing PPAR-gamma expression in nonobese Type 2 diabetic rats. J Nutr Biochem. 2016;27:257–265. doi:10.1016/j.jnutbio.2015.09.013
21. Naharci I, Bozoglu E, Kocak N, Doganci S, Doruk H, and Serdar M . Effect of vitamin D on insulin sensitivity in elderly patients with impaired fasting glucose. Geriatr Gerontol Int. 2012;12(3):454–460. doi:10.1111/j.1447-0594.2011.00791.x
22. Pittas AG, Harris SS, Stark PC, and Dawson-Hughes B . The effects of calcium and vitamin D supplementation on blood glucose and markers of inflammation in nondiabetic adults. Diabetes Care. 2007;30(4):980–986. doi:10.2337/dc06-1994
23. Gulseth HL, Wium C, Angel K, Eriksen EF, and Birkeland KI . Effects of vitamin D supplementation on insulin sensitivity and insulin secretion in subjects with type 2 diabetes and vitamin D deficiency: a randomized controlled trial. Diabetes Care. 2017;40(7):872–878. doi:10.2337/dc16-2302
24. Mousa A, Naderpoor N, de Courten MP, et al. Vitamin D supplementation has no effect on insulin sensitivity or secretion in vitamin D-deficient, overweight or obese adults: a randomized placebo-controlled trial. Am J Clin Nutr. 2017;105(6):1372–1381. doi:10.3945/ajcn.117.152736
25. Wang JW, Wang AP, Chen MY, et al. Prevalence and clinical characteristics of hypertension and metabolic syndrome in newly diagnosed patients with ketosis-onset diabetes: a cross-sectional study. Diabetol Metab Syndr. 2019;11:31. doi:10.1186/s13098-019-0426-x
26. Shi H, Strader AD, Woods SC, and Seeley RJ . Sexually dimorphic responses to fat loss after caloric restriction or surgical lipectomy. Am J Physiol Endocrinol Metab. 2007;293(1):E316–E326. doi:10.1152/ajpendo.00710.2006
27. Otsuki M, Kasayama S, Saito H, Mukai M, and Koga M . Sex differences of age-dependent changes of insulin sensitivity in Japanese nondiabetic subjects. Diabetes Care. 2005;28(10):2590–2591. doi:10.2337/diacare.28.10.2590a
 © 2022 The Author(s). This work is published and licensed by Dove Medical Press Limited. The full terms of this license are available at https://www.dovepress.com/terms.php and incorporate the Creative Commons Attribution - Non Commercial (unported, v3.0) License.
By accessing the work you hereby accept the Terms. Non-commercial uses of the work are permitted without any further permission from Dove Medical Press Limited, provided the work is properly attributed. For permission for commercial use of this work, please see paragraphs 4.2 and 5 of our Terms.
© 2022 The Author(s). This work is published and licensed by Dove Medical Press Limited. The full terms of this license are available at https://www.dovepress.com/terms.php and incorporate the Creative Commons Attribution - Non Commercial (unported, v3.0) License.
By accessing the work you hereby accept the Terms. Non-commercial uses of the work are permitted without any further permission from Dove Medical Press Limited, provided the work is properly attributed. For permission for commercial use of this work, please see paragraphs 4.2 and 5 of our Terms.