")
Back to Journals » Therapeutics and Clinical Risk Management » Volume 13
Association between serum cystatin C and bone mineral density in Korean adults
Authors Yi DW , Khang AR , Lee HW, Son SM , Kang YH
Received 10 August 2017
Accepted for publication 18 October 2017
Published 22 November 2017 Volume 2017:13 Pages 1521—1528
DOI https://doi.org/10.2147/TCRM.S147523
Checked for plagiarism Yes
Review by Single anonymous peer review
Peer reviewer comments 3
Editor who approved publication: Professor Garry Walsh
Dongwon Yi,1,2 Ah Reum Khang,1,2 Hye Won Lee,1,2 Seok Man Son,1,2 Yang Ho Kang1,2
1Division of Endocrinology and Metabolism, Department of Internal Medicine, Pusan National University Yangsan Hospital, Pusan National University School of Medicine, 2Research Institute for Convergence of Biomedical Science and Technology, Pusan National University Yangsan Hospital, Yangsan, Korea
Background: Serum cystatin C has been known as a novel marker of preclinical renal dysfunction, and higher cystatin C levels are associated with increased risks of hip and nonvertebral fractures. However, there are few reports on the association between serum cystatin C and bone mineral density (BMD), especially in the Asian population. We evaluated the association between cystatin C levels and BMD of the spine and hip in Korean adults.
Methods: A cross-sectional study was performed in 865 Korean adults (325 men and 540 women) who participated in a comprehensive medical examination program and underwent bone densitometry. Renal function was assessed by the estimated glomerular filtration rate (eGFR), which was calculated using an equation based on creatinine (eGFRcre) and cystatin C (eGFRcys).
Results: The serum cystatin C level was negatively correlated with different types of BMD, including the lowest lumbar, total lumbar, femoral neck, and total femur BMD, in women, but not in men. Higher cystatin C levels were associated with a higher prevalence of osteoporosis in women (odds ratio [OR], 3.68; 95% confidence interval [CI], 1.69–8.03; P=0.001), but not in men (OR, 0.85; 95% CI, 0.30–2.38; P=0.761). However, this association was attenuated in the multivariable model adjusted for age, body mass index, serum 25-hydroxyvitamin D3, and creatinine (OR, 1.01; 95% CI, 0.38–2.71) in women. In addition, the eGFRcys showed a stronger positive correlation with BMD than the eGFRcre.
Conclusion: Our findings suggest that serum cystatin C levels might help identify women with osteoporosis who are susceptible to fractures.
Keywords: cystatin C, bone density, osteoporosis, glomerular filtration rate
Plain language summary
Osteoporosis, a skeletal condition causing an increased risk of fractures, is becoming more prevalent due to the recent global expansion of the aging population. Osteoporosis and osteoporotic fractures are serious public health threats resulting in high morbidity and mortality. Osteoporosis is diagnosed by measuring bone mineral density (BMD), which is the best predictor of primary osteoporotic fractures. Cystatin C is an endogenous protein that reflects renal function. A decline of renal function is associated with high risk of fractures. An association between high serum cystatin C levels and increased risk of fractures was found in several studies. Therefore, we aimed to evaluate the association between serum cystatin C levels and BMD in Korean adults. We evaluated the BMD measurements of 865 Korean adults (325 men and 540 women) who participated in a comprehensive medical examination program. The serum cystatin C levels were negatively correlated with BMD in women, but not in men. Higher cystatin C levels were associated with a higher prevalence of osteoporosis in women, but not in men. Our findings suggest that serum cystatin C levels might help identify women with osteoporosis who are susceptible to fractures.
Introduction
Osteoporosis is a skeletal condition characterized by low bone mass, disrupted bone microarchitecture, and skeletal fragility, causing an increased risk of fractures.1 Age-related bone loss begins soon after the attainment of peak bone mass in adulthood, and continues until senescence.2 Osteoporosis and osteoporotic fractures are becoming more prevalent as a result of the recent global expansion of the aging population, and these health conditions are considered to be serious public health threats resulting in high morbidity and mortality.3,4 According to a report in 2014, the prevalence of osteoporosis in Korean adults aged >50 years was 10% in men and 35% in women.5 Osteoporosis is diagnosed by measuring bone mineral density (BMD), which is the best predictor of primary osteoporotic fractures.6
Cystatin C, an endogenous protein, is produced by all nucleated cells, filtered at the glomerulus, and reabsorbed and catabolized by the proximal tubule.7 Cystatin C has been proposed as a novel alternative marker of kidney function that allows earlier detection of renal impairment than serum creatinine.8 An association between high serum cystatin C levels and increased risk of hip9 and nonvertebral fractures10 has been observed in previous prospective studies in postmenopausal Caucasian women. In another study in older adults, a high cystatin C concentration was only significantly associated with hip fractures in women, while the magnitude of the relationship appeared similar among women and men.11 However, few researchers have evaluated the association between serum cystatin C, an indicator of early reduced kidney function, and BMD, especially in the Asian population. Therefore, the aim of this study was to evaluate the association of serum cystatin C with BMD in Korean adults.
Methods
Subjects
This is a cross-sectional study and, among a total of 5,458 Korean adults who had a medical checkup at Pusan National University Yangsan Hospital in Korea in 2013, we evaluated data from 1,360 adults aged ≥20 years who underwent bone densitometry. We excluded subjects with active liver disease (serum aspartate aminotransferase or alanine aminotransferase levels greater than three times the upper limit of the reference range; n=19), abnormal serum thyroid-stimulating hormone levels (<0.27 μIU/mL or >4.2 μIU/mL; n=473), or elevated high-sensitivity C-reactive protein levels (>10.0 mg/L; n=3). A total of 865 adults (325 men and 540 women) were included in the study.
Informed consent for the use of the health screening data for the research was obtained from all subjects included in this study at the time of participating in the medical checkup program. This study was approved by the Institutional Review Board of Pusan National University Yangsan Hospital.
Anthropometric and biochemical data
Height (cm) and weight (kg) were measured to the nearest 0.1 cm and 0.1 kg, respectively, with the subjects wearing light clothing and barefooted. The body mass index (BMI) was calculated as the ratio of weight to height squared. Serum 25-hydroxyvitamin D3 (25(OH)D3) levels were measured using a chemiluminescent immunoassay (Liaison; DiaSorin, Saluggia, Italy). Serum creatinine (Jaffe’s kinetic assay) levels were measured using an auto-analyzer and enzymatic colorimetric method (Hitachi 7600; Hitachi Ltd., Tokyo, Japan). The serum cystatin C level was measured by the latex agglutination test (Modular P800; Roche Diagnostics, Indianapolis, IN, USA).
BMD of the lumbar spine, total femur, and femoral neck was measured by dual-energy X-ray absorptiometry with DISCOVERY-W fan-beam densitometer (Hologic Inc., Marlborough, MA, USA) using the APEX software (release 3.3; Hologic Inc.). According to the measured BMD and the World Health Organization criteria, T-scores ≥–1.0, between <−1.0 and >−2.5, and <−2.5 indicated normal, osteopenia, and osteoporosis, respectively.1
The estimated glomerular filtration rate (eGFR) was calculated using equations developed by the Chronic Kidney Disease Epidemiology Collaboration (CKD-EPI). The eGFR based on creatinine (eGFRcre) and cystatin C (eGFRcys) was computed using the CKD-EPI creatinine 200912,13 and cystatin C 201212,14 equations, respectively.
Statistical analysis
Data are expressed as mean ± SD for continuous variables. The subjects were divided into three groups based on their T-scores (ie, normal, osteopenia, and osteoporosis). The subjects were further categorized into four groups according to quartiles of serum cystatin C distribution: first (<0.9 mg/L), second (0.9 mg/L), third (1.0 mg/L), and fourth (≥1.1 mg/L) in men; and first (<0.8 mg/L), second (0.8 mg/L), third (0.9 mg/L), and fourth (≥1.0 mg/L) in women. The mean levels of continuous variables were compared using one-way analysis of variance with a post hoc Student–Newman–Keuls test. The bivariate correlation analyses between BMD and variables were performed using Pearson correlation analysis. Categorical variables were compared using chi-square test. Finally, the odds ratios (ORs) and corresponding 95% confidence intervals (CIs) of the group with the highest serum cystatin C levels (fourth) were calculated as an estimate of the relative osteoporosis risk compared to the lowest group (first; reference category) using multiple logistic regression analyses consisting of the unadjusted and multivariable-adjusted (age, BMI, 25(OH)D3, and creatinine) models. Statistical analyses were performed using SPSS version 18.0 (SPSS Inc., Chicago, IL, USA). All tests for statistical significance were two-tailed, and P-values <0.05 were considered significant.
Results
The mean serum cystatin C level was 0.99±0.21 mg/L and 0.87±0.16 mg/L in men and women, respectively. Osteopenia was diagnosed in 159 men (48.9%) and 263 women (48.7%). Osteoporosis was diagnosed in 46 men (14.1%) and 135 women (25.0%). Osteopenia and osteoporosis were more likely to be observed in older men and women and in men with a low BMI (Table 1).
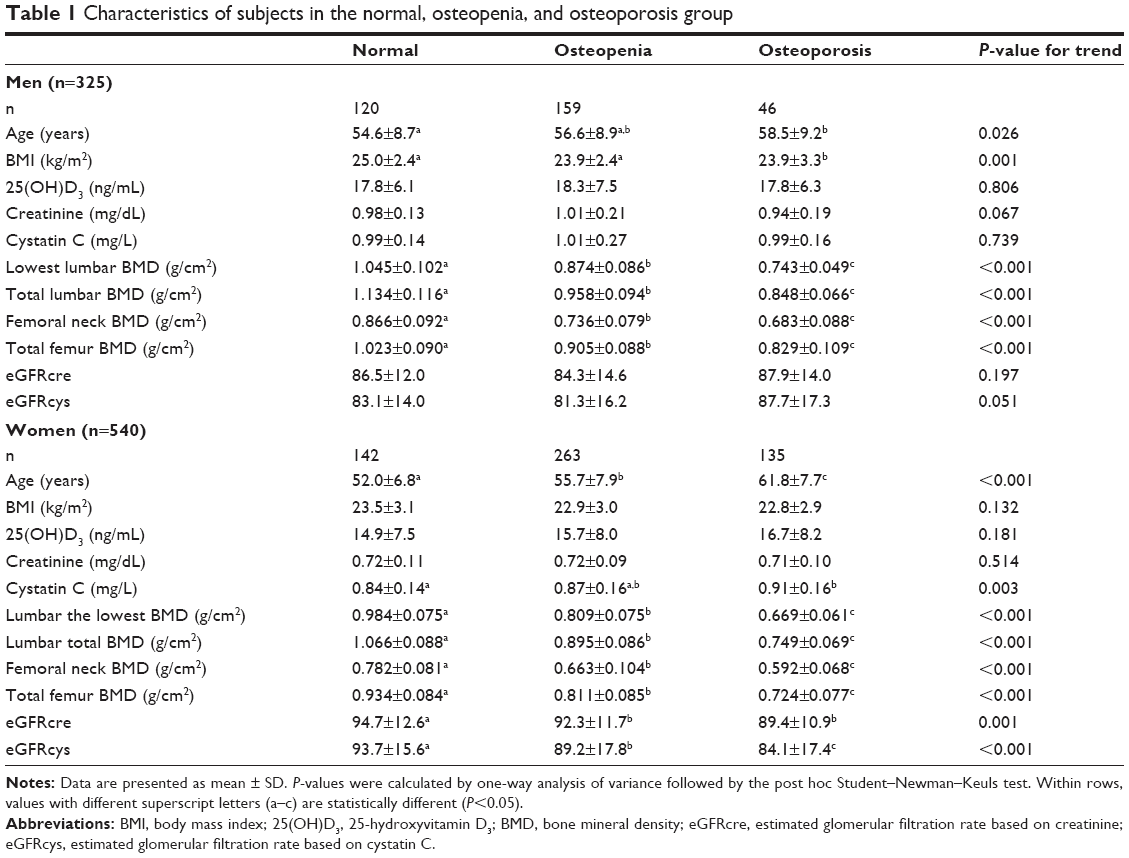 | Table 1 Characteristics of subjects in the normal, osteopenia, and osteoporosis group |
Serum cystatin C levels in women with osteopenia and osteoporosis were significantly increased compared to subjects with normal T-scores (0.87±0.16 mg/L in osteopenia and 0.91±0.16 mg/L in osteoporosis vs 0.84±0.14 mg/L in subjects with normal T-scores, P=0.003). There were no significant differences in creatinine levels among groups. The eGFRcys and eGFRcre were significantly decreased in those with osteopenia and osteoporosis compared to those with normal T-scores. Moreover, the eGFRcys was also significantly decreased in subjects with osteoporosis compared to that of subjects with osteopenia, but there was no significant difference in the eGFRcre between groups. There were no significant differences in cystatin C levels, creatinine levels, eGFRcys, and eGFRcre among groups in men (Table 1).
In the correlation analyses, BMI had significant positive associations with all BMDs in both sexes. Age had significant negative associations with all BMDs in women. In men, there were only significant, but weak, negative associations between femoral neck and total femur BMDs and age (Table 2). The eGFRcys and eGFRcre had significant positive correlations with all BMDs in women, and the eGFRcys was more strongly correlated than the eGFRcre with all BMDs in women. However, there were no significant associations between the eGFRcys or eGFRcre and BMDs in men (Table 2).
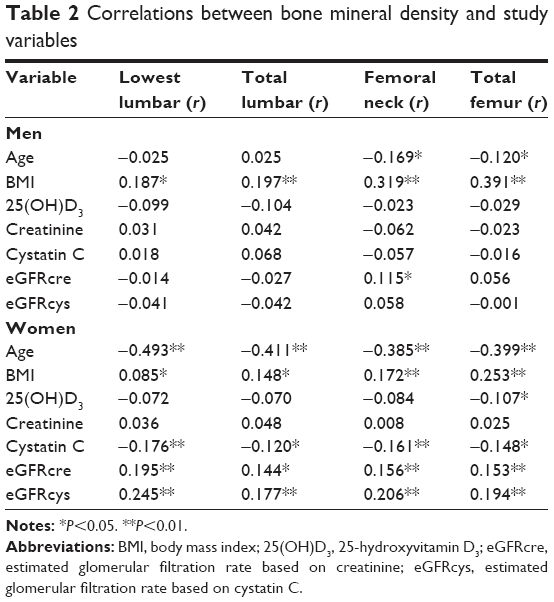 | Table 2 Correlations between bone mineral density and study variables |
Age, BMI, and creatinine levels were significantly increased with an increase in the serum cystatin C levels in women. In women, all BMDs were significantly decreased with an increase in the serum cystatin C levels (Table 3). In men, age and creatinine levels were significantly increased with an increase in the serum cystatin C levels. There were no significant differences in all BMDs with an increase in the serum cystatin C levels in men (Table 3).
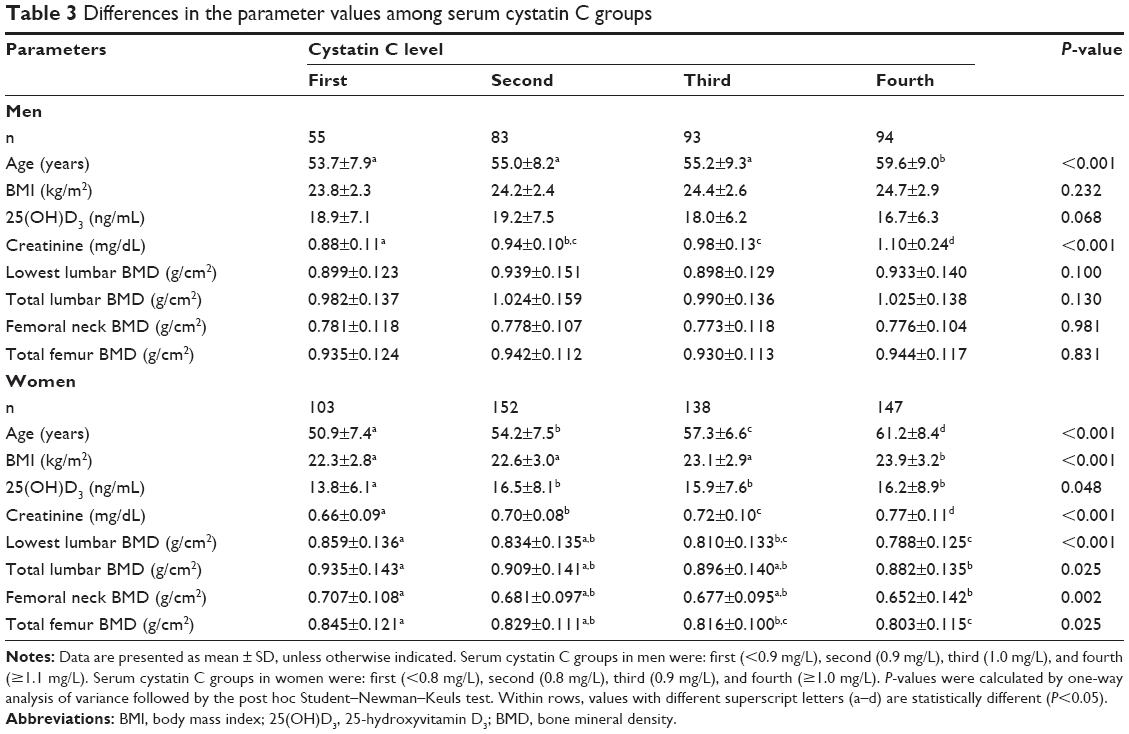 | Table 3 Differences in the parameter values among serum cystatin C groups |
In men, there were no significant differences in the prevalence of osteopenia with increasing serum cystatin C levels (first, 50.9%; second, 53.0%; third, 49.5%; and fourth, 43.6%). However, the prevalence of osteopenia showed increasing trends in women (first, 53.4%; second, 44.1%; third, 48.6%; and fourth, 50.3%; Figure 1A). In men, there were no significant differences in the prevalence of osteoporosis with increasing serum cystatin C levels (first, 14.5%; second, 10.8%; third, 16.1%; and fourth, 14.9%). However, the prevalence of osteoporosis was significantly increased in women with the highest serum cystatin C levels (first, 13.6%; second, 26.3%; third, 26.8%; and fourth, 29.9%; P<0.05) compared to women with the lowest serum cystatin C levels (Figure 1B).
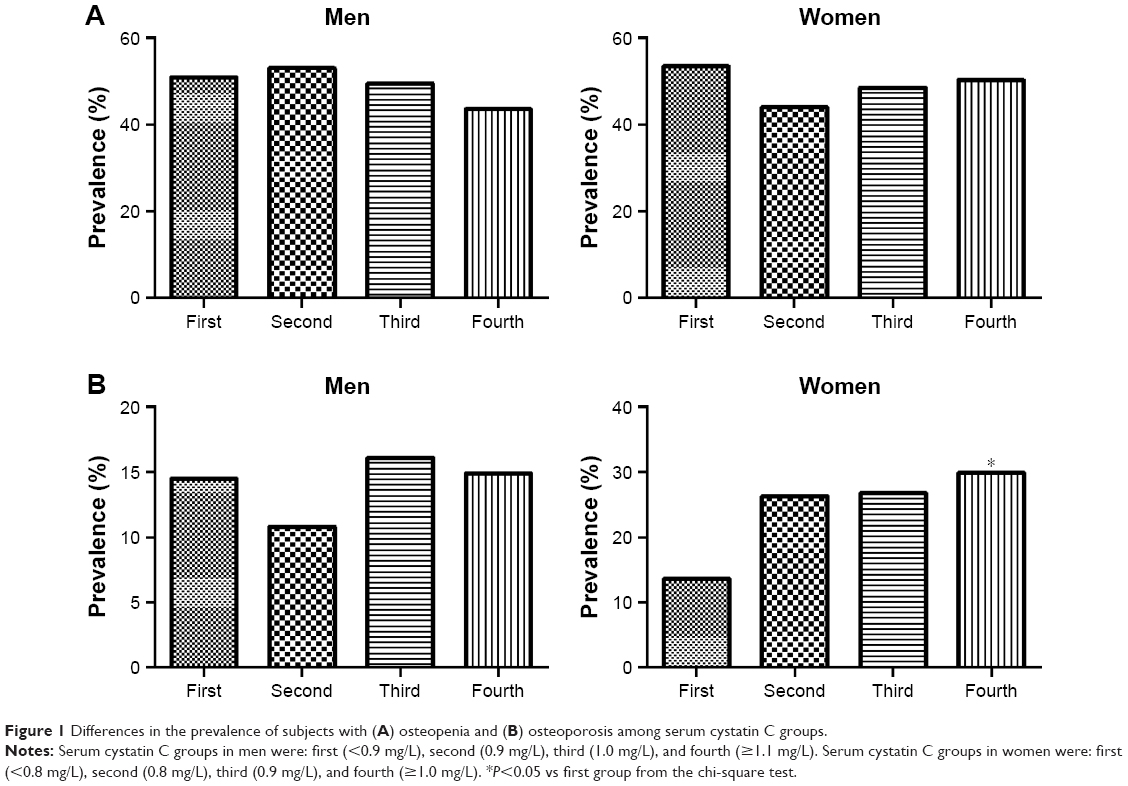 | Figure 1 Differences in the prevalence of subjects with (A) osteopenia and (B) osteoporosis among serum cystatin C groups. |
When stratified by sex, there was no significant increase in the relative risk of osteoporosis in subjects with the highest cystatin C levels compared to those with the lowest cystatin C levels in all logistic regression models in men. However, in women, there was a significant increase in the OR of the unadjusted model (OR, 3.68; 95% CI, 1.69–8.03; P=0.001), although it was attenuated and not significant in the multivariable model adjusted for age, BMI, 25(OH)D3, and creatinine (OR, 1.01; 95% CI, 0.38–2.71; Table 4).
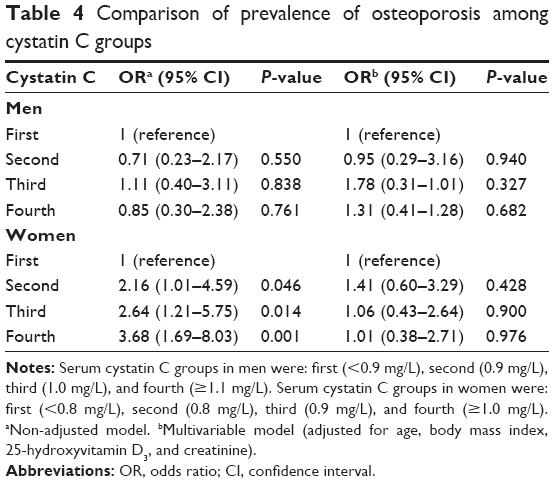 | Table 4 Comparison of prevalence of osteoporosis among cystatin C groups |
Discussion
In this study, we investigated the correlation between serum cystatin C levels and BMD in healthy Korean adults. In women, there was an inverse association between serum cystatin C levels and lumbar spine and femur BMD, and a linear increase in the prevalence of osteoporosis across increasing quartiles of cystatin C levels. However, this association became no longer significant in the multivariable model. Additionally, the eGFRcys showed a stronger positive correlation with BMD than the eGFRcre. In contrast to women, no significant relationships between cystatin C levels or the eGFRcre and BMD were identified in men.
There have been several studies investigating the association between cystatin C levels and the risk of fractures. However, studies that have included direct measures of BMD are very limited, and there have been reports of quite controversial results based on sex and the type of BMD. In a cross-sectional analysis in the Cardiovascular Health Study, an inverse association between cystatin C levels and initial total hip BMD was observed in both men and women. Cystatin C levels were associated with bone loss in men, but not women, after adjusting for confounding factors.15 Fried et al11 revealed an increased risk of hip fracture in older adults with higher cystatin C levels, which was no longer significant in men after adjusting for age and other clinical risk factors; however, BMD data were not available in this previous study. In a case-cohort study by Ensrud et al,16 old men with high cystatin C levels (ie, low eGFRcys, not eGFRcre) had an increased risk of hip fractures, but the relationship was attenuated and not significant after adjusting for clinical risk factors and BMD. In another cross-sectional analysis in the Osteoporotic Fractures in Men Study, no differences were observed in baseline hip BMD by quartiles of cystatin C concentration; however, a significant linear decline in the total hip BMD across increasing quartiles of cystatin C concentrations was found after a 4.4-year follow-up in the multivariable analysis.17 In the nested case-cohort analysis in the Study of Osteoporotic Fractures, the researchers found that higher cystatin C levels were associated with an increased risk of hip fracture in older women, independent of classic risk factors.18 Recently, Fujita et al19 reported an inverse association between the eGFR and BMD, and a similar, but weaker, association between cystatin C levels and lumbar spine BMD, but not between cystatin C levels and hip BMD in community-dwelling elderly Japanese men.
These discrepancies in the findings regarding the association between cystatin C levels and BMD in men and women may exist for several reasons. Firstly, osteoporosis is generally thought of as a “female disease” primarily affecting postmenopausal women. Furthermore, the number of men included in our study was relatively smaller than that of women resulting in limited statistical power, which may have influenced the prevalence of osteoporosis and the inconsistent patterns of cystatin C levels, eGFRcre, and eGFRcys according to BMD status in men. Secondly, men showed higher 25(OH)D3 levels, BMI, and BMD in all aspects (including lowest lumbar, total lumbar, femoral neck, and total femur) than women in the normal, osteopenia, and osteoporosis groups, which may have weakened the association of cystatin C levels and BMD. Finally, the difference in the effect of kidney function on BMD and a higher competing risk of mortality between sexes may have also affected the null result in men.
In women, one of the possible explanations for the insignificant association between cystatin C levels and risk of osteoporosis in the multivariable analysis is that most subjects were healthy without severe chronic kidney disease (CKD). In our study, there were consistent trends for a positive association between cystatin C levels and BMD; therefore, significant trends might have been observed if more subjects were included. On the other hand, BMI had significant positive associations with all BMDs in both sexes, and age had significant negative associations with all BMDs in women (Table 2). Furthermore, age and BMI levels were significantly increased with an increase in the serum cystatin C levels in women (Table 3). Therefore, age and BMI, as potential confounders, might account for some of the insignificant associations between cystatin C levels and risk of osteoporosis in the multiple regression analysis.
In this study, few subjects had mild-to-moderate renal dysfunction shown by an eGFRcys <60 mL/min/1.73 m2. However, the eGFRcys was more strongly correlated with BMD than the eGFRcre in women, which corresponded to findings from previous studies. In the nested case–control Women’s Health Initiative Observational Study, renal dysfunction, as manifested by a lower eGFRcys, was more strongly associated with BMD than the eGFRcre.9 In another cohort study, cystatin C was found to be a prognostic biomarker for the risk of CKD, cardiovascular events, and mortality in older adults with a lower eGFRcys and preserved eGFRcre.20 More recently, Ensrud et al18 found a positive correlation between cystatin C and risk of hip fractures in older women, which remained significant even after subjects with CKD, as determined by an eGFRcre of <60 mL/min/1.73 m2, were excluded from the analysis. Collectively, these findings suggest that cystatin C may identify a “preclinical” renal dysfunction followed by clinical CKD and adverse health consequences that is not detected with the eGFRcre.
We calculated the eGFR by both cystatin C-based and creatinine-based CKD-EPI equations to estimate renal function. The first and most commonly used eGFR equation is the Modification of Diet in Renal Disease (MDRD) equation, which uses serum creatinine to measure renal function. Age-related muscle loss results in lower creatinine production, and the MDRD equation was formulated in a clinical trial involving subjects with CKD; therefore, the MDRD equation may not be an appropriate marker of renal function in healthy older adults, such as the subjects in the present study.21,22 In contrast, serum cystatin C levels are independent of muscle mass and show a stronger correlation with direct GFR measurements than creatinine-based eGFR.23,24 The recently developed CKD-EPI equation can be calculated using serum cystatin C, creatinine, or both, and cystatin C is less dependent on muscle mass.12,14 Therefore, the eGFRcys calculated using the CKD-EPI formula is considered to be superior to the eGFRcre, especially in community-dwelling populations with mild-to-moderate kidney dysfunction.19 On the other hand, the CKD-EPI equation provides a higher estimation of eGFR with a less bias than the MDRD equation in general. However, the differences in the eGFR estimates between these two equations diminish in the elderly aged >70 years. Furthermore, in a population study among the very elderly (50 centenarians), the eGFR calculated using the MDRD equation was even higher than the eGFR calculated using the CKD-EPI equation, which suggests both equations can be used in centenarians.25
There are several possible mechanisms that may underlie the positive relationship between cystatin C levels and increased fracture risk in older adults.18 Firstly, 1,25-dihydroxyvitamin D synthesis is decreased even in mild renal impairment, leading to reduced calcium absorption, secondary hyperparathyroidism, bone loss, and consequently, fracture.26,27 Secondly, there has been an association between moderate renal dysfunction and higher concentrations of homocysteine and proinflammatory cytokines.28,29 In a prospective cohort study by Cauley et al,30 higher levels of proinflammatory cytokines have been linked to an increased risk of fractures in older adults; however, the effect of renal function was not investigated. Recent researchers have reported that osteoporotic fractures in older adults had strong correlation with higher homocysteine levels, which increased as renal function declined.31,32 Finally, high cystatin C levels could be a marker of comorbidity and frailty leading to increased risk of falls and fractures.20
This study has several strengths. We used both cystatin C- and creatinine-based GFR equations for accurately assessing renal function. High-quality direct measurements of BMD, both in lumbar spine and femur, were included in this study. Although cystatin C levels were shown to be related to the risk of hip or nonvertebral fractures in a few studies, this is the first study, to the best of our knowledge, in which the association between cystatin C levels and BMD, especially in Asian men and women, was evaluated.
The present study has several limitations. Firstly, it was conducted using a cross-sectional design and, therefore, we could not determine a causal relationship between cystatin C levels and BMD, and the total number of enrolled men and women was relatively small. This limitation may have affected our results that showed no statistical correlation between cystatin C levels and BMD after adjusting for multiple confounding factors. Secondly, we could not analyze past medical history, including any previous fractures, social data (ie, exercise, diet, and smoking), and medication use in both sexes, which may affect the incidence of osteoporosis. Lastly, the seasonal variations in serum vitamin D or menopausal status and estrogen level in women were not considered, which could have influenced the mean 25(OH)D3 levels in subjects.
In conclusion, we demonstrated an inverse association of serum cystatin C levels with lumbar spine and femur BMD, and a linear increase in the prevalence of osteoporosis with increasing cystatin C levels in Korean women, but not in men. Furthermore, the eGFRcys showed a stronger positive correlation with BMD than the eGFRcre. Based on our findings, the eGFRcys may be a prognostic biomarker when evaluating the association between renal function and fracture risk, especially in older adults with mild-to-moderate kidney function. Additional large-scale prospective studies are required to confirm the causal relationship of cystatin C levels with BMD and risk of fractures, and whether measurement of cystatin C levels can provide further prognostic information for recognizing older adults with high fracture risk.
Disclosure
The authors report no conflicts of interest in this work.
References
World Health Organization. Assessment of fracture risk and its application to screening for postmenopausal osteoporosis. Report of a WHO Study Group. World Health Organ Tech Rep Ser. 1994;843:1–129. | ||
Chang KP, Center JR, Nguyen TV, Eisman JA. Incidence of hip and other osteoporotic fractures in elderly men and women: Dubbo Osteoporosis Epidemiology Study. J Bone Miner Res. 2004;19(4):532–536. | ||
Johnell O, Kanis JA. An estimate of the worldwide prevalence and disability associated with osteoporotic fractures. Osteoporos Int. 2006;17(12):1726–1733. | ||
Gullberg B, Johnell O, Kanis JA. World-wide projections for hip fracture. Osteoporos Int. 1997;7(5):407–413. | ||
Korean Endocrine Society. Osteoporosis fact sheet 2014 [cited October 10, 2017]. Available from: http://www.endocrinology.or.kr/image/main/eng_Osteoporosis_Fact_Sheet2014.pdf. Accessed October 13, 2017. | ||
Kanis JA, Borgstrom F, De Laet C, et al. Assessment of fracture risk. Osteoporos Int. 2005;16(6):581–589. | ||
Filler G, Bokenkamp A, Hofmann W, Le Bricon T, Martinez-Bru C, Grubb A. Cystatin C as a marker of GFR – history, indications, and future research. Clin Biochem. 2005;38(1):1–8. | ||
Coll E, Botey A, Alvarez L, et al. Serum cystatin C as a new marker for noninvasive estimation of glomerular filtration rate and as a marker for early renal impairment. Am J Kidney Dis. 2000;36(1):29–34. | ||
LaCroix AZ, Lee JS, Wu L, et al. Cystatin-C, renal function, and incidence of hip fracture in postmenopausal women. J Am Geriatr Soc. 2008;56(8):1434–1441. | ||
Ensrud KE, Barbour K, Canales MT, et al. Renal function and nonvertebral fracture risk in multiethnic women: the Women’s Health Initiative (WHI). Osteoporos Int. 2012;23(3):887–899. | ||
Fried LF, Biggs ML, Shlipak MG, et al. Association of kidney function with incident hip fracture in older adults. J Am Soc Nephrol. 2007;18(1):282–286. | ||
Inker LA, Schmid CH, Tighiouart H, et al. Estimating glomerular filtration rate from serum creatinine and cystatin C. N Engl J Med. 2012;367(1):20–29. | ||
Levey AS, Stevens LA, Schmid CH, et al. A new equation to estimate glomerular filtration rate. Ann Intern Med. 2009;150(9):604–612. | ||
Stevens LA, Coresh J, Schmid CH, et al. Estimating GFR using serum cystatin C alone and in combination with serum creatinine: a pooled analysis of 3,418 individuals with CKD. Am J Kidney Dis. 2008;51(3):395–406. | ||
Fried LF, Shlipak MG, Stehman-Breen C, et al. Kidney function predicts the rate of bone loss in older individuals: the Cardiovascular Health Study. J Gerontol A Biol Sci Med Sci. 2006;61(7):743–748. | ||
Ensrud KE, Lui LY, Taylor BC, et al. Renal function and risk of hip and vertebral fractures in older women. Arch Intern Med. 2007;167(2):133–139. | ||
Ishani A, Paudel M, Taylor BC, et al. Renal function and rate of hip bone loss in older men: the Osteoporotic Fractures in Men Study. Osteoporos Int. 2008;19(11):1549–1556. | ||
Ensrud KE, Parimi N, Cauley JA, et al. Cystatin C and risk of hip fractures in older women. J Bone Miner Res. 2013;28(6):1275–1282. | ||
Fujita Y, Iki M, Tamaki J, et al. Renal function and bone mineral density in community-dwelling elderly Japanese men: the Fujiwara-kyo Osteoporosis Risk in Men (FORMEN) Study. Bone. 2013;56(1):61–66. | ||
Odden MC, Chertow GM, Fried LF, et al. Cystatin C and measures of physical function in elderly adults: the Health, Aging, and Body Composition (HABC) Study. Am J Epidemiol. 2006;164(12):1180–1189. | ||
Beck GJ, Berg RL, Coggins CH, et al. Design and statistical issues of the Modification of Diet in Renal Disease Trial. The Modification of Diet in Renal Disease Study Group. Control Clin Trials. 1991;12(5):566–586. | ||
Rule AD, Larson TS, Bergstralh EJ, Slezak JM, Jacobsen SJ, Cosio FG. Using serum creatinine to estimate glomerular filtration rate: accuracy in good health and in chronic kidney disease. Ann Intern Med. 2004;141(12):929–937. | ||
Baxmann AC, Ahmed MS, Marques NC, et al. Influence of muscle mass and physical activity on serum and urinary creatinine and serum cystatin C. Clin J Am Soc Nephrol. 2008;3(2):348–354. | ||
Hoek FJ, Kemperman FA, Krediet RT. A comparison between cystatin C, plasma creatinine and the Cockcroft and Gault formula for the estimation of glomerular filtration rate. Nephrol Dial Transplant. 2003;18(10):2024–2031. | ||
Basile G, Crucitti A, Fusco S, et al. Estimating glomerular filtration rate in centenarians: comparison of the chronic kidney disease epidemiology collaboration (CKD-EPI) and modification of diet in renal disease (MDRD) study equations. Int Urol Nephrol. 2014;46(2):481–482. | ||
Francis RM, Peacock M, Barkworth SA. Renal impairment and its effects on calcium metabolism in elderly women. Age Ageing. 1984;13(1):14–20. | ||
Vieth R, Ladak Y, Walfish PG. Age-related changes in the 25-hydroxyvitamin D versus parathyroid hormone relationship suggest a different reason why older adults require more vitamin D. J Clin Endocrinol Metab. 2003;88(1):185–191. | ||
Francis ME, Eggers PW, Hostetter TH, Briggs JP. Association between serum homocysteine and markers of impaired kidney function in adults in the United States. Kidney Int. 2004;66(1):303–312. | ||
Shlipak MG, Fried LF, Crump C, et al. Elevations of inflammatory and procoagulant biomarkers in elderly persons with renal insufficiency. Circulation. 2003;107(1):87–92. | ||
Cauley JA, Danielson ME, Boudreau RM, et al. Inflammatory markers and incident fracture risk in older men and women: the Health Aging and Body Composition Study. J Bone Miner Res. 2007;22(7):1088–1095. | ||
van Meurs JB, Dhonukshe-Rutten RA, Pluijm SM, et al. Homocysteine levels and the risk of osteoporotic fracture. N Engl J Med. 2004;350(20):2033–2041. | ||
McLean RR, Jacques PF, Selhub J, et al. Homocysteine as a predictive factor for hip fracture in older persons. N Engl J Med. 2004;350(20):2042–2049. |
 © 2017 The Author(s). This work is published and licensed by Dove Medical Press Limited. The full terms of this license are available at https://www.dovepress.com/terms.php and incorporate the Creative Commons Attribution - Non Commercial (unported, v3.0) License.
By accessing the work you hereby accept the Terms. Non-commercial uses of the work are permitted without any further permission from Dove Medical Press Limited, provided the work is properly attributed. For permission for commercial use of this work, please see paragraphs 4.2 and 5 of our Terms.
© 2017 The Author(s). This work is published and licensed by Dove Medical Press Limited. The full terms of this license are available at https://www.dovepress.com/terms.php and incorporate the Creative Commons Attribution - Non Commercial (unported, v3.0) License.
By accessing the work you hereby accept the Terms. Non-commercial uses of the work are permitted without any further permission from Dove Medical Press Limited, provided the work is properly attributed. For permission for commercial use of this work, please see paragraphs 4.2 and 5 of our Terms.