")
Back to Journals » Diabetes, Metabolic Syndrome and Obesity » Volume 11
Association between polymorphisms in SLC15A1 and PLA2G16 genes and development of obesity in Chinese subjects
Authors Wang CY, Liu S, Xie XN, Luo ZY, Yang L, Tan ZR
Received 7 January 2018
Accepted for publication 7 May 2018
Published 22 August 2018 Volume 2018:11 Pages 439—446
DOI https://doi.org/10.2147/DMSO.S161808
Checked for plagiarism Yes
Review by Single anonymous peer review
Peer reviewer comments 3
Editor who approved publication: Professor Ming-Hui Zou
Chun-Yang Wang,1,2 Shu Liu,1,2 Xiao-Nv Xie,1,2 Zhi-Ying Luo,1,2 Li Yang,1,2 Zhi-Rong Tan1,2
1Department of Clinical Pharmacology, Xiangya Hospital, Central South University, Changsha 410008, People’s Republic of China; 2Department of Clinical Pharmacology, Institute of Clinical Pharmacology, Central South University; Hunan Key Laboratory of Pharmacogenetics, Changsha 410078, People’s Republic of China
Introduction: The small peptide transporter 1 (PepT-1) and adipose phospholipase A2 (AdPLA) play a key role in the development of obesity. However, there are no data assessing the impact of PepT-1 (SLC15A1) and AdPLA (PLA2G16) variants on obesity susceptibility. Therefore, we assessed the contribution of 9 single-nucleotide polymorphisms (SNPs) between these two genes on obesity susceptibility in Chinese subjects.
Materials and methods: A total of 611 participants were enrolled in the study, and 9 SNPs in the SLC15A1 and PLA2G16 genes were selected. Blood samples were collected for genotyping. Overweight and obesity were established by body mass index. Regression analyses were performed to test for any association of genetic polymorphisms with weight abnormality.
Results: The genotype frequencies (P=0.04 for rs9557029, P=0.027 for rs1289389) were significantly different between obese or overweight subjects and healthy controls. However, no significant difference in allele was found between these three groups (P>0.05). Further logistic regression analyses adjusted for age and sex also failed to reveal significant associations between overweight, obesity, and the selected SNPs (P>0.05).
Conclusion: Data indicate that the selected 9 SNPs in SLC15A1 and PLA2G16 genes were not related to obesity susceptibility in the Han Chinese population.
Keywords: obesity, BMI, Chinese subjects, genotyping, SNPs
Introduction
Obesity is considered a chronic metabolic disease associated with the development of complications such as non-insulin-dependent diabetes mellitus, cardiovascular diseases, hypertension and dyslipidemia, chronic inflammation, and certain types of cancer.1–4 Data from Global Burden of Disease 2013 Study show that from 1980 to 2013 the number of overweight and obese individuals increased from 921 million to 2.1 billion.5 In addition, the World Health Organization reported that in 2014, almost 41 million children younger than 5 years were overweight or obese.6 Furthermore, it is estimated that the absolute numbers could rise to 2.16 billion overweight individuals and 1.12 billion obese individuals, or 38% and 20% of the world’s adult population, respectively.7 Therefore, greater attention and proactive measures are needed to prevent the tide.8
Obesity is the result of a positive energy balance, whereby energy intake exceeds expenditure.1 Factors favoring the positive energy balance include not only environmental factors but also individual factors. The environmenal factors include increasing per capita food supplies and consumption and decreasing of physical activity, which result in storage of energy finally, primarily as lipids in white adipose. The individual factors include genetic, neuropsychiatric, epigenetic, and metagenomic factors, which can lead to lipid metabolism disorders.9,10 Since the first comprehensive genome-wide association study reported an association between fat mass and obesity-associated protein (FTO) gene, numerous follow-up studies have been performed on independent cohorts, and increasing number of single-nucleotide polymorphisms (SNPs) associated with obesity susceptibility is being discovered.11 It is noteworthy that these SNPs are mainly located in or near genes such as FTO, TMEM18, LEP, LEPR, GNPDA2, NEGR1, and BDNF.12 Almost all of these genes are involved in a crucial center for appetite intake and energy balance.
Peptide transporter 1 (PepT-1) (SLC15A1) plays a crucial role in the absorption of small peptides which include not only over 400 different dipeptides and 8,000 tripeptides digested from dietary proteins.13–17 A previous research combining Genome-wide RNAi analysis with Nile Red fat assay revealed that RNAi of Caenorhabditis elegans fat regulatory gene whose mammalian homologue is SLC15A1 causing a reduction and disorganization of the fat deposition patterns.18 In addition, as we know, leptin-melanocortin pathway and LEPRb/JAK2/MAPK(ERK1/2) pathway are both key regulators of appetite, energy metabolism, food intake, neuroendocrine-function in human.13,15,16 Interestingly enough, studies revealed that SLC15A1 can be regulated by LEPRb/JAK2/MAPK(ERK1/2) pathway and then influence food intake and fat deposition.17,19 Moreover, many recent studies demonstrated that the absorption of small peptides can inhibit pathways of inflammation processes such as NF-κB, induce the production of iNOs and JNK, as well as inhibit obesity.20–24 However, in these studies, the underlying mechanisms of SLC15A1 in obesity remain controversial.
Adipose phospholipase A2 (AdPLA, PLA2G16) is a major regulator of adipocyte lipolysis and plays a surprisingly critical and dominant role in the development of obesity. Through animal experiments, Jaworski et al showed that AdPLA-null mice displayed a drastically reduced adipose tissue mass and triglyceride (TG) content compared with controls, and further confirmed the critical role of AdPLA in regulating adipocyte lipolysis and obesity formation. Additionally, they provided longer term evidence that AdPLA/PGE2/EP3/cAMP signaling pathway is important in the development of excess adipose tissue mass/TAG storage and obesity.25 Consistent with a previous study, AdPLA-defcient mice are resistant to adiposity, even fed a HFD(high-fat diet) or decreased leptin level.26–28 Subsequently, Ceddia et al investigated the effects of PGE2-EP3 signaling on diabetes in a setting of diet-induced obesity; in this study, they demonstrated that EP3(−/−) mice gain more weight when fed a high fat diet and adipocytes from EP3−/− mice lacked PGE2-evoked inhibition of isoproterenol stimulated lipolysis compared with EP3+/+ mice. Eventually, the role of PGE2-EP3 signaling in facilitating adipose tissue lipid accumulation by inhibiting lipolysis was confirmed. But they speculated that the increased obesity and overall adiposity in EP3−/− HFD-fed mice are due to a lack of EP3 signaling in nonadipose sites of action, in contrast to AdPLA−/− mice, which is not completely consistent with the findings from Jaworski et al. Meanwhile, a recent study also proposed that the secreted phospholipase A2 family (sPLA2) family played a distinct role in obesity due to its anti-inflammatory actions and highlighted the critical role of the sPLA2 family in lipoprotein hydrolysis and immunomodulation in the metabolic disorder process.29–31
In view of these pieces of evidence, we aim to examine whether polymorphisms in these two genes are associated with individual susceptibility to obesity and what are the differences between these three phenotypes in a Han Chinese cohort.
Materials and methods
Subjects
Sample size of subjects was calculated by power and sample size
According to the results of 1000 Genomes projects, the exposure of SNPs genetic we selected among controls are greater than or equal to 0.21. The true OR for obesity or overweight in exposed subjects relative to control subjects is 2. To reject the null hypothesis, the OR of samples in overweight/obesity and control groups equals to 1, the statistical power is 0.8. The Type I error probability associated with this test of this null hypothesis is 0.05. The results showed that we needed 167 obese subjects, 167 overweight subjects, and 167 controls in our study.
Six hundred and eleven adult subjects were recruited from the Xiangya Hospital physical examination center of Central South University (Changsha, People’s Republic of China) between March 2015 and September 2015 (Figure 1). Medical records were screened by specialist clinicians and dietitian nutritionists. Persons with diabetes, chronic illness like hypertension or other inflammatory pathology, or any autoimmune diseases as well as subjects using lipid-lowering agents were not included in this study. All these participants were genetically unrelated and at least 18 years old. The demographic and clinical data including sex, age, height, weight, body mass index (BMI), low-density lipoprotein (LDL-C), high-density lipoprotein (HDL-C), total cholesterol (TChol), TG, and fasting blood glucose (FBG) situation were recorded. BMI was categorized according to National Health and Family Planning Commission of the People’s Republic of China; Chinese adults with a BMI of 24–28 kg/m2 are considered to be overweight, while Chinese adults with a BMI equal to or more than 28 kg/m2 are considered obese (http://www.moh.gov.cn).
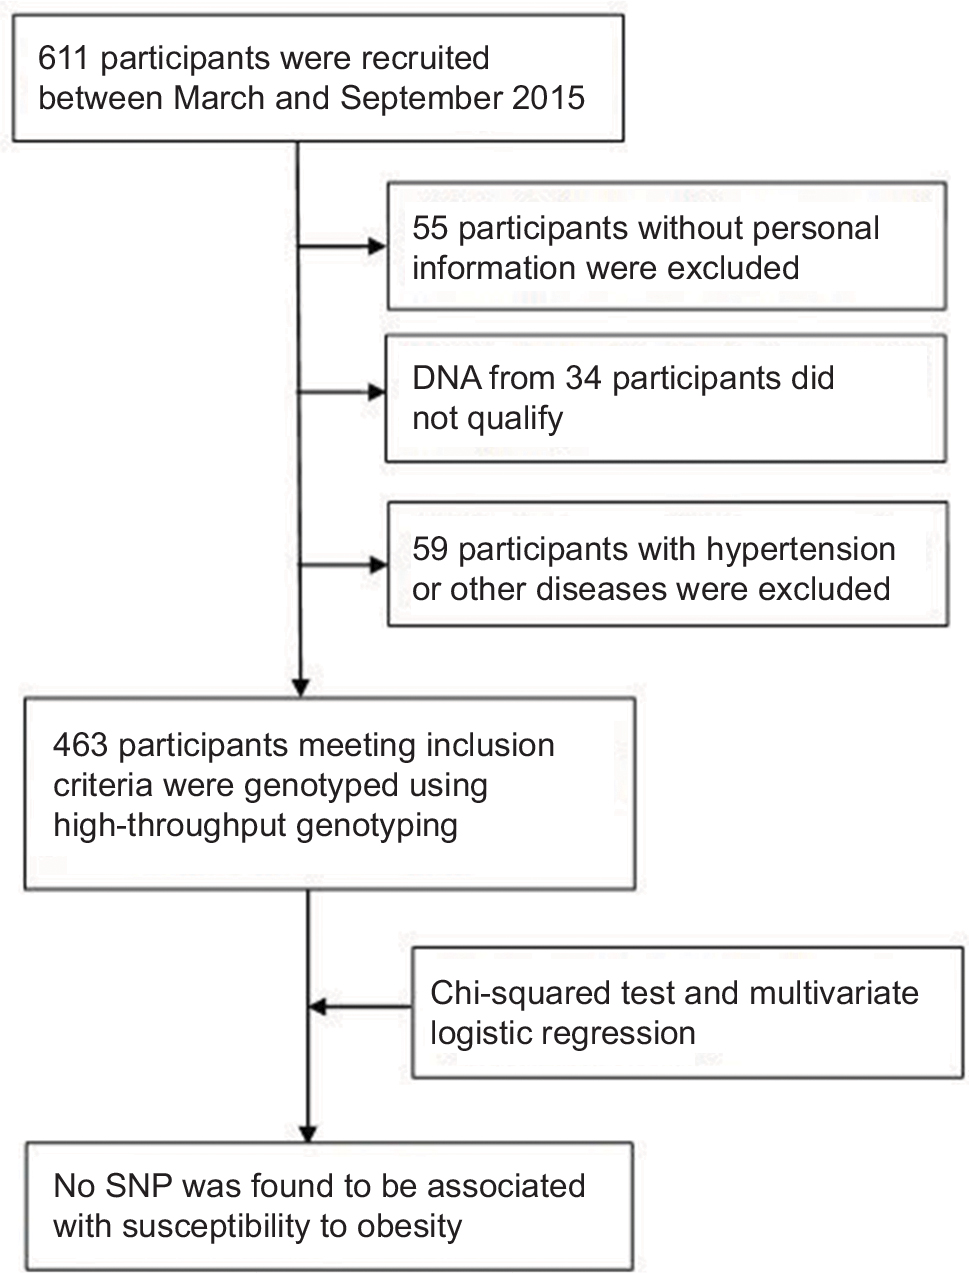 | Figure 1 Study flow chart. Abbreviation: SNP, single-nucleotide polymorphism. |
This study was approved by the Ethics Committee of the Institute of Clinical Pharmacology at Central South University with the registration number CTXY-150001-5 and was registered at the Chinese Clinical Trial Register with the registration number ChiCTR-OOB-15006350. In addition, prior to entering into the study, written informed consent was obtained from all the participants.
SNP selection, DNA extraction, and genotyping
According to the data from the HapMap, 1000 Genomes, and previous studies, we selected 9 SNPs with minor allele frequency >0.05 in the Chinese population: rs2297322, rs4646215, rs4646214, rs9557029, rs4646234, and rs1289389 in SLC15A1 gene and rs11231525, rs11600655, and rs3809073 in PLA2G16 gene (Table 1). Five milliliters of peripheral blood samples were collected from each study subject. Before extracting DNA, these blood samples were preserved at −80 °C. According to the operating instructions, genomic DNA was extracted from these samples using the Genomic DNA Purification Kit for mammalian blood (Promega Corporation, Fitchburg, WI, USA). Following this, these genomic DNAs were analyzed by agarose gel electrophoresis and stored at −20 °C until use. The DNA strip was single and clear without any impurity band, and there was no dispersion or tailing phenomenon. High-throughput genotyping of allele-specific primer extension products amplifying from genomic DNA sequences was performed using Sequenom Mass ARRAY system (Sequenom, San Diego, CA, USA). Mass ARRAY Assay Design 3.1 software (Sequenom) was used to design primers for these selected SNPs. Briefly, the procedures of genotyping include five main steps: 1) polymerase chain reaction (PCR) amplification. The PCR reaction systems were as follows: 1.8 μL dddH2O, 0.5 μL 10 × PCR buffer, 0.4 μL 25 mM MgCl2, 0.1 μL 25 mM dNTP, 0.2 μL Hotstar Taq, 1 μL PCR Primer mix, and 1 μL 20 ng/μL DNA in a total volume 5 μL. PCR was run at 95 °C for 2 min, thermocycling 45 cycles (95 °C for 30 s, 56 °C for 30 s, 72 °C for 60 s), extension at 72 °C for 5 min; 2) shrimp alkaline phosphatase (SAP) treatment. The PCR reaction systems were as follows: 1.53 μL dddH2O, 0.17 μL SAP buffer and 0.3 μL SAP enzyme in a final volume of 2 μL. The conditions were 37 °C for 40 min and 85 °C for 5 min; 3) extension reaction. The reaction systems were as follows: 0.619 μL dddH2O, 0.2 μL iPLEX buffer plus, 0.2 μL iPLEX termination mix, 0.94 μL iPLEX extend primer mix, 0.041 μL iPLEX enzyme, 2 μL SAP reagent, and 5 μL PCR reagent in a final volume of 9 μL. The conditions were 94°C for 30 s, 94°C for 5 s, 40 cycles of 52°C for 5 s, 5 cycles of 80°C for 5 s, and 72°C for 3 min; 4) resin purification; 5) fragment analysis. Genotyping was performed by an investigator blinded to the sample status, positive and negative controls as well as duplicate samples were included to confirm the exactitude of genotyping. Furthermore, for quality control, randomly selected samples were chosen to direct sequencing.
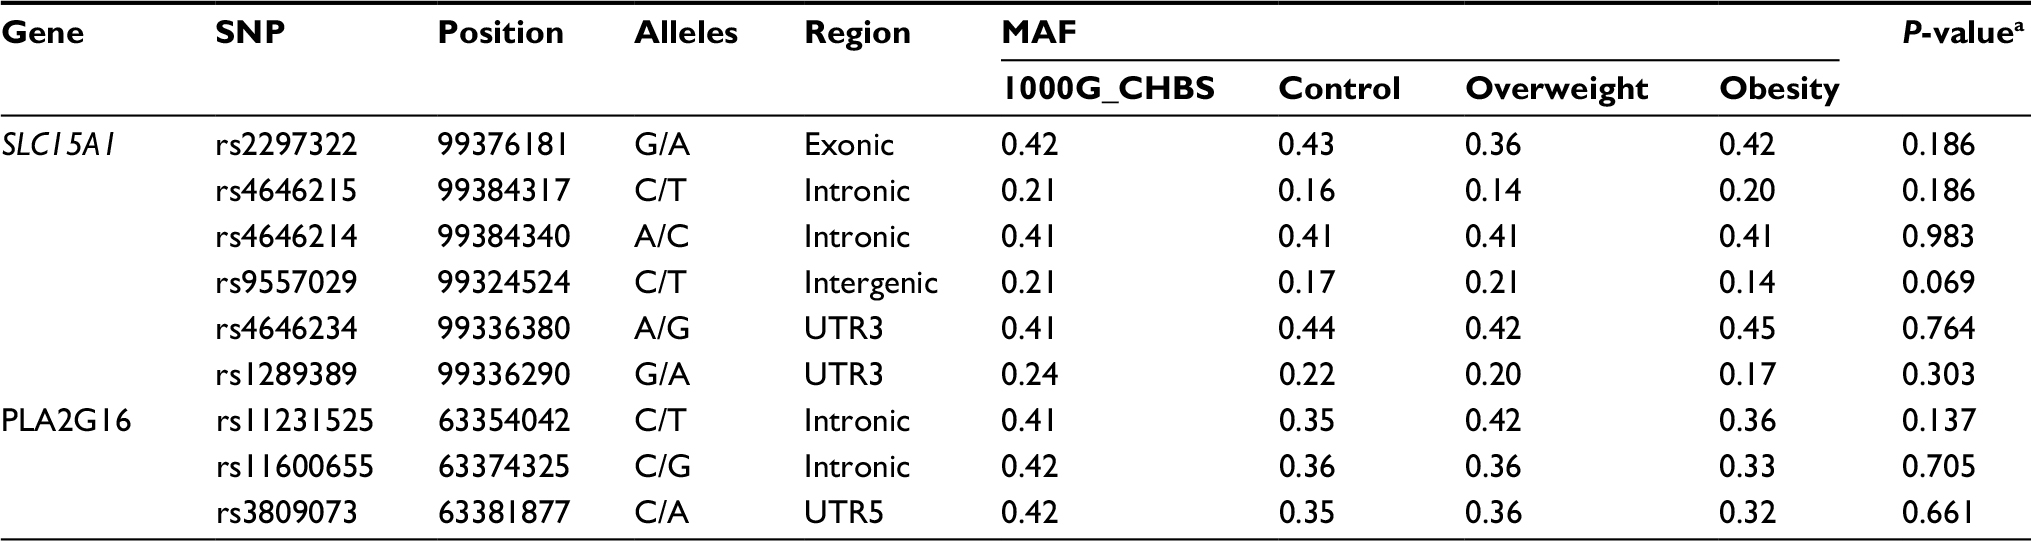 | Table 1 Allele frequencies of SNPs in overweight, obese, and control subjects Note: aGlobal P-values: allele frequencies among overweight, obese, and control subjects were compared using chi-squared test. Abbreviations: SNPs, single-nucleotide polymorphisms; MAF, minor allele frequency. |
Statistical analysis
All statistical analyses were performed by IBM SPSS Statistics 23.0. All statistical tests were two-tailed and the significance criterion was set at P<0.05. Demographic and clinical characteristics between overweight/obesity and control groups were examined by independent-samples t-tests. Differences in age and sex between overweight/obese subjects and healthy controls were calculated using the chi-squared test. Chi-squared test was also used to assess the deviation of genotype distributions from Hardy–Weinberg equilibrium (HWE) and to compare genotypic and allelic frequencies between overweight/obesity and control groups as previously described.32–34 Logistic regression model was used to estimate OR of genotypes and 95% CI for the risk of overweight and obesity adjusted for sex and age as appropriate.32,35
Results
Subject characteristics
The demographic and clinical characteristics of the subjects are shown in Table 2. BMI (25.82±1.13 kg/m2 versus 21.51±1.53 kg/m2, P<0.001), TG (2.03±1.37 mmol/L versus 1.46±1.24 mmol/L, P<0.001), and FBG (5.4±1.36 mmol/L versus 5.08±1.15 mmol/L, P=0.018) in overweight subjects were significantly higher than those in healthy subjects. Moreover, HDL-C level (1.38±0.31 mmol/L versus 1.6±0.33 mmol/L, P<0.001) in overweight subjects was significantly lower than that in healthy subjects. No significant differences were found in TChol and LDL-C levels between overweight subjects and healthy control. Similarly, BMI (29.86±1.62 kg/m2 versus 21.51±1.53 kg/m2, P<0.001), TG (2.18±1.59 mmol/L versus 1.46±1.24 mmol/L, P<0.001), and age (51.04±14.0 years versus 45.01±11.75 years) in obese subjects were significantly higher than those in healthy subjects, while HDL-C levels (1.24±0.38 mmol/L versus 1.51±0.45 mmol/L, P<0.001) in obese subjects was significantly lower than that in healthy subjects. No significant difference was found in TChol, FBG, and LDL-C levels between obese subjects and healthy control (Table 2).
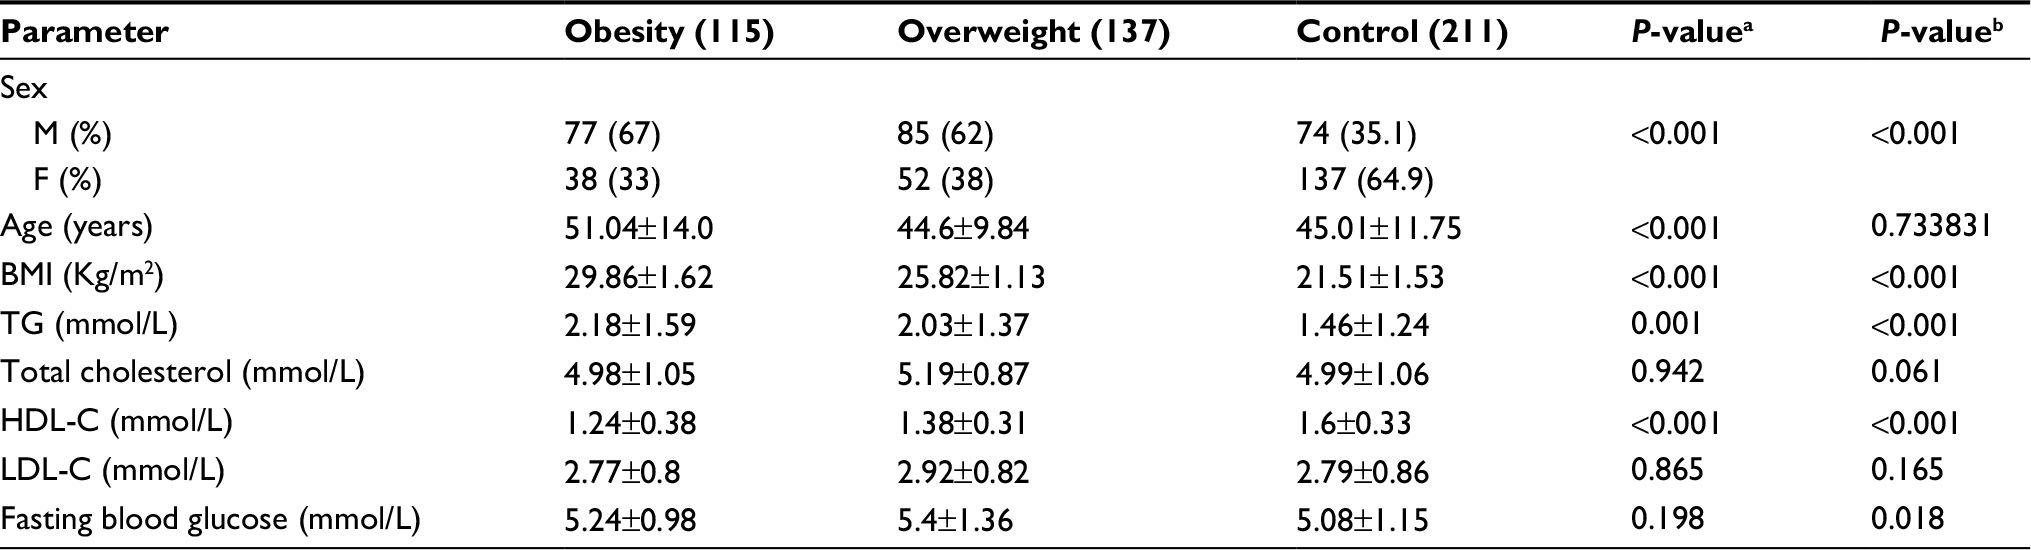 | Table 2 Clinical characteristics of overweight, obese individuals, and healthy subjects Notes: aGlobal P-values: clinical characteristics among obese individuals and healthy subjects were compared using independent samples t-tests. bGlobal P-values: clinical characteristics among overweight individuals and healthy subjects were compared using independent-samples t-tests. Abbreviations: BMI, body mass index; TG, triglycerides; HDL-C, high-density lipoprotein cholesterol; LDL-C, low-density lipoprotein cholesterol. |
SLC15A1 and PLA2G16 gene single-nucleotide polymorphisms
A total of 9 SNPs from SLC15A1 and PLA2G16 genes were chosen for further assessment. All these SNPs were in agreement with HWE in each group (P>0.05) and their minor allele frequencies were >5%. The allele frequencies of these polymorphisms in obese subjects, overweight subjects, and healthy control are given in Table 1. However, in single-locus analyses for overweight and obesity risk, the allele frequencies for any of the 9 selected SNPs were not significantly associated with overweight or obesity susceptibility (P>0.05).
Association study
As indicated in Table 3, the genotype frequencies (P=0.04 for rs9557029) were significantly different among overweight subjects, obese subjects, and healthy controls. However, the genotypes of any of the 9 selected SNPs in the overweight subjects and healthy control or obese subjects and healthy control were not found to be associated with overweight or obesity susceptibility (P>0.05). Moreover, logistic regression analysis adjusted by age and sex revealed that no significant protective or risk effects against overweight or obesity were associated with SNPs in the SLC15A1 and PLA2G16 genes compared with wild-type carriers (Table 4), as assessed by the Akaike information criteria.
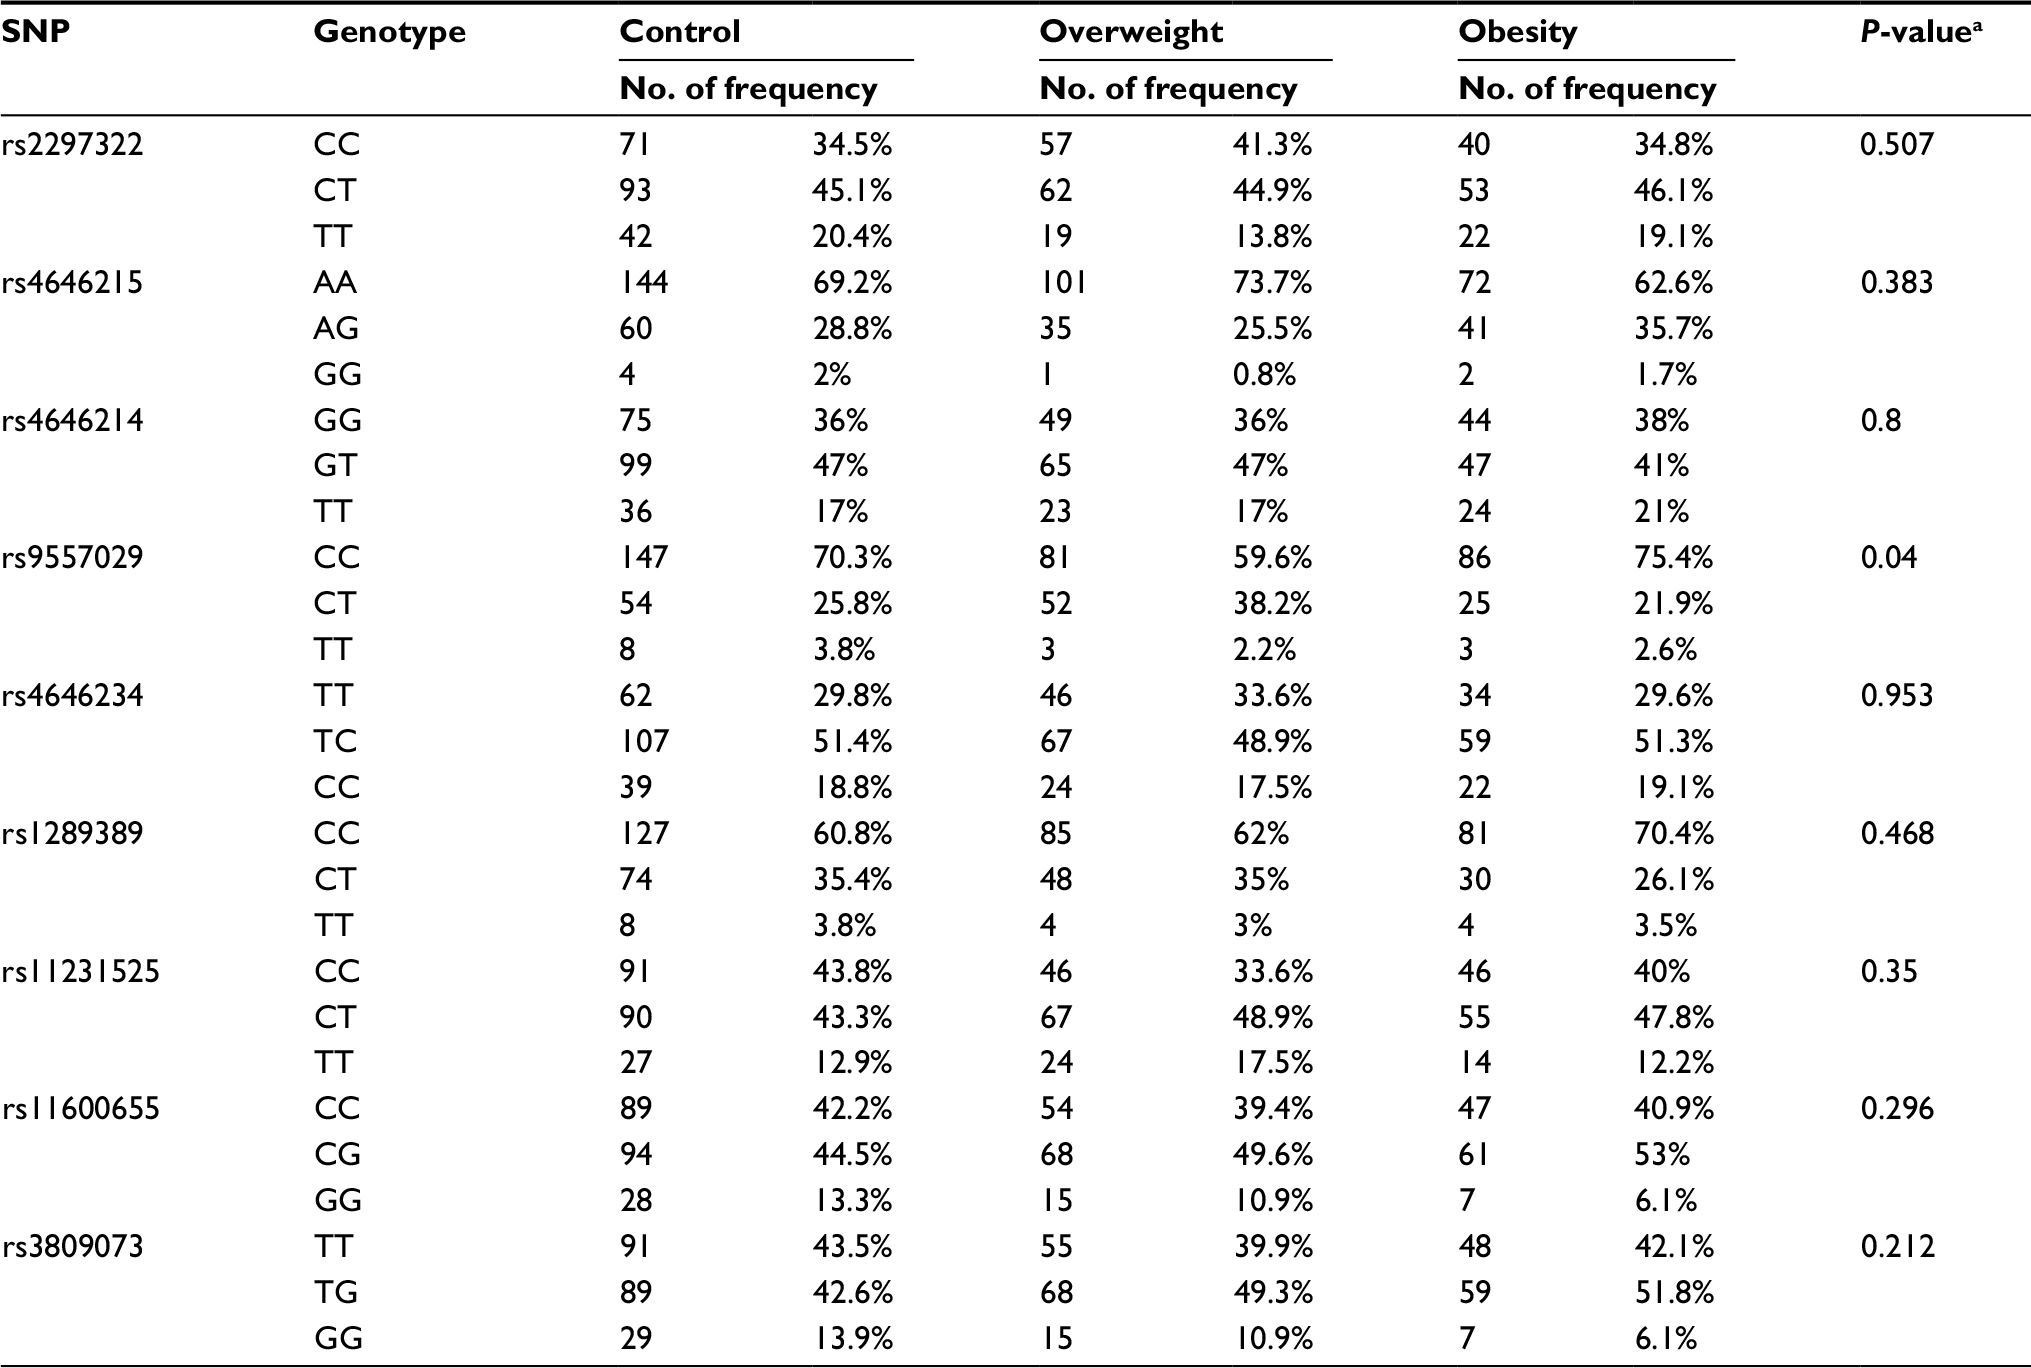 | Table 3 Genotype frequencies of SNPs among overweight, obese, and control subjects Note: aGlobal P-values: genotype frequencies among overweight, obese, and control subjects were compared using chi-squared test. Abbreviation: SNP, single-nucleotide polymorphism. |
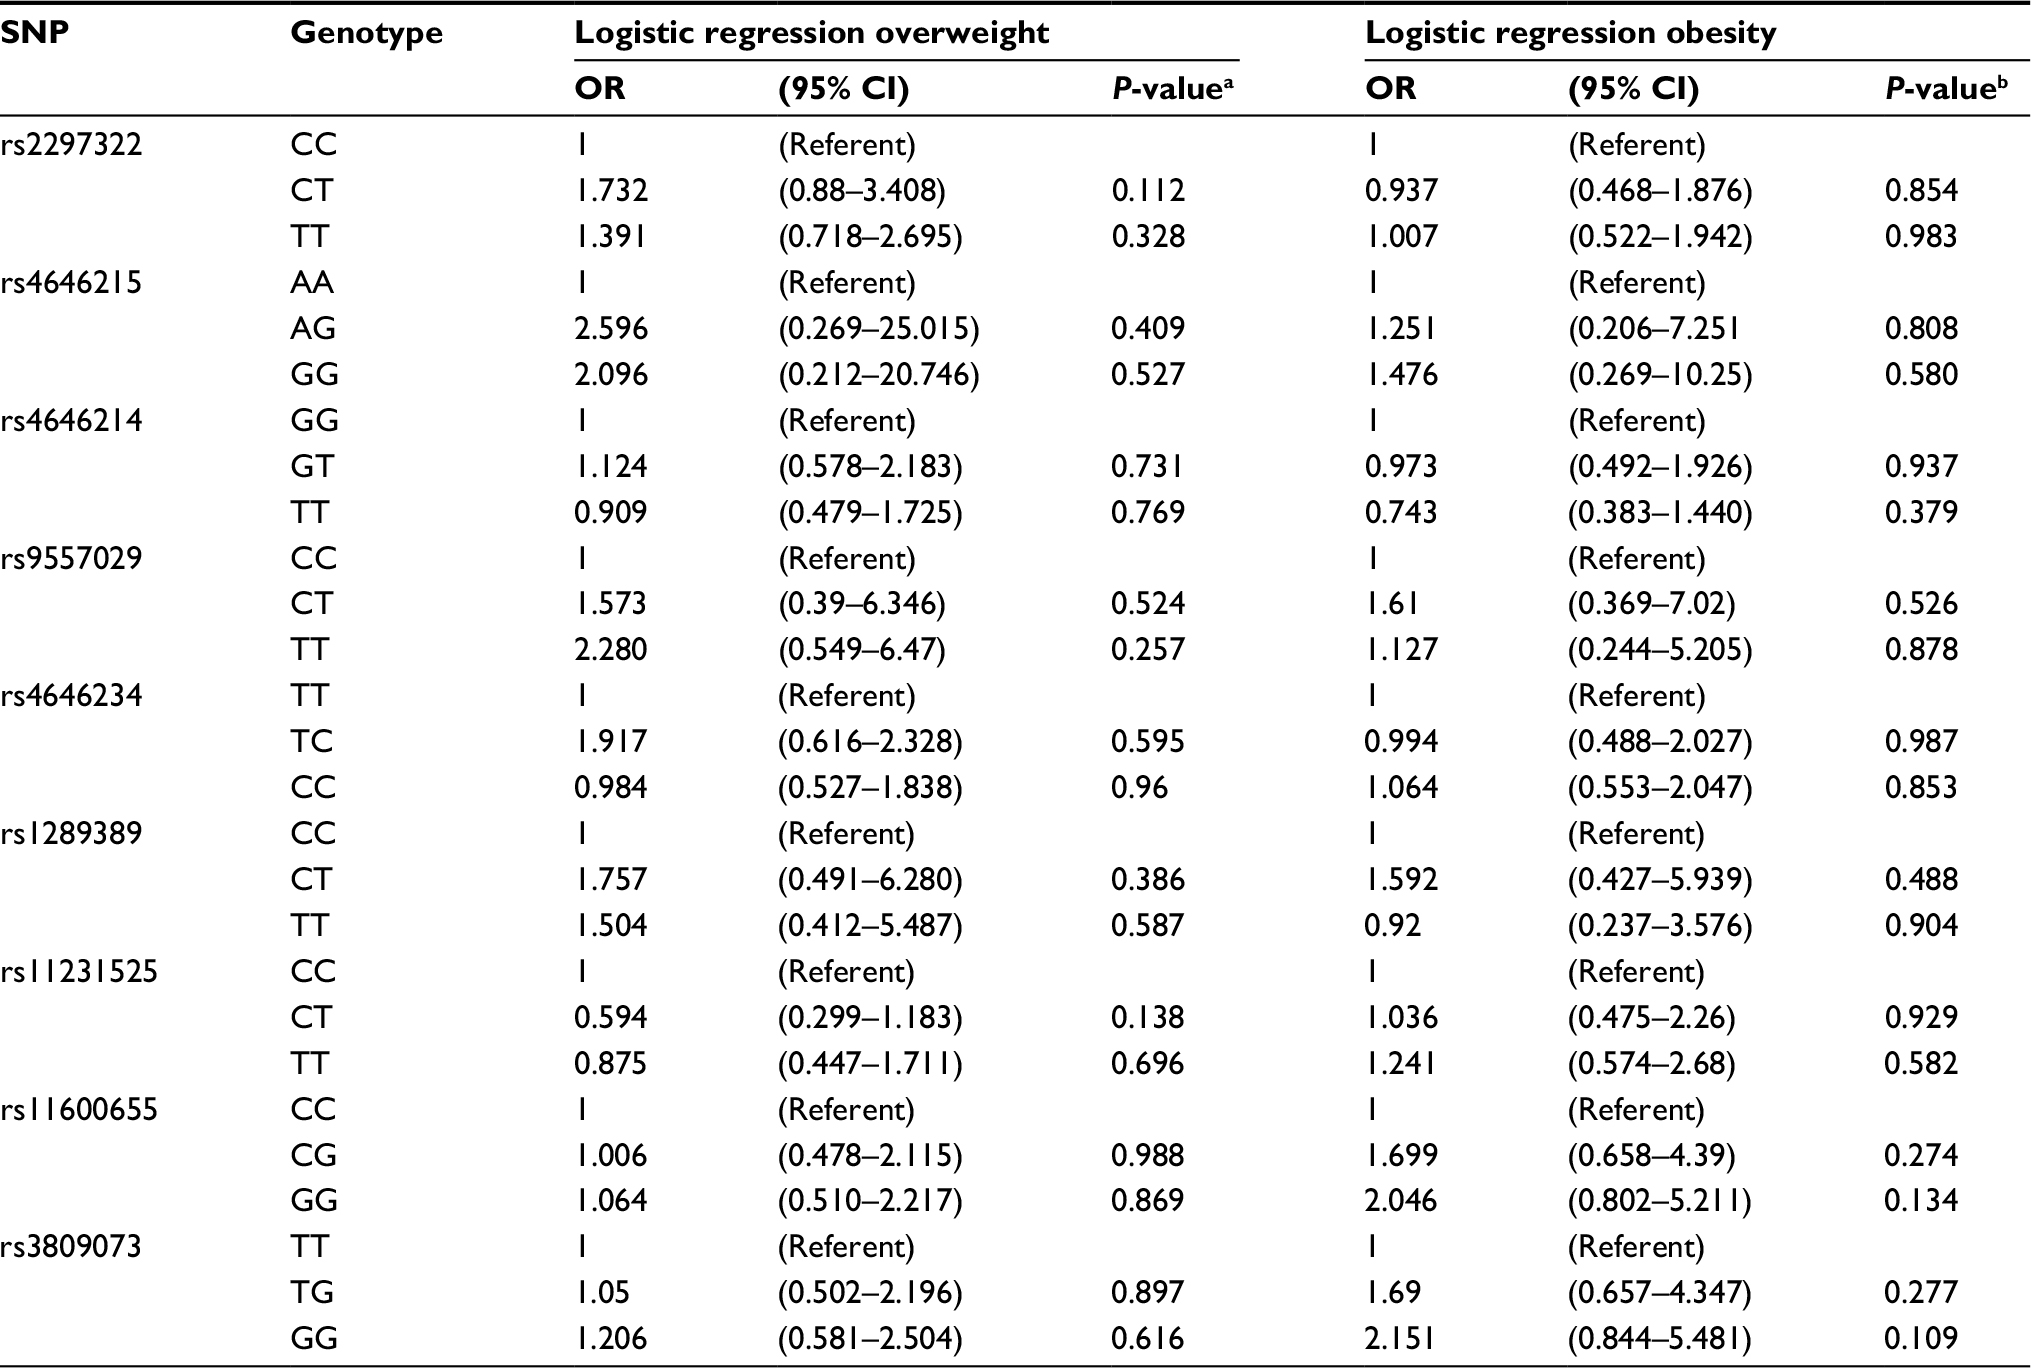 | Table 4 Association between SLC15A1, PLA2G16 genetic polymorphisms, and the risk of overweight and obesity (adjusted for age and sex) Notes: aGlobal P-values: genotype frequencies in overweight and control subjects were compared using binary logistic regression. bGlobal P-values: genotype frequencies in obesity and control subjects were compared using binary logistic regression. Abbreviation: SNP, single-nucleotide polymorphism. |
Discussion
Obesity is a multi-factorial and heritable disorder, a condition characterized by an excess of body fat.36,37 Mounting evidence suggests that obesity results from the interplay between epigenetic, genetic susceptibility, metagenomics, and environmental factors.38–40 Since association between FTO gene and increasing BMI had been reported, numerous follow-up studies were performed on independent cohorts and identified many genetic variants that are involved in the pathogenesis of obesity. Up to now, 11 rare monogenic obesity genes have been recognized, including leptin, leptin receptor, and melanocortin-4 receptors, which are mainly expressed in the hypothalamus and involved in neural circuits regulating appetite regulation and energy homeostasis. In addition, over 300 genetic variants of loci involved in different biological pathways including food sensing and digestion, central nervous system, lipid metabolism, adipocyte differentiation, and gut microbiota have also been identified as being linked to the development of obesity.39,41,42 Of course, many replication studies have consistently confirmed the significance of these SNPs in these genes.
In the present study, according to the data from the HapMap, 1000 Genomes, and previous studies, we selected 9 polymorphisms with minor allele frequency >0.05 in a Chinese population from 2 key genes that are involved in the leptin signaling pathway, nutrient intake, and energy metabolism pathway. We aimed to evaluate the contribution of these selected SNPs in SLC15A1 and PLA2G16 genes toward overweight or obesity susceptibility in Chinese Han population. Our study demonstrated that the genotype frequencies (P=0.04 for rs9557029) were significantly different among overweight subjects, obese subjects, and healthy controls. The overweight or obesity risk assessment revealed that none of these selected SNPs allele frequencies was significantly different between overweight subjects, obese subjects, and healthy controls. Similarly, no significant protective or risk effects for overweight or obesity were associated with these selected SNPs in the SLC15A1 and PLA2G16 genes compared with wild-type carriers. Overall, these findings suggest that even several previous experimental studies have established the vital role of SLC15A1 and PLA2G16 in body fat and energy metabolism regulation, our findings fail to demonstrate significant association of SNPs with obesity susceptibility. That is to say, we failed to find associations between these 9 gene polymorphisms and obesity susceptibility in Chinese Han population.
To our knowledge, the LEPRb/JAK2/MAPK (ERK1/2) pathway plays a critical role in appetite regulation, energy metabolism, food intake, neuroendocrine function in humans; however, the association study of such pathway downstream gene SLC15A1 polymorphisms with obesity susceptibility is by far firstly proposed by us. In 2002, Saito et al43 screened DNAs of 48 unrelated Japanese individuals for SNPs in genes encoding proteins of the solute carrier family by direct sequencing. They revealed that rs2297322 and rs1289389 in SLC15A1 may contribute to investigations of possible correlations between genotypes and disease susceptibilities. Subsequently, some studies showed the possible role of SLC15A1 human genetic polymorphisms in inflammatory bowel disease (IBD). One study in Scandinavian cohorts revealed an association between the SLC15A1 SNP rs2297322 and IBD susceptibility. While in a more recent study, authors demonstrated that rs2297322 was not associated with disease susceptibility in German cohorts.44,45 Similarly, Zhang et al demonstrated that in unrelated individuals of different ethnicities, particular variant PepT-1-P586L may have remarkable effect on PepT-1 translation, degradation, and/or membrane insertion;46 nevertheless, another study performed by Anderle et al failed to repeat the conclusion. Until now, research on the SLC15A1 gene polymorphisms remains controversial.47
Multiple studies demonstrated that sPLA2 family plays a distinct role in obesity including its immunoregulation and lipoprotein hydrolysis.29–31 However, we failed to find associations between SNPs in PLA2G16 gene and the risk of obesity. So far, there is no study about genetic polymorphisms in PLA2G16 gene.
Admittedly, some limitations in the present study should not be ignored. First of all, our study may not be the most representative research, as it was conducted with 463 Han Chinese subjects, a relatively insufficient population and a single ethnicity. Before the start of our study, the predicted sample size showed that we needed 167 obese subjects, 167 overweight subjects, and 167 controls. We did recruit 611 subjects; however, as we mentioned previously, 148 subjects had to be excluded. Therefore, we consider that sample size and race may be limiting factors. Further verification needs to be done in different races and large samples. Secondly, SNPs may locate on coding or non-coding regions of genes, or intergenic regions. Those loci in non-coding regions of genes or intergenic regions may also play a regulatory role by affecting gene splicing, transcription factor binding, or even the pathophysiological processes of related diseases; thus, the SNPs we selected for investigation may not likely thoroughly represent the genetic variability of SLC15A1 and PLA2G16 genes. Finally, there were indeed cases where some genetic polymorphisms and disease phenotypes could not match one another. In the genetic process, when the alleles at different loci are combined according to the random principle, the frequency of allele combinations at different loci is equal to the product of the respective frequencies of the combined alleles. There is no dominant combination. This kind of linkage equilibrium of different loci does not characterize ultimately the phenotype of disease. Further investigations on the susceptibility of SNPs are needed.
Acknowledgments
The authors would like to thank the patients and volunteer blood donors as well as the staff of the Xiangya Hospital physical examination center of Central South University. This study was supported by The Research of Major Disease Prevention and Control of Precision Medical Research of Hunan Province Education Department (number 2016JC2069) and The National Science and Technology Major Projects for Major New Drugs Innovation and Development (numbers 2017zx09306012, 2017zx09304014).
Author contribution
All the authors contributed toward data analysis, drafting, and critically revising the paper and agree to be accountable for all aspects of the work.
Disclosure
The authors report no conflicts of interest in this work.
References
Laber S, Cox RD. Commentary: FTO obesity variant circuitry and adipocyte browning in humans. Front Genet. 2015;6(10):318. | ||
Lauby-Secretan B, Scoccianti C, Loomis D, Grosse Y, Bianchini F, Straif K; International Agency for Research on Cancer Handbook Working Group. Body fatness and cancer—viewpoint of the IARC working group. N Engl J Med. 2016;375(8):794–798. | ||
Fall T, Ingelsson E. Genome-wide association studies of obesity and metabolic syndrome. Mol Cell Endocrinol. 2014;382(1):740–757. | ||
Kong X, Zhang X, Zhao Q, et al. Obesity-related genomic loci are associated with type 2 diabetes in a Han Chinese population. PLoS One. 2014;9(8):e104486. | ||
Ng M, Fleming T, Robinson M, et al. Global, regional, and national prevalence of overweight and obesity in children and adults during 1980–2013: a systematic analysis for the Global Burden of Disease Study 2013. Lancet. 2014;384(9945):766–781. | ||
WHO. WHO|Obesity and overweight. New York: Springer; 2015. Available from: http://www.who.int/features/factfiles/obesity/en/. December 4th, 2017. | ||
Kelly T, Yang W, Chen CS, Reynolds K, He J. Global burden of obesity in 2005 and projections to 2030. Int J Obes (Lond). 2008;32(9):1431–1437. | ||
Series WHOTR. Obesity: preventing and managing the global epidemic. Report of a WHO consultation. World Health Organ Tech Rep Ser. 2000;894(1):i-xii, 1-253. | ||
Wang S, Peng D. Regulation of adipocyte autophagy—the potential anti-obesity mechanism of high density lipoprotein and ApolipoproteinA-I. Lipids Health Dis. 2012;11(1):131–131. | ||
Stigler FL, Lustig RH, Ma JI. Mechanisms, pathophysiology, and management of obesity. N Engl J Med. 2017;376(15):1491. | ||
Frayling TM, Timpson NJ, Weedon MN, et al. A common variant in the FTO gene is associated with body mass index and predisposes to childhood and adult obesity. Science. 2007;316(5826):889–894. | ||
Lee M, Kwon DY, Kim MS, Chong CR, Park MY, Kim AJ. Genome-wide association study for the interaction between BMR and BMI in obese Korean women including overweight. Nutr Res Pract. 2016;10(1):115–124. | ||
Kolodziejczak D, Spanier B, Pais R, et al. Mice lacking the intestinal peptide transporter display reduced energy intake and a subtle maldigestion/malabsorption that protects them from diet-induced obesity. Am J Physiol Gastrointest Liver Physiol. 2013;304(10):G897–G907. | ||
Brandsch M, Knütter I, Bosse-Doenecke E. Pharmaceutical and pharmacological importance of peptide transporters. J Pharm Pharmacol. 2008;60(5):543–585. | ||
Fei YJ, Kanai Y, Nussberger S, et al. Expression cloning of a mammalian proton-coupled oligopeptide transporter. Nature. 1994;368(6471):563–566. | ||
Hindlet P, Bado A, Kamenicky P, et al. Reduced intestinal absorption of dipeptides via PepT1 in mice with diet-induced obesity is associated with leptin receptor down-regulation. J Biol Chem. 2009;284(11):6801–6808. | ||
Tavernier A, Cavin JB, Le GM, et al. Intestinal deletion of leptin signaling alters activity of nutrient transporters and delayed the onset of obesity in mice. FASEB J. 2014;28(9):4100–4110. | ||
Ashrafi K, Chang FY, Watts JL, et al. Genome-wide RNAi analysis of Caenorhabditis elegans fat regulatory genes. Nature. 2003;421(6920):268–272. | ||
Buyse M, Berlioz F, Guilmeau S, et al. PepT1-mediated epithelial transport of dipeptides and cephalexin is enhanced by luminal leptin in the small intestine. J Clin Invest. 2001;108(10):1483–1494. | ||
Santiago-López L, González-Córdova AF, Hernández-Mendoza A, Vallejo-Cordoba B. Potential use of food protein-derived peptides in the treatment of inflammatory diseases. Protein Pept Lett. 2016;24(2):137–145. | ||
Liang YC, Hu JC, Li PY, Huang GJ, Kuo YH, Chao CY. Torenia concolor Lindley var. formosana Yamazaki extracts improve inflammatory response and lipid accumulation via PPARs activation. Biomedicine (Taipei). 2017;7(3):18. | ||
Denis GV, Sebastiani P, Andrieu G, et al. Relationships among obesity, type 2 diabetes, and plasma cytokines in African American women. Obesity (Silver Spring). 2017;25(11):1916–1920. | ||
Guzik TJ, Skiba DS, Touyz RM, Harrison DG. The role of infiltrating immune cells in dysfunctional adipose tissue. Cardiovasc Res. 2017;113(9):1009–1023. | ||
Zhao L, Fu Z, Wu J, et al. Inflammation-induced microvascular insulin resistance is an early event in diet-induced obesity. Clin Sci (Lond). 2015;129(12):1025–1036. | ||
Jaworski K, Ahmadian M, Duncan RE, et al. AdPLA ablation increases lipolysis and prevents obesity induced by high-fat feeding or leptin deficiency. Nat Med. 2009;15(2):159–168. | ||
Kogelman LJ, Cirera S, Zhernakova DV, Fredholm M, Franke L, Kadarmideen HN. Identification of co-expression gene networks, regulatory genes and pathways for obesity based on adipose tissue RNA sequencing in a porcine model. BMC Med Genomics. 2014;7(1):57. | ||
Abbott MJ, Tang T, Sul HS. The role of phospholipase A2-derived mediators in obesity. Drug Discov Today Dis Mech. 2010;7(3–4): e213–e218. | ||
Baeza-Raja B, Sachs BD, Li P, et al. p75 neurotrophin receptor regulates energy balance in obesity. Cell Rep. 2016;14(2):255–268. | ||
Sato H, Taketomi Y, Ushida A, et al. The adipocyte-inducible secreted phospholipases PLA2G5 and PLA2G2E play distinct roles in obesity. Cell Metab. 2014;20(1):119–132. | ||
Ait-Oufella H, Herbin O, Lahoute C, et al. Group X secreted phospholipase A2 limits the development of atherosclerosis in LDL receptor-null mice. Arterioscler Thromb Vasc Biol. 2013;33(3):466–473. | ||
Ceddia RP, Lee D, Maulis MF, et al. The PGE2 EP3 Receptor Regulates Diet-Induced Adiposity in Male Mice. Endocrinology. 2016;157(1):220–232. | ||
Gong WJ, Yin JY, Li XP, et al. Association of well-characterized lung cancer lncRNA polymorphisms with lung cancer susceptibility and platinum-based chemotherapy response. Tumour Biol. 2016;37(6):8349–8358. | ||
Xiao D, Guo Y, Li X, et al. The Impacts of SLC22A1 rs594709 and SLC47A1 rs2289669 polymorphisms on metformin therapeutic efficacy in Chinese type 2 diabetes patients. Int J Endocrinol. 2016;2016:4350712. | ||
Sheng Z, Xu K, Ou Y, et al. Relationship of body composition with prevalence of osteoporosis in central south Chinese postmenopausal women. Clin Endocrinol (Oxf). 2011;74(3):319–324. | ||
Li Q, Li C, Li H, et al. Effect of AMP-activated protein kinase subunit alpha 2 (PRKAA2) genetic polymorphisms on susceptibility to type 2 diabetes mellitus and diabetic nephropathy in a Chinese population. J Diabetes. 2017;10(1):43–49. | ||
Speakman JR. The ‘Fat Mass and Obesity Related’ (FTO) gene: mechanisms of impact on obesity and energy balance. Curr Obes Rep. 2015;4(1):73–91. | ||
Singh RK, Kumar P, Mahalingam K. Molecular genetics of human obesity: a comprehensive review. C R Biol. 2017;340(2):87–108. | ||
Raman R. Genetics, epigenetics, and the metagenomics in obesity. IJNutrology. 2011;4(2):4–7. | ||
Pigeyre M, Yazdi FT, Kaur Y, Meyre D. Recent progress in genetics, epigenetics and metagenomics unveils the pathophysiology of human obesity. Clin Sci (Lond). 2016;130(12):943–986. | ||
Oyeyemi BF, Ologunde CA, Olaoye AB, Alamukii NA. FTO gene associates and interacts with obesity risk, physical activity, energy intake, and time spent sitting: pilot study in a Nigerian population. J Obes. 2017;2017:3245270. | ||
Li YM, Ou JJ, Liu L, Zhang D, Zhao JP, Tang SY. Association between maternal obesity and autism spectrum disorder in offspring: a meta-analysis. J Autism Dev Disord. 2016;46(1):95–102. | ||
Zhou Y, Rui L. Leptin signaling and leptin resistance. Front Med. 2013;7(2):207–222. | ||
Saito S, Iida A, Sekine A, et al. Catalog of 238 variations among six human genes encoding solute carriers ( hSLCs) in the Japanese population. J Hum Genet. 2002;47(11):576–584. | ||
Zucchelli M, Torkvist L, Bresso F, et al. Inflamm Bowel Dis. 2009;15(10):1562–1569. | ||
Wuensch T, Ullrich S, Schulz S, et al. Colonic expression of the peptide transporter PEPT1 is downregulated during intestinal inflammation and is not required for NOD2-dependent immune activation. Inflamm Bowel Dis. 2014;20(4):671–684. | ||
Zhang EY, Fu DJ, Pak YA, et al. Genetic polymorphisms in human proton-dependent dipeptide transporter PEPT1: implications for the functional role of Pro586. J Pharmacol Exp Ther. 2004;310(2):437–445. | ||
Anderle P, Nielsen CU, Pinsonneault J, Krog PL, Brodin B, Sadée W. Genetic variants of the human dipeptide transporter PEPT1. Journal of Pharmacology & Experimental Therapeutics. 2006;316(2):636–646. |
 © 2018 The Author(s). This work is published and licensed by Dove Medical Press Limited. The full terms of this license are available at https://www.dovepress.com/terms.php and incorporate the Creative Commons Attribution - Non Commercial (unported, v3.0) License.
By accessing the work you hereby accept the Terms. Non-commercial uses of the work are permitted without any further permission from Dove Medical Press Limited, provided the work is properly attributed. For permission for commercial use of this work, please see paragraphs 4.2 and 5 of our Terms.
© 2018 The Author(s). This work is published and licensed by Dove Medical Press Limited. The full terms of this license are available at https://www.dovepress.com/terms.php and incorporate the Creative Commons Attribution - Non Commercial (unported, v3.0) License.
By accessing the work you hereby accept the Terms. Non-commercial uses of the work are permitted without any further permission from Dove Medical Press Limited, provided the work is properly attributed. For permission for commercial use of this work, please see paragraphs 4.2 and 5 of our Terms.