")
Back to Journals » International Journal of General Medicine » Volume 15
Association Between Phthalate Exposure in Pregnancy and Gestational Diabetes: A Chinese Cross-Sectional Study
Authors Liang QX, Lin Y, Fang XM, Gao YH, Li F
Received 24 August 2021
Accepted for publication 6 December 2021
Published 6 January 2022 Volume 2022:15 Pages 179—189
DOI https://doi.org/10.2147/IJGM.S335895
Checked for plagiarism Yes
Review by Single anonymous peer review
Peer reviewer comments 2
Editor who approved publication: Dr Scott Fraser
Qiu-Xia Liang,1 Yan Lin,1 Xiao-Min Fang,2 Yun-He Gao,3 Fei Li4
1Department of Delivery Room, Guangzhou Women and Children Medical Center, Guangzhou, 510623, People’s Republic of China; 2Fundus Surgery Department, Zhongshan Ophthalmic Center, Sun Yat-sen University, Guangzhou, 510060, People’s Republic of China; 3Department of Obstetrics Clinic, Guangzhou Women and Children Medical Center, Guangzhou, 510623, People’s Republic of China; 4Department of Laboratory Medicine, Guangzhou Women and Children Medical Center, Guangzhou, 510623, People’s Republic of China
Correspondence: Yan Lin
Nursing Department, Guangzhou Women and Children Medical Center, No. 9 Jinsui Road, Guangzhou, 510623, People’s Republic of China
Tel +86 20 38076026
Fax +86 20 38076028
Email [email protected]
Objective: The present study aims to explore the association between phthalate exposure and the risk of gestational diabetes mellitus (GDM).
Materials and Methods: A total of 11 plasticizer metabolites were measured in patient morning urine using high-performance liquid chromatography. Furthermore, fasting blood glucose and fasting insulin were detected in first-trimester blood samples. The chemical concentration was described using the median, the metabolite concentration difference between the GDM and control groups was compared using the bootstrap method, and the correlations of the fasting blood glucose, fasting insulin, insulin resistance index, and phthalic acid ester (PAE) metabolites were analyzed using Spearman correlation analysis. The multivariate logistic regression model and predictive probability map were performed to help assess the linearity and nature of any dose–response relationship.
Results: Of the 224 women recruited for the present study, 200 met the inclusion criteria. Their measured outcomes and biomonitoring data were examined for the presence of chemicals. The results showed that the patients in the GDM group had higher mono-(2-ethylhexyl) phthalate (MEHP) and methylerythritol cyclophosphane concentrations in their bodies than the patients in the control group. Statistically significant MEHP–GDM associations were also observed (P < 0.001). The GDM and MEHP dose–response relationships were different among pregnant women aged < 35 years and those aged > 35 years (P < 0.001). Furthermore, gestational age > 28 weeks exhibited similar changes to those aged ≤ 28 weeks (P = 0.059).
Conclusion: The findings of the present study add to the growing body of evidence supporting phthalate exposure as a GDM risk factor.
Keywords: phthalate exposure, gestational diabetes, dose-response relationships, association
Introduction
Gestational diabetes mellitus (GDM) is the first occurrence or discovery of impaired glucose tolerance during pregnancy. It is reported that the prevalence rate of GDM is 17.8%. The incidence of GDM in China is 18.9%. It is one of the most common complications during pregnancy. The main risk of GDM is the poor clinical outcome and risk of death in the perinatal period, such as maternal–fetal dysplasia during pregnancy, postnatal development of type 2 diabetes mellitus (T2DM), intrauterine fetal dysplasia, macrosomia, neonatal malformation, the risk of hypoglycemia, and so on.1–4 Prevention and control GDM is important to ensure the safety of mothers and infants. At present, the pathogenesis of GDM is still not clear. Some studies have shown that the pathogenesis of GDM is related to insulin resistance.
Phthalates are widely used plasticizers; they can be applied in products such as food packaging materials, household products, and shampoos due to their enhanced flexibility, transparency, and durability. The most widely used phthalate, di(2-ethylhexyl) phthalate (DEHP), reportedly accounts for >50% of the flexible polyvinyl chloride plasticizer market share.5,6 Since phthalates do not chemically bond with plastics, they can penetrate the human environment through various means, such as food, water, and road dust, resulting in body exposure via ingestion or inhalation.7 Phthalates have a half-life of <24 hours; they are rapidly metabolized in the body after exposure8,9 and subsequently excreted in the urine. Thus, the urine metabolite level is used to calculate the exposure dose present in the human body, as urine samples are relatively easy to collect, and the test results can reflect individual sample exposure statuses from recent weeks or months.10
The results of animal studies show that phthalic acid esters (PAEs) can affect the normal glucose metabolism by interfering with insulin signal transduction, inhibiting glucose uptake and oxidation, inducing oxidative stress, and interfering with normal hormone function, thus causing an increase in blood glucose and insulin levels in humans and experimental animals.11 Epidemiological studies in non-pregnant adults have shown respective associations between phthalates and raised fasting blood glucose, insulin resistance, reduced insulin secretion, and T2DM.12–14 This study is based on animal research. The results of animal research are that two PAEs can interfere with insulin. This study designed the experiment to investigate the relationship between the metabolites of phthalate, and GDM in pregnant women.
Insulin resistance and islet insufficiencies are common GDM and T2DM pathogeneses.15 Presently, few epidemiological studies have evaluated the relationship between phthalates and blood glucose during pregnancy. Epidemiological studies have yielded conflicting results regarding phthalate exposure associations with insulin resistance and GDM. In a cohort study of 72 pregnant women, the levels of MiBP and MBzP in urine in early pregnancy (mean gestational age 12.8 weeks) were negatively correlated with postprandial 1H blood glucose levels.16 The results of a larger study showed that urinary monomethyl phthalate (MEP) was positively associated with impaired glucose tolerance (IGT) in the second trimester, while diethyl phthalate (2-methylphenyl) metabolites were associated with a low IGT incidence.17 The most extensive relevant study (n = 1274) found no significant association between urinary phthalate metabolites and IGT/GDM in early pregnancy.18
The objective of the present study is to investigate the prospective relationship between phthalate metabolites and glucose homeostasis at 24–28 weeks of gestation in order to establish the plasticizer dose model in GDM treatment.
Materials and Methods
Patients
Pregnant women from Guangzhou Women and Children’s Medical Center were recruited as study subjects between March 2017 and June 2017. This study was conducted in accordance with the Declaration of Helsinki. The medical center’s Institutional Review Board and Ethics Committee approved the study protocol, and all subjects gave their informed consent. The hospital records of 200 women with singleton pregnancies (100 with GDM and 100 without) were chosen for the present study based on inclusion and exclusion criteria (Figure 1).
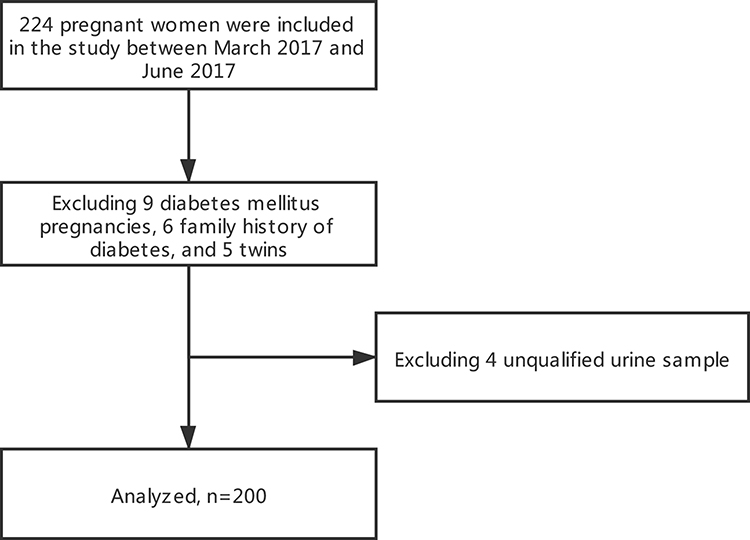 |
Figure 1 Flow diagram. |
Inclusion criteria: (1) patients aged ≥18; (2) patients with the intention to deliver at the study hospital. Exclusion criteria: (1) patients with histories of GDM, diabetes, and smoking; (2) patients with a family history of GDM. At the first antenatal check, women with a high GDM risk were screened using the oral glucose tolerance test (OGTT).
After the OGTT diagnostic test, the subjects were divided into the gestational diabetes and non-gestational diabetes groups. The study group was the gestational diabetes group, and the control group comprised women at weeks 24–28 of pregnancy with normal OGTT results.
GDM Diagnosis
GDM was confirmed in patients using a 75 g OGTT in accordance with the American Diabetes Association/International Association of the Diabetes and Pregnancy Study Groups criteria.19 When the OGTT results show either fasting blood glucose ≥5.1 mmol/L, 1 h ≥10 mmol/L, or 2 h ≥8.5 mmol/L, a GDM diagnosis can be made.
Data Collection
The extensive data collection, which was conducted using a structured self-reported questionnaire, was overseen by a trained interviewer. The detailed collected data included age, ethnicity, education, socioeconomic status, and family history of diabetes, smoking, and alcohol. Urine samples were collected at the time of each patient’s clinic visit and stored at −20°C until assay and blood samples were collected. In order to avoid laboratory equipment contamination with plasticizers, only glass instruments were used for urine sample collection, preservation, and treatment.
Chemical Biomonitoring Data
A total of 11 phthalate metabolites were measured in the patient urine samples, as stated above.20 The phthalate metabolites comprised monomethyl phthalate (MMP), MEP, mono-n-butyl phthalate (MBP), monocyclohexyl phthalate (MCHP), MBzP, MiBP, mono-2-ethylhexyl phthalate (MEHP), mono(2-ethyl-5-oxohexyl) phthalate (MEOHP), mono(2-ethyl-5-carboxypentyl) phthalate (MECPP), monooctyl phthalate (MOP), and monoisodecyl phthalate (MiNP).
The chemical urine sample analyses were conducted at the Fudan University of Public Health laboratory. The phthalates in the urine were analyzed via liquid chromatography–mass spectrometry–tandem mass spectrometry (American Agilent company) with ultra-performance liquid chromatography coupled with a tandem mass spectrometer and Quattro Premier XE following enzymatic deconjugation.20
Standards: MMP, MBP, MEHP, MNzP (chromatographically pure, Dr. Ehrenstorfer, Germany), MCHP, MEOHP, MiBP, MOP, MiNP (chromatographically pure, Toronto Research Chemicals, Canada), MEP (chromatographically pure, AccuStandard, USA), MECPP (chromatographically pure, Cambridge Isotope Laboratories, Inc., USA), internal standard (chromatographically pure, Cambridge Isotope Laboratories, Inc., USA), and β-glucuronidase (>99.99%, Merck Millipore, Germany). Other reagents are HPLC grade or pesticide residue grade.
Instruments and Reagents
A Waters 600 high-performance liquid chromatography system (American Waters Company, equipped with a 2487 UV detector, a 2473 fluorescence detector, a 717 automatic sampler, and an Empower Chromatography workstation), Sepax GP phenyl high-performance liquid chromatographic column (4.6 mm) × 250 mm, 5 μm. Sepax Technologies: Sepax-h2p solid-phase extraction column (60 mg) × 3 mL, Sepax Technologies, USA. MMP, MEP, MBP, MCHP, MBzP, MiBP, MEHP, and MEOHP standard for seven metabolites of MECPP, MOP, and MiNP (chromatographic purity, AccuStandard Company, USA). β-glucuronidase (Sigma-Aldrich, USA). Acetonitrile, methanol (chromatographic purity, Tianjin Jiangtian Chemical Technology Co., Ltd.), NaH2PO4·2H2O, ammonia, phosphoric acid, ethyl acetate (analytical purity, Tianjin Jiangtian Chemical Technology Co., Ltd.), ammonium acetate (analytical purity, Kewei Company of Tianjin University), creatinine (Tianjin Bodi Chemical Co., Ltd.). The preparation of MBP, MBzP, and MEHP standard stock solutions was accurately weighed, and MMP, MEP, MBP, MCHP, MBzP, and MiBP were taken. About 25 mg of seven metabolite standards of MEHP, MEOHP, MECPP, MOP, and MiNP were dissolved in methanol with a concentration of about 1 mg/mL. They were stored in a refrigerator at –4°C and diluted when used temporarily. The preparation of the basic solution: acetonitrile-water (50:50 by volume) solution was added to a 100 mL volumetric flask containing 0.5 mL of 30% ammonia, and the volume was fixed with ultrapure water. The preparation of the acid solution: about 2.184 g of NaH2PO4·2H2O was weighed into a 100 mL volumetric flask, the volume was fixed with ultrapure water, 1 mL of 55% phosphoric acid solution was added, and the pH value of the obtained solution was 2.0 ± 0.1.
Sample Pretreatment
The frozen urine was taken out and thawed slowly at room temperature. The 1.00 mL thawed urine sample was mixed in a vortex for 30 s and an ultrasonic for five min. Then 250 μL ammonium acetate buffer (NaAc/HAc buffer, pH = 4.5) and 20 μL β-glucosidase (200 U/mL) was added, mixed, and hydrolyzed in a 37°C water bath for 120 min.
Sample Solid-Phase Extraction
In order to avoid the interference of non-tested components, urine samples were successively connected in a series through two activated solid phase extraction columns, SpeA and SpeB. In the process of solid-phase extraction, the flow rate of liquid was controlled to 1 mL/min.
Activation of the SpeA Column
Through a SpeA column, 1 mL of acetonitrile and 2 mL of basic solution were taken successively to make the solvent infiltrate the filler and flow out after staying for three min.
Use of the SpeA Column
A 1 mL measurement of basic solution was added to the hydrolyzed urine sample, mixed well, and collected into a glass tube through the SpeA after standing. The SpeA column was washed with 1 mL of the basic solution, and the washing solution was collected into the same glass tube. Then 3 mL of the acid solution was added to the glass tube, mixed well, and let stand for five min.
Activation of the SpeB Column
Through the SpeB column, 1 mL of acetonitrile, 1 mL of ultrapure water, and 2 mL of acid solution were passed, in turn, to make the solvent infiltrate the filler and flow out after staying for 3 min.
Use of the SpeB Column
The mixed sample was passed through the SpeA column then through the SpeB column, and the effluent was discarded. Then 3 mL acid solution and 9 mL ultrapure water was added to the SpeB column for washing, and the washing solution was discarded.
Elution and Collection
Through the SpeB column, 2 mL of acetonitrile and 4 mL of ethyl acetate (concentration: 99.8%) were passed and collected with a graduated concentration bottle.
Constant Volume and Storage
The scale concentration bottle was placed in a 55°C water bath, dried with a dry nitrogen gas flow (15 psi, UHP level), a constant volume of ultrapure water to 200 μL, transferred to a brown bottle, sealed with a gland, and frozen at 4°C.
Chromatography Analysis
The chromatography instrument used acetonitrile (containing 0.2% acetic acid): water (containing 0.2% acetic acid) with a volume ratio of 48:52 as the mobile phase and eluted in a flow rate gradient. The elution procedure was 0 ~ <9 min and the flow rate was 0.9 mL/min; 9 ~ <29 min, the flow rate was 1.0 mL/min; 29 ~ 30 min, the flow rate was 0.9 mL/min. The detection wavelength was 228 nm, the excitation wavelength was 275 nm, and the emission wavelength was 312 nm. The column temperature was 40°C; the injection volume was 20 μL.
Qualitative and Quantitative Analysis Chart
Qualitative analysis by retention time. The internal standard method was used for quantitative analysis.
Fasting blood glucose was detected using the glucose oxidase-phenol amino phenazone assay. The ARCHITECT insulin assay kit was used to detect insulin in human serum or plasma with a one-step immunoassay at the Guangzhou Women and Children’s Medical Center laboratory. Chemiflux was used as the testing method.
Statistical Analysis
The database was established with EpiData 3.1, and the data were analyzed and calculated using the Statistical Analysis System 9.4. Partial distribution of 11 metabolite concentrations was made, and the median (four quantiles spacing) was used to describe the data. All 11 indexes were measured using the same person’s PAE metabolites, so there may be a certain degree of correlation among the indexes. The bootstrap method was used to compare the differences in metabolite concentration among the different groups. The correlations between fasting blood glucose, fasting insulin, insulin resistance index, and PAE metabolites were determined using Spearman correlation analysis. The multiple factor regression model was used to adjust the confounding factors, and the probability map was used to further explore the effect of PAE metabolism on GDM. A bilateral test was used, and a P-value of <0.05 was considered statistically significant. The P-values of phthalate metabolites in urine were compared by the bootstrap method.
Results
A total of 224 pregnant women, 24 of whom were excluded, were initially chosen for the present study. The reasons for exclusion were a diabetic family history in six patients, diabetes and pregnancy in nine patients, and twins and four unqualified urine specimens in five patients. The study included 200 effective cases (100 in each group). The groups’ ages and gestational weeks, as well as the fasting blood glucose, fasting insulin, and insulin resistance index, all of which were partially distributed, are shown in Table 1; the differences between the two groups were statistically significant. The results showed that the pre-pregnancy BMI in the GDM group was higher than in the normal group (P = 0.019), and there was no significant difference in weight gain during pregnancy between the two groups.
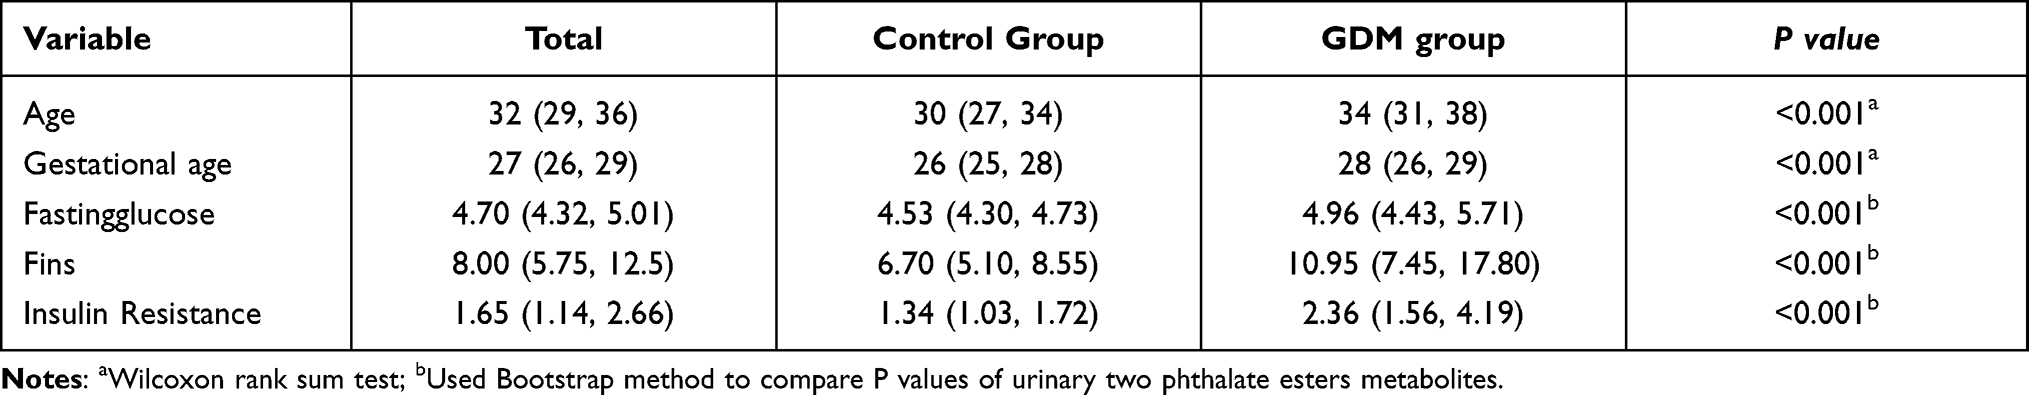 |
Table 1 The Basic Condition of Age, Gestational Age, Fasting Blood Glucose, Fasting Insulin and Insulin Resistance Index of the Two Groups |
Phthalate Metabolite Detection
In the present study, 11 PAE metabolites were detected in the urine samples of pregnant women. MOP and MiNP concentrations were below the LOD and did not enter the analysis. The MiBP, MBP, MEOHP, and MECPP concentrations were 100%, the MEHP, MEP, MMP, and MBzP concentrations were 40.5–99.5%, and the MCHP, MOP, and MiNP detection rates were as low as 10%, 0.5%, and 0.5%, respectively.
In the Guangzhou area, the highest concentration of PAE metabolites in the urine of pregnant women was MBP at 107.81 μg/L (52.34–208.63), and MCHP of 0.33 μg/L (0.24–0.58) was the lowest.
The MEHP and MECPP concentrations were higher in the GDM group than in the control group; the difference was statistically significant (P < 0.05, Table 2).
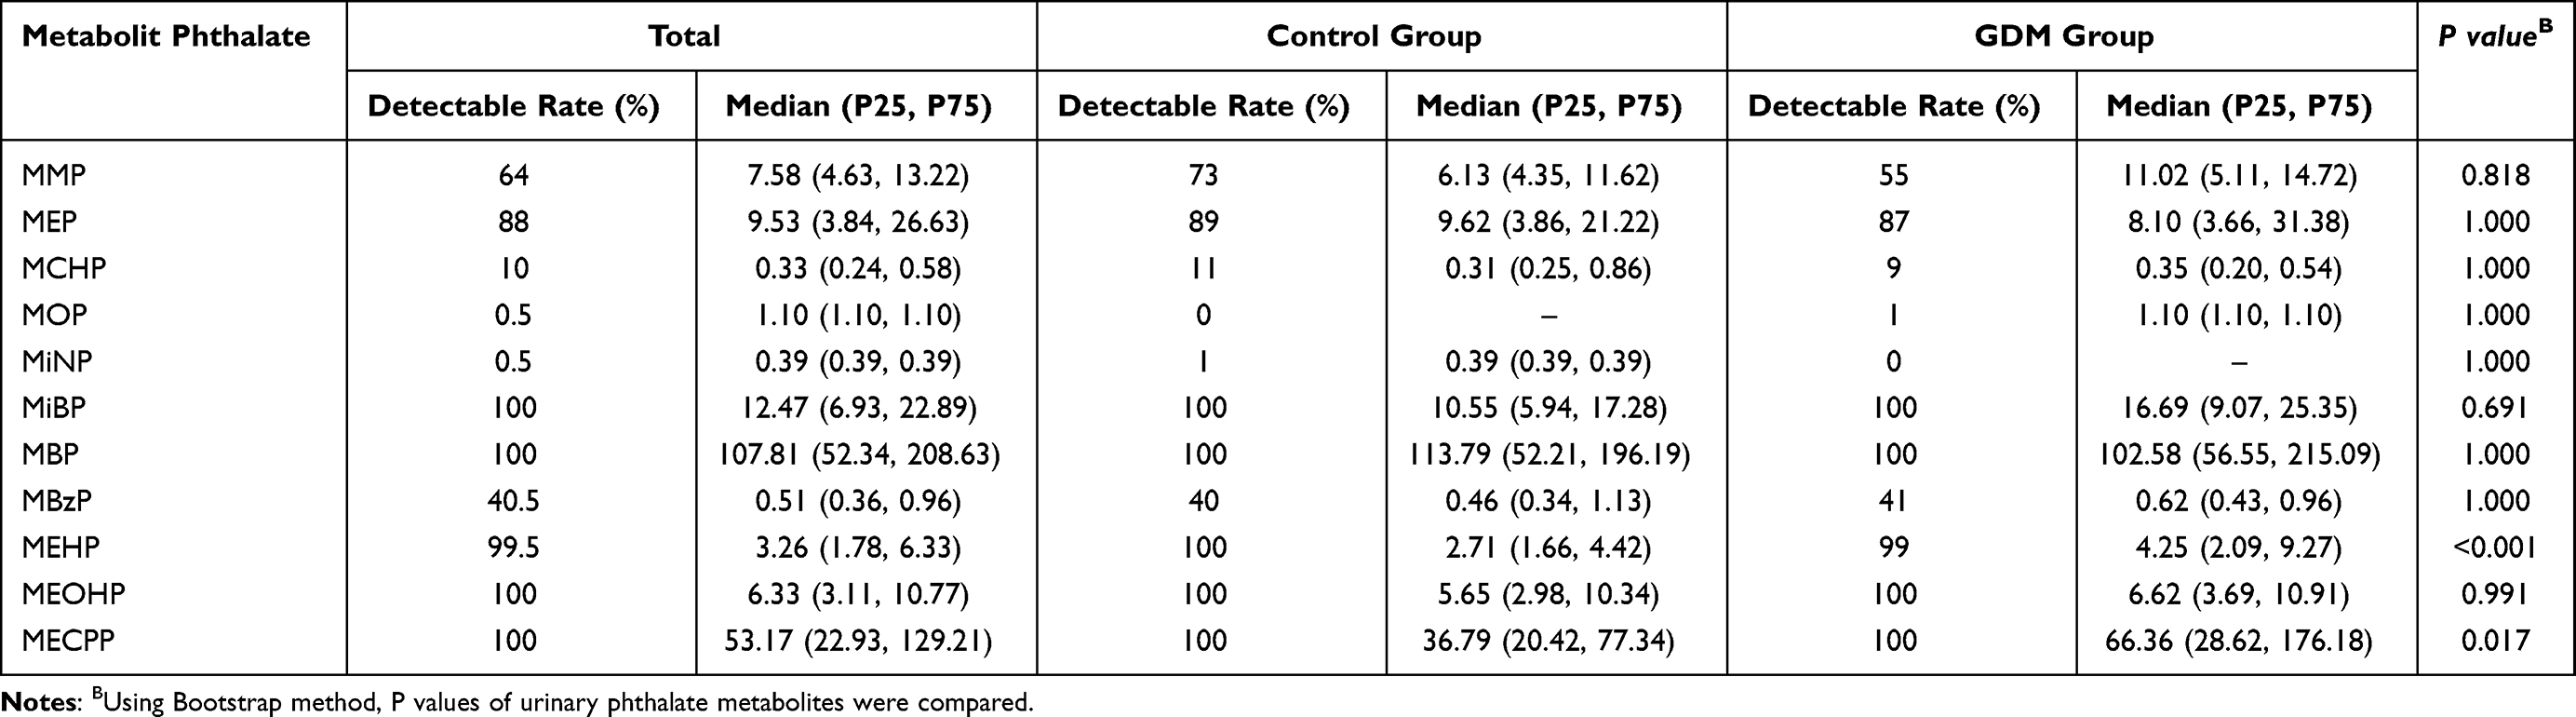 |
Table 2 Detection of Urinary Phthalate Two Formic Acid Metabolites in Pregnant Women in Guangzhou Area (mu g/L) |
Correlations of Fasting Plasma Glucose, Fasting Insulin, and Insulin Resistance Index with Urinary Metabolites of Two Phthalate Esters
Spearman correlation analysis showed that the blood glucose levels in pregnant women was correlated with MiBP, MEOHP, and MECPP concentrations (P < 0.05); the correlation coefficient (R) was 0.17–0.20. The results further showed a correlation between fasting insulin and MMP, MEP, MiBP, and MECPP concentrations (P < 0.05) (R = 0.15–0.20) and between the insulin resistance index (RI) and MMP, MiBP, and MECPP concentrations (P < 0.05) (R = 0.17–0.24) (Table 3). The hypothesis is that there is a correlation between the metabolites of phthalate and GDM. The relationship between blood glucose, insulin resistance, and the metabolites of phthalate was verified by Spearman correlation analysis.
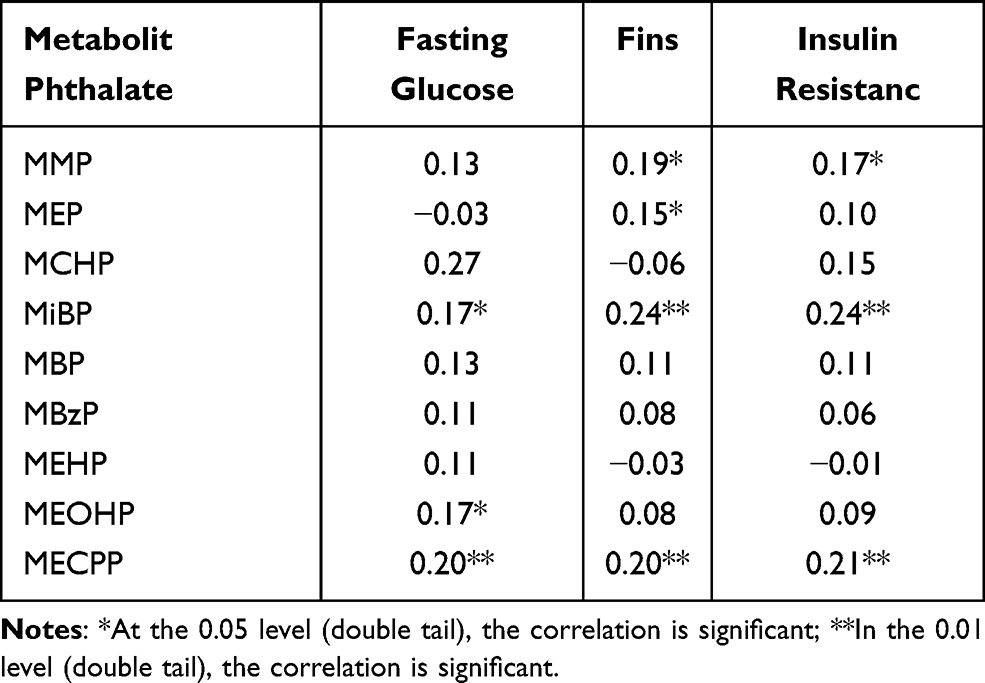 |
Table 3 Correlation Between Fasting Blood Glucose, Fasting Insulin, Insulin Resistance Index and Urinary Phthalate Two Formate Metabolites |
Relationship Between GDM Occurrence and Phthalate Metabolite Levels
According to univariate analysis, a total of five statistically significant independent variables were selected for multivariate logistic regression analysis. Finally, the factors entering the regression model were age, gestational age, pre-pregnancy BMI, MEHP, and MECPP. The probabilistic prediction map was made.
The logarithm of phthalate metabolites did not change the nature and correlation of the data but compressed the scale of the variable. It made the data more stable and weakened the collinearity and heteroscedasticity of the model. MEHP and MECPP had a natural logarithmic conversion before entering the model. The risk of GDM is increasing in older pregnant women (35 years or older). It reflects the changing trend of GDM with the increase of MEHP and MECPP when the age of pregnant women and gestational age are balanced.
The OR values showed that GDM was closely related to age, pre-pregnancy BMI, and MEHP (OR value >1). The difference between the two groups was statistically significant (P < 0.05), as shown in Table 4.
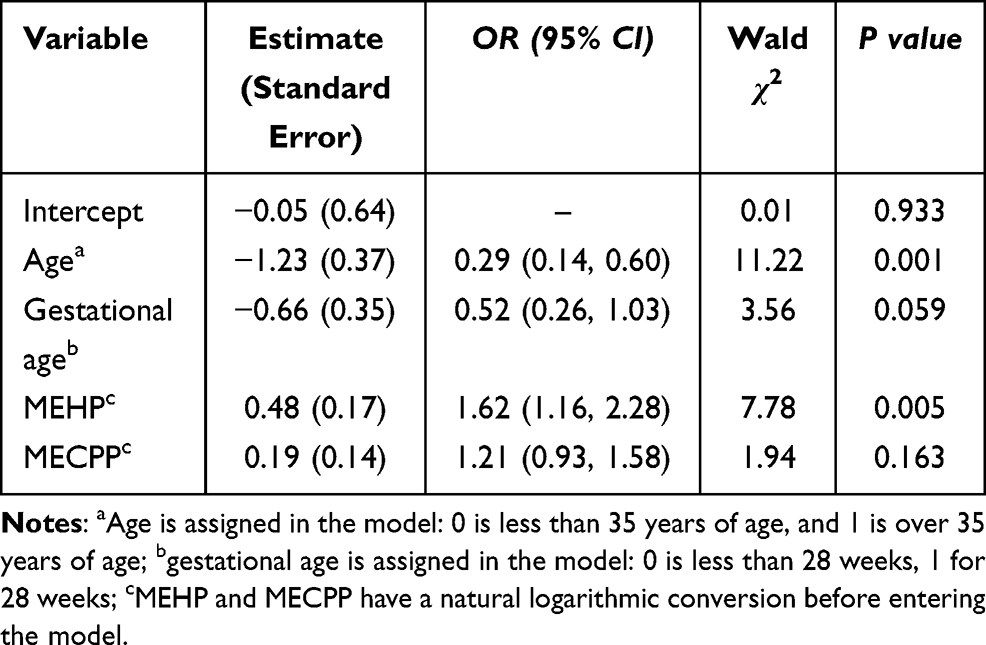 |
Table 4 Multivariate Logistic Regression Model for Gestational Diabetes Mellitus |
The relationship between blood glucose, insulin resistance, and the metabolites of phthalate can be verified by Spearman correlation analysis. The logistic model and probability prediction chart (Figure 2) showed that the risk of GDM rose with the increase of age over 35 years old and BMI, but the change of GDM incidence in pregnant women with gestational ages >28 weeks and ≤28 weeks were similar (P = 0.059). After adjusting for age, pre-pregnancy BMI, and gestational age, the incidence of GDM increased with the rise of MEHP and MECPP, but the effect of MECCP on GDM was not statistically significant.
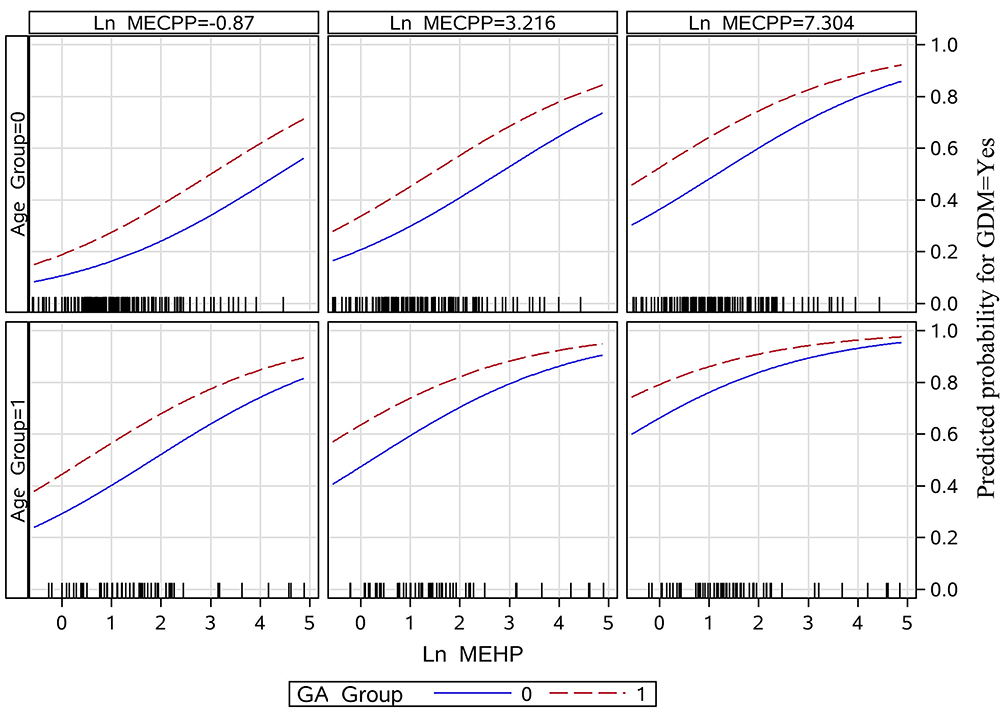 |
Figure 2 Dose relationship between GDM and the concentration of obenzoic acid two metabolites. Age Group: 0 means ≤ 35 years old, 1 means > 35 years old; 0 means > 28 weeks, 1 means ≤ 28 weeks; Ln MEHP and Ln Mecpp are the data after the natural logarithm conversion between MEHP and mecpp, LN. The minimum value of MECPP is −0.87, the interquartile spacing is 3.216, and the maximum value is 7.304; Adjusted by maternal BMI before pregnancy at 20.49. |
Discussion
GDM may have long-term effects on pregnant women and fetuses. Environmental chemicals may play an essential role in the occurrence and development of glycometabolism disorders during pregnancy. The present study aims to explore the association between phthalate exposure and the risk of GDM. This study showed that the risk of GDM rose with the increase of BMI and age over 35 years. The incidence of GDM in gestational age >28 weeks was similar to that in the GDM group (P = 0.059). The incidence rate of GDM was similar to that of gestational age. After adjusting for maternal age, pre-pregnancy BMI, and gestational age, the incidence rate of GDM rose with the increase of MEHP and MECPP, but the effect of MECPP on GDM was not statistically significant. This study suggests that MEHP, a metabolite of phthalate, is associated with the onset of GDM. It is consistent with the results of a foreign study. Fisher et al21 investigated the relationship between maternal serum phthalate metabolite levels at 10 ~ 17 weeks of pregnancy and blood glucose homeostasis at 28 weeks in the UK. They observed an obvious nonlinear correlation between serum MiBP and GDM, and serum MEHP, mono(carboxyisooctyl) phthalate (MCiOP), and MEHP/MECPP ratios were positively correlated with blood glucose levels 2h after a meal. This study reminds women preparing for pregnancy to avoid exposure to products containing MEHP.
Plasticizer Exposure in Pregnant Women in Guangzhou
A total of 11 phthalate metabolite types were detected in all collected samples. The first six were MiBP, MBP, MEOHP, MECPP, MEP, and MEHP, with an 88–100% incidence rate. The metabolites with lower yields were MCHP, MOP, and MiNP, with incidence rates of 10%, 0.5%, and 0.5%, respectively. This shows that pregnant women in Guangzhou are generally exposed to PAEs, which is related to Guangdong’s large manufacturing province, developed economy, wide exposure to PAEs in the environment, and serious environmental PAE pollution and high content in the Pearl River Delta. These results are consistent with the results of foreign studies. Studies in Korea, Mexico, Puerto Rico, and Japan found that PAE metabolites can be detected in the urine of >90% of pregnant women.22–25 Taiwan and the United States have also reported that the PAE metabolite detection rate in pregnant women ranges from 79–100%.26,27 In Poland, PAEs can be detected in ≥49% of pregnant women.28 In Guangzhou, the MEP, MBP, MEHP, and MEOHP detection rates in pregnant women were consistent with the detection rates of women in Maanshan and Shanghai (all fluctuating between 88% and 100%).29,30 The test result consistency regarding the high PAE metabolite detection rates indicates that women worldwide are extensively exposed to PAEs during pregnancy. In the present study, the highest measured concentration of urinary PAE metabolites in pregnant women was 107.81 μg/L (52.34–208.63), which was consistent with the results of studies by Zhang et al30 and Zhu et al.31 In Guangzhou, the MBP prevalence in pregnant women was 52 μg/L (24.51–121.46) compared with Maanshan. In Jiangsu, the MBP concentration in two-year-old subjects was 39.3 μg/L (24.82–104.10). MBP is a metabolite of di-n-butyl phthalate, which is mainly found in personal care products. The varying concentration detected in the two above-mentioned places may be related to the plasticizer amount in pregnant women. Pregnant women in different countries have different PAE metabolite exposure levels; ethnic and social differences could be the explanation for this. Differences in product-type use may also result in varying exposure levels of different PAE types.32 Another reason could be urine collection timing differences. The concentration of many PAE metabolites is highest before 9:00 AM, subsequently falling between 9:00 AM and 11:59 AM. The concentration rises between 3:00 PM and 8:00 PM, reaching another concentration high on the same day.33 In order to facilitate the collection of biological samples and increase the response rate, the urine sample of pregnant women in this study was collected simultaneously with the fasting blood sample, as the urine sampling time for most pregnant women was before 9:00 AM.
Correlation of Fasting Blood Glucose, Fasting Insulin, and Insulin Resistance Index with Urinary PAE Metabolite Concentrations in the Two Groups
The fasting blood glucose of pregnant women was correlated with the MiBP, MEOHP, and MECPP concentrations, the fasting insulin was correlated with the MMP, MEP, MiBP, and MECPP concentrations, the insulin resistance index was correlated with the MMP, MiBP, and MECPP concentrations, and the fasting blood glucose, fasting insulin, and insulin resistance index of pregnant women were related to urine MMP, MEP, MiBP, MECPP, and MEOHP concentrations. The maternal plasticizer exposure level may be related to GDM incidence.
GDM is similar to T2DM, which is insulin resistance and islet dysfunction. A study on older subjects in foreign countries shows that MMP and MEP increase the prevalence of T2DM, suggesting that plasticizer metabolites may interfere with the occurrence of diabetes through interference with glucose metabolism. The results of this study show that the insulin resistance index is associated with GDM, which confirms that its pathogenesis is related to insulin resistance.34
Dose Relationship Between GDM and the Concentration of Phthalate
The bootstrap method was used to compare the metabolite concentration differences among the two groups. The ages, gestational ages, MEHPs, and MECPPs with statistically significant differences were applied to the multivariate regression model. The logistic regression model and probability map showed an increase in MEHP concentration and a statistically significant increase in GDM incidence (P < 0.05). In this study, we found that higher concentrations of the MEHP metabolite, a metabolite commonly detected in pregnant women, were significantly associated with GDM incidence.
The results of a glucose tolerance analysis in 123 patients with obesity by Dirinck et al13 showed that phthalate metabolites could increase insulin resistance, decrease insulin sensitivity, and destroy beta-cell function.
The results of a study on intrauterine and adolescent PAE exposure and its metabolic indicators suggested that DEHP exposure in adolescent women is associated with higher IGF-1 levels and insulin secretion.35 Animal experiments by Rajesht et al found that DEHP exposure during pregnancy can affect insulin signaling by influencing key gene expression in the insulin signaling pathway, making the offspring more susceptible to glucose metabolism disorders.36 Studies by Rajesh et al37 and Srivasan et al38 showed that in adult rats, DEHP was followed by insulin signal transduction, glucose uptake, and a gastrocnemius muscle and adipose tissue oxidation disturbance, which eventually led to the formation of a glucose metabolism disorder. Phthalate exposure often leads to obesity and insulin resistance; this may be related to the fact that obesity is the greatest risk factor for insulin resistance.39 The results of 560 senior volunteers showed that DEHP caused an increase in insulin resistance and oxidative stress products and that the imbalance of oxidative stress products and antioxidants may play an essential role in insulin signal bypass induction. These results suggest that phthalate ester exposure can lead to insulin signal transduction and glucose oxidative damage in vivo, resulting in decreased serum insulin levels and elevated blood glucose levels.40,41 Studies have shown that phthalate exposure can lead to insulin signaling and glucose oxidative damage in the body, which results in decreased serum insulin levels and elevated blood glucose levels.
Strengths and Limitations
The strength of this study is to detect the relationship between GDM and the metabolites of phthalate formates by detecting eleven metabolites of o-phenyl two formates in the urine of pregnant women. The limitations of this study were that the data sample size was small, and the creatinine concentration was not detected and corrected this time.
Conclusion
Overall, the study has added to the literature on the relationship between phthalates and glucose intolerance during pregnancy; in particular, it has provided additional data supporting the link between MEHP and GDM. The relationship between plasticizer metabolite levels and GDM incidence was investigated by measuring the exposure levels of phthalates, fasting blood glucose, fasting insulin, and insulin resistance in pregnant women. Although animal and population studies have shown that PAE exposure can affect glucose metabolism and, thus, affect GDM occurrence, the mechanism of PAEs affecting glucose metabolism still requires further study. The present study has found that DEHP concentration and GDM are in a dose-increasing relationship. It has also been found that this may be caused by DEHP interfering with insulin signal bypass inducement and that the role of transduction leads to diabetes. Martínez-Ibarra41 reported in 2019 first-time correlations between urinary levels of some phthalates and miRNA expression levels linked to GDM. Further studies are needed to confirm these findings and explore associations between gestational exposure to phthalates and the risk of developing GDM.
As an environmental endocrine disruptor, plasticizers have been proven to be harmful by a large number of studies. These results suggest that pregnant women should reduce contact with plasticizers to prevent an increase in pregnancy complications and adverse effects in both the fetus and mother.
Funding
We thank Dr. Hui-Ying Liang (Guangzhou Women and Children Medical Center) for his statistical programming support during the analysis and Dr. He-Xing Wang (Fudan university) for the coordination and processing of urine sample analyses. We are also grateful to the Pediatric Research Institute of Guangzhou Women and Children Medical Center (IP-2016-011) for funding the study team.
Disclosure
The authors declare that they have no competing interests.
References
1. Crinnion WJ. Toxic effects of the easily avoidable phthalates and parabens. Altern Med Rev. 2010;15:190–196.
2. Hauser R, Calafat AM. Phthalates and human health. Occup Environ Med. 2005;62:806–818. doi:10.1136/oem.2004.017590
3. Song SZ, Jia LH. [Advances on the effect of bisphenol A-a kind of environmental estrogen on male germ cells]. Pract Prev Med. 2013;20:1279–1280. Chinese.
4. Jiang L, Xu WP, Rui BB, Chen H. [Research advance in metabolism in vivo of DEHP and its toxicity mechanism]. China Pharm. 2015;24:1–4. Chinese.
5. Guo Y, Kannan K. A survey of phthalates and parabens in personal care products from the United States and its implications for human exposure. Environ Sci Technol. 2013;47:14442–14449. doi:10.1021/es4042034
6. Casas M, Valvi D, Ballesteros-Gomez A, et al. Exposure to Bisphenol A and phthalates during pregnancy and ultrasound measures of fetal growth in the INMA-sabadell cohort. Environ Health Perspect. 2016;124:521–528. doi:10.1289/ehp.1409190
7. Jia S, Sankaran G, Wang B, et al. Exposure and risk assessment of volatile organic compounds and airborne phthalates in Singapore’s Child Care Centers. Chemosphere. 2019;224:85–92. doi:10.1016/j.chemosphere.2019.02.120
8. Nakamura A, Osonoi T, Terauchi Y. Relationship between urinary sodium excretion and pioglitazone-induced edema. J Diabetes Investig. 2010;1:208–211.
9. Heudorf U, Mersch-Sundermann V, Angerer J. Phthalates: toxicology and exposure. Int J Hyg Environ Health. 2007;210:623–634. doi:10.1016/j.ijheh.2007.07.011
10. Giovanoulis G, Bui T, Xu F, et al. Multi-pathway human exposure assessment of phthalate esters and DINCH. Environ Int. 2018;112:115–126. doi:10.1016/j.envint.2017.12.016
11. Yang XS, Yang J, Xu J. [Research progress in relationship between endocrine disrupting chemicals and metabolic syndrome]. Pract Prev Med. 2016;23:247–249. Chinese.
12. Kuo CC, Moon K, Thayer KA, Navas-Acien A. Environmental chemicals and type 2 diabetes: an updated systematic review of the epidemiologic evidence. Curr Diab Rep. 2013;13:831–849. doi:10.1007/s11892-013-0432-6
13. Dirinck E, Dirtu AC, Geens T, Covaci A, Van Gaal L, Jorens PG. Urinary phthalate metabolites are associated with insulin resistance in obese subjects. Environ Res. 2015;137:419–423. doi:10.1016/j.envres.2015.01.010
14. Sun Q, Cornelis MC, Townsend MK, et al. Association of urinary concentrations of bisphenol A and phthalate metabolites with risk of type 2 diabetes: a prospective investigation in the Nurses’ Health Study (NHS) and NHSII cohorts. Environ Health Perspect. 2014;122:616–623. doi:10.1289/ehp.1307201
15. Haider R, Sudini L, Chow CK, Cheung NW. Mobile phone text messaging in improving glycaemic control for patients with type 2 diabetes mellitus: a systematic review and meta-analysis. Diabetes Res Clin Pract. 2019;150:27–37. doi:10.1016/j.diabres.2019.02.022
16. Robledo CA, Peck JD, Stoner J, et al. Urinary phthalate metabolite concentrations and blood glucose levels during pregnancy. Int J Hyg Environ Health. 2015;218:324–330. doi:10.1016/j.ijheh.2015.01.005
17. James-Todd TM, Meeker JD, Huang T, et al. Pregnancy urinary phthalate metabolite concentrations and gestational diabetes risk factors. Environ Int. 2016;96:118–126. doi:10.1016/j.envint.2016.09.009
18. Shapiro GD, Dodds L, Arbuckle TE, et al. Exposure to phthalates, bisphenol A and metals in pregnancy and the association with impaired glucose tolerance and gestational diabetes mellitus: the MIREC study. Environ Int. 2015;83:63–71. doi:10.1016/j.envint.2015.05.016
19. American Diabetes Association. Standards of medical care in diabetes–2014. Diabetes Care. 2014;37 Suppl 1:S14–80. doi:10.2337/dc14-S014
20. Arbuckle TE, Davis K, Marro L; MIREC Study Group. Phthalate and bisphenol A exposure among pregnant women in Canada–results from the MIREC study. Environ Int. 2014;68:55–65. doi:10.1016/j.envint.2014.02.010
21. Fisher BG, Frederiksen H, Andersson AM, et al. Serum phthalate and triclosan levels have opposing associations with risk factors for gestational diabetes mellitus. Front Endocrinol (Lausanne). 2018;9:99. doi:10.3389/fendo.2018.00099
22. Suzuki Y, Niwa M, Yoshinaga J, et al. Exposure assessment of phthalate esters in Japanese pregnant women by using urinary metabolite analysis. Environ Health Prev Med. 2009;14:180–187. doi:10.1007/s12199-009-0078-9
23. Ferguson KK, Cantonwine DE, Rivera-González LO, Loch-Caruso R, Mukherjee B. Urinary phthalate metabolite associations with biomarkers of inflammation and oxidative stress across pregnancy in Puerto Rico. Environ Sci Technol. 2014;48:7018–7025. doi:10.1021/es502076j
24. Kim Y, Ha EH, Kim EJ, et al. Prenatal exposure to phthalates and infant development at 6 months: prospective Mothers and Children’s Environmental Health (MOCEH) study. Environ Health Perspect. 2011;119:1495–1500.
25. Téllez-Rojo MM, Cantoral A, Cantonwine DE, et al. Prenatal urinary phthalate metabolites levels and neurodevelopment in children at two and three years of age. Sci Total Environ. 2013;461–462:386–390. doi:10.1016/j.scitotenv.2013.05.021
26. Kobrosly RW, Evans S, Miodovnik A, et al. Prenatal phthalate exposures and neurobehavioral development scores in boys and girls at 6–10 years of age. Environ Health Perspect. 2014;122:521–528. doi:10.1289/ehp.1307063
27. Lien YJ, Ku HY, Su PH, et al. Prenatal exposure to phthalate esters and behavioral syndromes in children at 8 years of age: Taiwan Maternal and Infant Cohort Study. Environ Health Perspect. 2015;123:95–100. doi:10.1289/ehp.1307154
28. Polanska K, Ligocka D, Sobala W, Hanke W. Phthalate exposure and child development: the Polish Mother and Child Cohort Study. Early Hum Dev. 2014;90:477–485. doi:10.1016/j.earlhumdev.2014.06.006
29. Zhang YW, Gao H, Huang K, Xu YY, Sheng J, Tao FB. [A cohort study on association between the first trimester phthalates exposure and fasting blood glucose level in the third trimester]. Chin J Epidemiol. 2017;38:388–392. Chinese.
30. Zhang MR, Qiu JY, Wang L, Li SG, Chen B. [Cumulative risk assessment of phthalates exposure among infants and their mothers in Shanghai]. J Hyg Res. 2017;46:237–243. Chinese.
31. Zhu XN, Jin YE, Wu CH, et al. [Phthalate exposure levels and their influencing factors in 2-year-old children in a certain area]. J Environ Occup Med. 2013;30:405–410. Chinese.
32. Wittassek M, Angerer J. Phthalates: metabolism and exposure. Int J Androl. 2008;31:131–138. doi:10.1111/j.1365-2605.2007.00837.x
33. Cantonwine DE, Cordero JF, Rivera-González LO. Urinary phthalate metabolite concentrations among pregnant women in Northern Puerto Rico: distribution, temporal variability, and predictors. Environ Int. 2014;62:1–11. doi:10.1016/j.envint.2013.09.014
34. Lind PM, Zethelius B, Lind L. Circulating levels of phthalate metabolites are associated with prevalent diabetes in the elderly. Diabetes Care. 2012;35:1519–1524. doi:10.2337/dc11-2396
35. Watkins DJ, Peterson KE, Ferguson KK, Mercado-García A. Relating phthalate and BPA exposure to metabolism in peripubescence: the role of exposure timing, sex, and puberty. J Clin Endocrinol Metab. 2016;101:79–88. doi:10.1210/jc.2015-2706
36. Rajesh P, Balasubramanian K. Phthalate exposure in utero causes epigenetic changes and impairs insulin signalling. J Endocrinol. 2014;223:47–66. doi:10.1530/JOE-14-0111
37. Rajesh P, Sathish S, Srinivasan C, Selvaraj J, Balasubramanian K. Phthalate is associated with insulin resistance in adipose tissue of male rat: role of antioxidant vitamins. J Cell Biochem. 2013;114:558–569. doi:10.1002/jcb.24399
38. Srinivasan C, Khan AI, Balaji V, Selvaraj J, Balasubramanian K. Diethyl hexyl phthalate-induced changes in insulin signaling molecules and the protective role of antioxidant vitamins in gastrocnemius muscle of adult male rat. Toxicol Appl Pharmacol. 2011;257:155–164. doi:10.1016/j.taap.2011.08.022
39. Arnlöv J, Sundström J, Ingelsson E, Lind L. Impact of BMI and the metabolic syndrome on the risk of diabetes in middle-aged men. Diabetes Care. 2011;34:61–65. doi:10.2337/dc10-0955
40. Kim JH, Park HY, Bae S, Lim YH, Hong YC. Diethylhexyl phthalates is associated with insulin resistance via oxidative stress in the elderly: a panel study. PLoS One. 2013;8:e71392. doi:10.1371/journal.pone.0071392
41. Martínez-Ibarra A, Martínez-Razo LD, Vázquez-Martínez ER, et al. Unhealthy levels of phthalates and Bisphenol A in mexican pregnant women with gestational diabetes and its association to altered expression of miRNAs involved with metabolic disease. Int J Mol Sci. 2019;20:3343. doi:10.3390/ijms20133343
 © 2022 The Author(s). This work is published and licensed by Dove Medical Press Limited. The full terms of this license are available at https://www.dovepress.com/terms.php and incorporate the Creative Commons Attribution - Non Commercial (unported, v3.0) License.
By accessing the work you hereby accept the Terms. Non-commercial uses of the work are permitted without any further permission from Dove Medical Press Limited, provided the work is properly attributed. For permission for commercial use of this work, please see paragraphs 4.2 and 5 of our Terms.
© 2022 The Author(s). This work is published and licensed by Dove Medical Press Limited. The full terms of this license are available at https://www.dovepress.com/terms.php and incorporate the Creative Commons Attribution - Non Commercial (unported, v3.0) License.
By accessing the work you hereby accept the Terms. Non-commercial uses of the work are permitted without any further permission from Dove Medical Press Limited, provided the work is properly attributed. For permission for commercial use of this work, please see paragraphs 4.2 and 5 of our Terms.