")
Back to Journals » International Journal of General Medicine » Volume 14
Association Between Neutrophil-Lymphocyte Ratio and All-Cause Mortality and Cause-Specific Mortality in US Adults, 1999–2014
Authors Chen Y, Wang W , Zeng L, Mi K, Li N , Shi J, Yang S
Received 1 October 2021
Accepted for publication 2 December 2021
Published 22 December 2021 Volume 2021:14 Pages 10203—10211
DOI https://doi.org/10.2147/IJGM.S339378
Checked for plagiarism Yes
Review by Single anonymous peer review
Peer reviewer comments 4
Editor who approved publication: Dr Scott Fraser
Yang Chen, Wei Wang, Lizhong Zeng, Ke Mi, Na Li, Jie Shi, Shuanying Yang
Department of Respiratory and Critical Care Medicine, The Second Affiliated Hospital of Xi’an Jiaotong University, Xi’an, Shaanxi, People’s Republic of China
Correspondence: Shuanying Yang
Department of Respiratory Medicine, The Second Affiliated Hospital, Xi’an Jiaotong University School of Medicine in Xi’an, Shaanxi, People’s Republic of China
Tel +86-13991392919
Email [email protected]
Background: Neutrophil-lymphocyte ratio (NLR) is a novel marker of inflammation. Emerging studies have evaluated the relationship of NLR with cardiovascular diseases and malignant conditions. However, rare studies regarded the association between NLR and long-term health status. This study aimed to evaluate the association of NLR with all-cause mortality and cause-specific mortality among adults in the United States.
Methods: We obtained eight cycles data of National Health and Nutrition Examination Surveys (NHANES) from 1999 to 2014, and enrolled 32328 participants after certain screening. By weighted chi-square test and linear regression analysis, we analyzed the correlation between NLR and baseline characteristics of the participants. Kaplan–Meier curves and Cox regression models were used to assess the survival relevance of NLR. We conducted stratified analysis, interaction analysis, and sensitivity analysis to robustness of our results.
Results: Participants with high NLR levels had a higher risk of death. After adjustment for baseline characteristics, the hazard ratio comparing the higher vs lower NLR levels was 1.43 (95% CI, 1.18– 1.73) for all-cause mortality, 1.27 (95% CI, 0.84– 1.92) for cancer mortality, and 1.44 (95% CI, 0.96– 2.16) for cardiovascular disease mortality. Stratified analysis found that the observed associations between NLR levels and mortality did not differ significantly.
Conclusion: In this nationally representative cohort of US adults, higher NLR was significantly associated with an increased risk of all-cause mortality.
Keywords: inflammation, lymphocyte, neutrophil, mortality
Introduction
Neutrophil-lymphocyte ratio (NLR) is the ratio of neutrophils to lymphocytes in the peripheral blood, which becomes a novel marker of systemic inflammation. NLR reflects the relative balance of myeloid and lymphocyte lineages, and is sensitive to the altered myelopoiesis.1
Previous studies have shown that high NLR level associated with unfavorable clinical outcomes in a variety of diseases. Emerging studies indicated that NLR is an effective predictor of prognosis, response to therapy, recurrence in various malignancies.2–10 Some studies have also shown that NLR associated with prognosis and treatment response in cardiovascular diseases.11–14 In addition, other researchers have found that NLR levels association with diagnosis and prognosis of infectious diseases such as community-acquired pneumonia,15 bacteremia, and sepsis.16–20 Elevated NLR also has been found in patients with chronic diseases including prediabetes and diabetes mellitus,21,22 autoimmune diseases,23,24 and metabolic syndrome.25 These evidence suggest NLR as a risk factor of various diseases, but the insufficient number of participants and the short follow-up period undermine the validity of the results. Only sparse cohort studies examined the association of NLR levels with long-term health outcomes. Moreover, whether NLR is associated with risk of mortality in the general population remains unclear.
Our study aimed to examined the association of NLR levels with long-term all-cause mortality among adults in the US general population, using a large nationally representative data set from the National Health and Nutrition Examination Survey (NHANES). In addition, we evaluated the associations of NLR levels with cancer mortality and cardiovascular diseases mortality.
Methods
Data Source
The NHANES collects health-related data on a nationally representative sample in the US. For each per 2-year cycles of the continuous NHANES, around 5000 participants from 15 counties in the US were selected. Data were obtained by in-home interview, physical examination, and laboratory tests. Our study used the data from the first 8 cycles of continuous NHANES, collected during the period from 1999 to 2014. The protocol of NHANES has been approved by the National Center for Health Statistics (NCHS) Ethics Review Board. Written informed consent was obtained from all participants before participation. And our study was approved by the ethics committee of School of Medicine, Xi’an Jiaotong University. The present analysis followed the Strengthening the Reporting of Observational Studies in Epidemiology (STROBE) reporting guideline.26
Participants
From 1999 to 2014, 82,091 NHANES participants were linked to National Death Index. We included 42,979 participants ≥20-year-old at the baseline survey. We excluded participants who did not have physical examination (n = 2109), who lacked data of baseline blood count (n = 2184), mortality data (n = 48), and study covariates (n = 6310): smoking status (n = 37), alcohol use (n = 2835), education (n = 55), marital status (n = 464), family income-poverty ratio level (n = 2846), body mass index (n = 49), self-reported health status (n = 23). Finally, 32,328 participants were enrolled in our cohort (Figure 1).
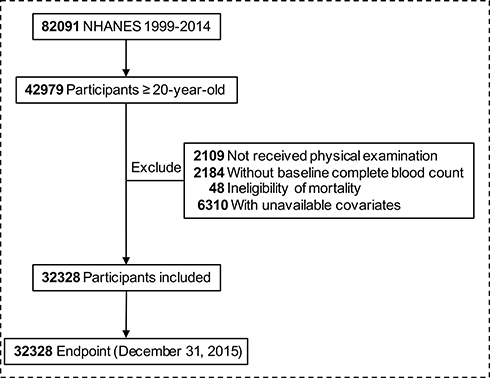 |
Figure 1 Flow chart of inclusion and exclusion of study participants. |
Assessment of NLR Exposure
Neutrophil and lymphocyte counts were obtained from the peripheral whole blood test following established protocol and procedures. Detailed operation process of the test can be found in Laboratory Procedure Manual for NHANES.27 The test reported neutrophil and lymphocyte counts in 1000 cells/μL. NLR was calculated by dividing the neutrophil count by the lymphocyte count. High NLR was defined as NLR ≥ 3.
Ascertainment of Deaths
Public-Use Linked Mortality Files were provided by the NCHS.28 We ascertained mortality status by matching the National Death Index (last followed up on 31 December 2015, updated in 2020) by the unique study identifier. Causes of deaths were determined according to the codes of international statistical classification of diseases (tenth revision).29 In the present study, primary outcome was mortality from all causes, cancers (C00-C97), and cardiovascular diseases (codes I00-I09, I11, I13, I20-I51, and I60-I69). We defined baseline at the time subjects had physical examinations. The person-years was calculated from baseline to death, loss to follow-up or December 31, 2015, whichever occurs first.
Assessment of Covariates
Information on covariates was collected through baseline questionnaires, including age, sex, race/ethnicity, education level, marital status, family income poverty ratio level, drinking and smoking status, body mass index, and self-reported general health. Race/ethnicity was classified into non-Hispanic white, non-Hispanic black, Mexican American, and others. In accordance with the NCHS classifications,30,31 the smoking status was divided into 3 categories – never smokers (who had smoked <100 cigarettes in lifetime at the time of survey), current smokers (who smoked >100 cigarettes in lifetime and still smoke), and former smokers (who had smoked >100 cigarettes but stopped smoking). Alcohol drinking was categorized as non-drinker (less than 12 alcohol drinks/lifetime), and drinker (≥12 alcohol drinks/lifetime).30 A family’s income-poverty ratio (PIR) is calculated by dividing family income by a poverty threshold. A higher PIR indicates a higher income. We categorized PIR into three groups (0–1.0, 1.1–2.9, ≥3.0). Body mass index (BMI) was calculated as individual’s weight (kg) divided by the square of height (m2).
Statistical Analysis
Our study followed the analytic guideline by NHANES to account for the complex survey design factors, including sample weights, clustering, and stratification. Data were presented as mean± standard deviation (SD) for continuous variables and as numbers (percentages) for categorical variables. The statistical differences between groups of NLR were tested by weighted chi-square test and linear regression model for categorical variables and continuous variables, respectively. We used Kaplan–Meier analysis and Cox regression models to estimate the hazard ratios and corresponding 95% confidence intervals for associations.
We conducted stratified analyses and interaction analyses by age, gender, race/ethnicity, smoking status, BMI to evaluate whether the associations were different. In addition, we did a series of sensitivity analyses to further test the robustness of the results. Firstly, risk estimates were additionally adjusted by putting baseline history of cancer, diabetes, chronic kidney disease, cardiovascular diseases, hypertension, hyperlipemia, and chronic obstructive pulmonary diseases in the fully adjusted model. Secondly, we excluded participants with the extreme 1% of the NLR ratio to reduce the influence of underlying malignancies or other severe disease states. Thirdly, we removed participants with follow-up time of less than 35 months. Fourthly, we excluded participants with severe illnesses such as diabetes, cardiovascular disease, or cancer in order to minimize potential reverse causation.
All statistical analyses were performed on R software, version 3.6.3 (The R Foundation, Vienna, Austria). A two-sided P value <0.05 was considered statistically significant.
Results
Sample Characteristics
Table 1 shows the baseline characteristics of the participants. Among the 32,328 participants, the weighted mean [SE] age at baseline was 47.4 [16.5] years; 16,484 (51.4%) were women; 16,013 (72.0%) were white. During 254,580 person-years of follow-up (median, 7.5 years; maximum, 16.8 years), 4092 deaths occurred in total, including 884 deaths from cancer and 904 deaths from cardiovascular disease. Compared with the low-NLR group, people with higher NLR were more likely to be older, men, non-Hispanic white, and have lower educational level, lower family income, lower BMI; they more likely to report baseline history of cancer, diabetes, chronic kidney disease, cardiovascular diseases, hypertension, chronic obstructive pulmonary diseases; they less likely to non-smokers, married and to report very good to excellent health status.
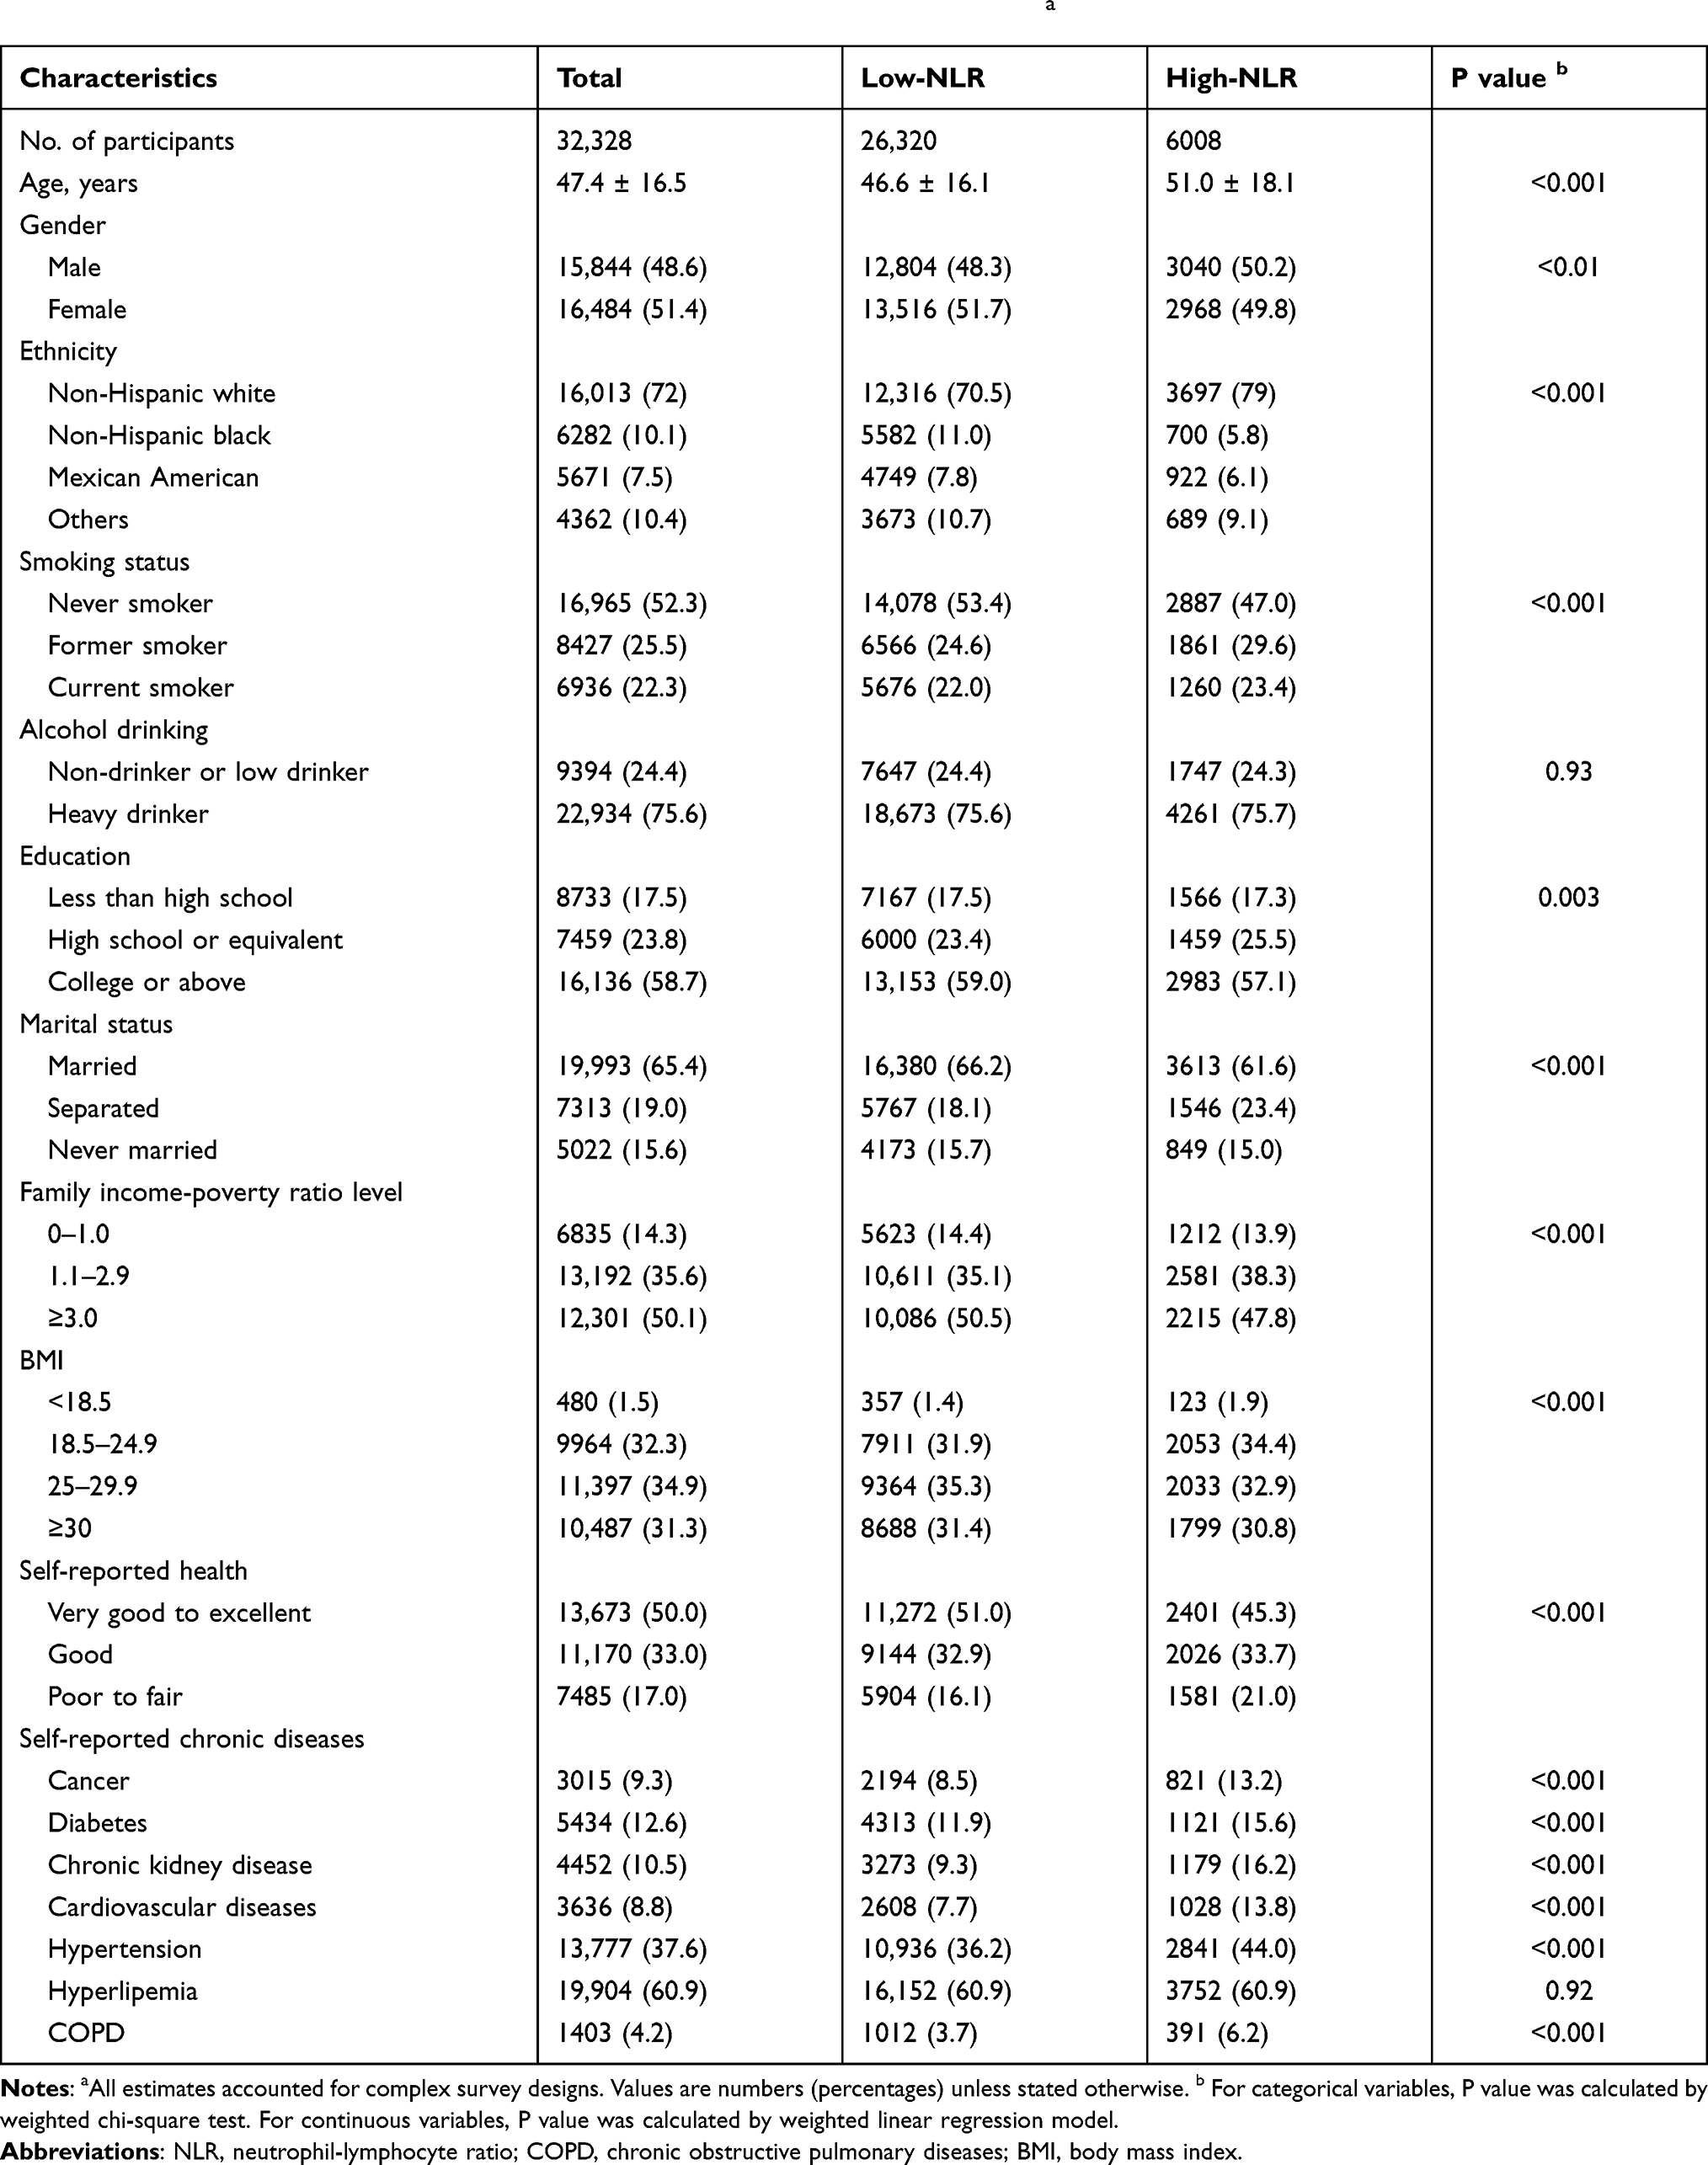 |
Table 1 Baseline Characteristics of Study Participants According to NLR Levels a |
Survival Analysis
During 254,580 person-years of follow-up (median, 7.5 years; maximum, 16.8 years), 4092 deaths occurred in total, including 884 deaths from cancer and 904 deaths from cardiovascular disease. Kaplan–Meier curves revealed that all-cause mortality was significantly elevated among high-NLR group versus low-NLR group (Log rank test P < 0.001) (Figure 2). In unadjusted Cox proportional hazards regression models, the hazard ratio (HR) of high-NLR group reached 2.20 (Non-adjusted model in Table 2). After adjustment for age and gender, high-NLR group still had higher risk of all-cause mortality (HR 1.53, Model 1 in Table 2). In the fully adjusted model including demographic characteristics, socioeconomic status, lifestyle factors, BMI, and health status, hazards of all-cause death remained elevated in high-NLR group (Model 3 in Table 2). We observed similar results for mortality from cancer (HR, 1.27 [95% CI, 0.84–1.92]) and cardiovascular disease (HR, 1.44 [95% CI, 0.96–2.16]), although those associations were not statistically significant (Table 2).
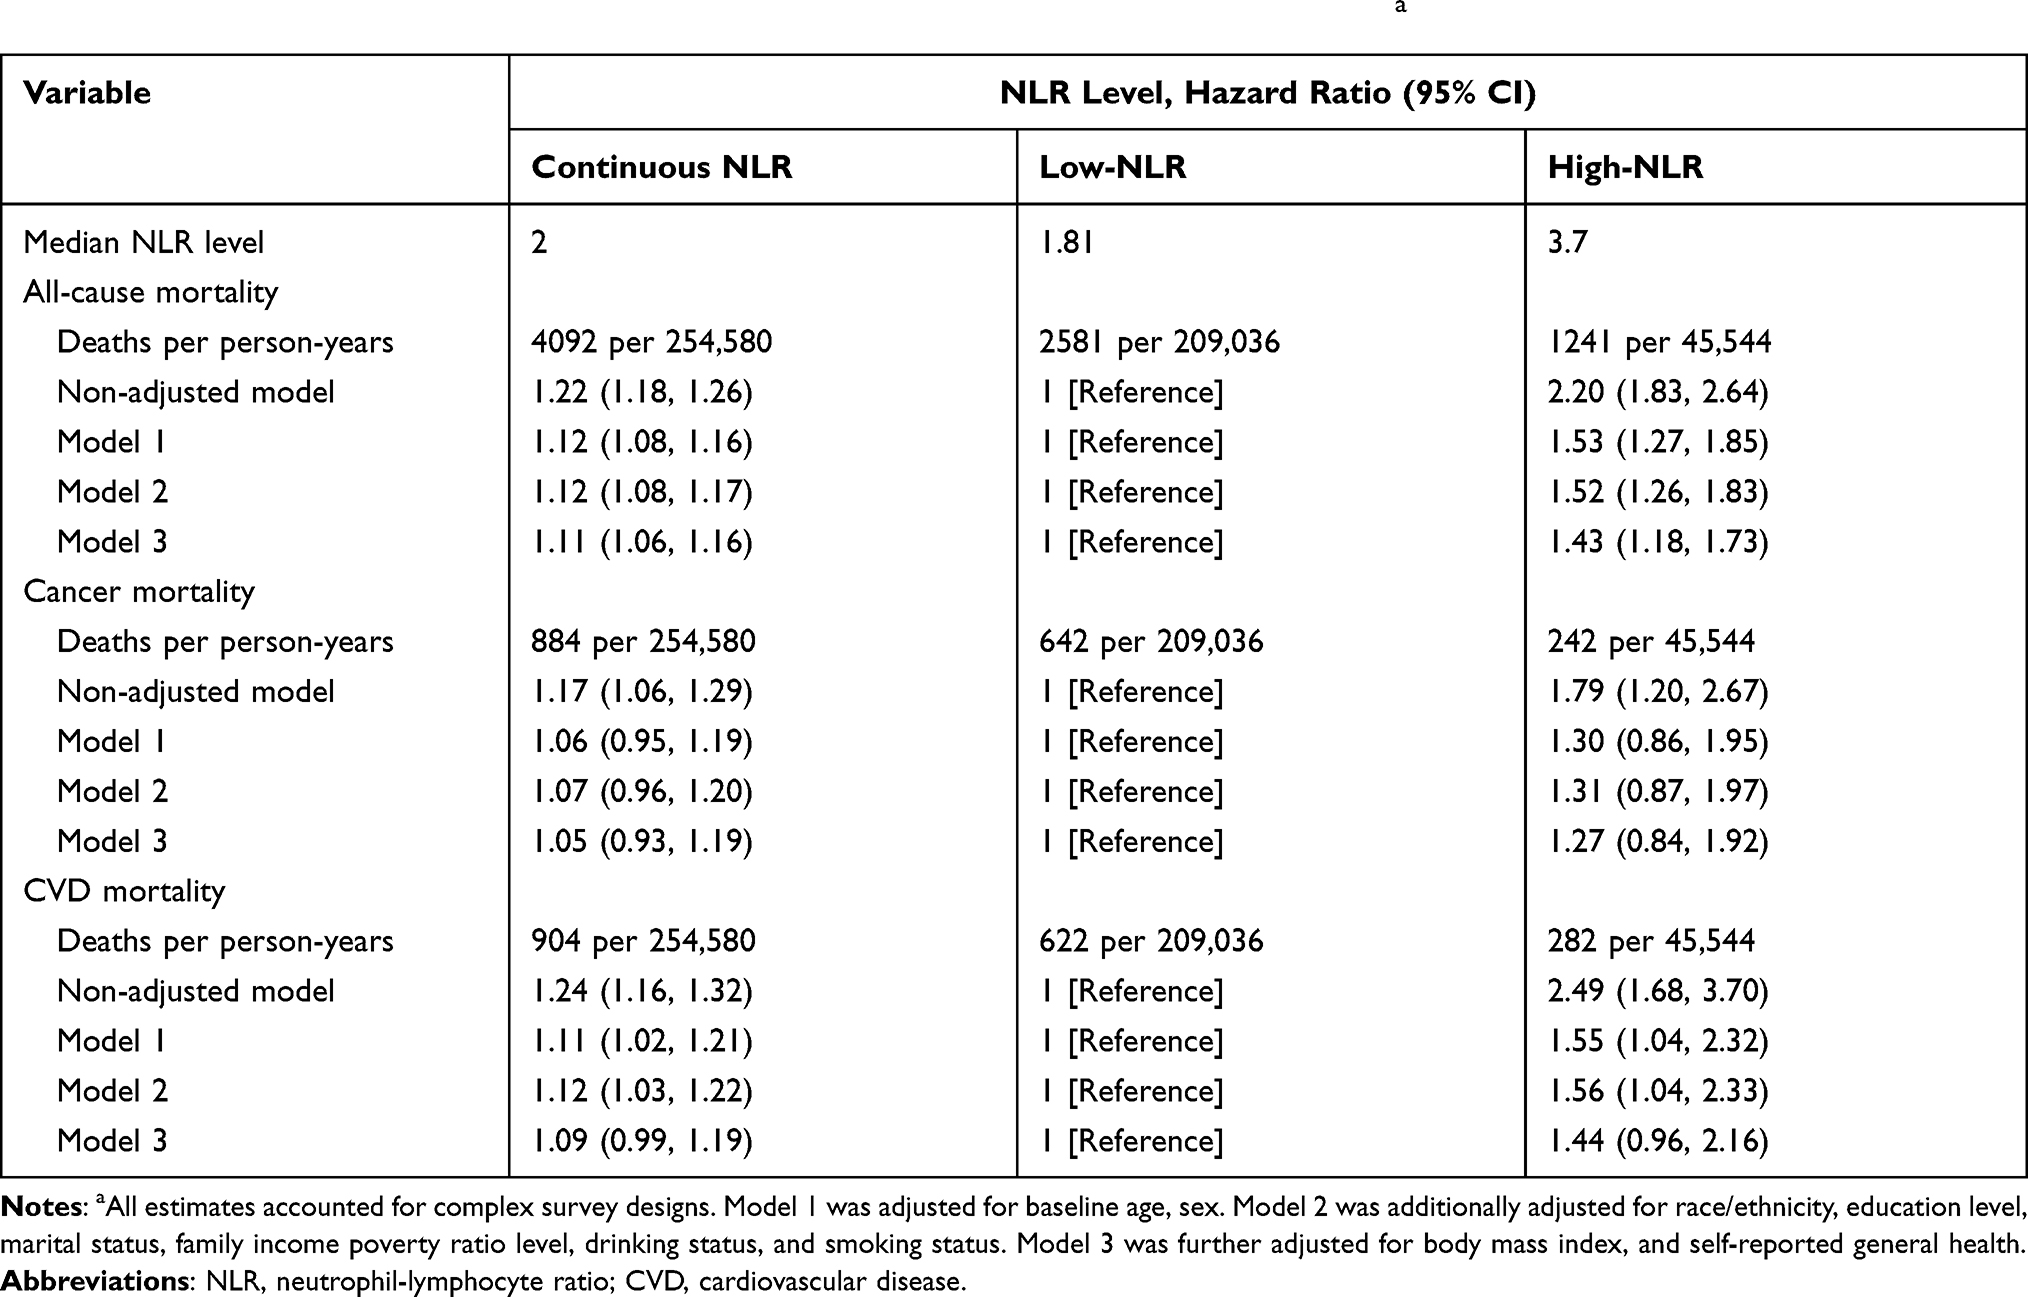 |
Table 2 Association of NLR Levels with All-Cause Mortality and Cause-Specific Mortality a |
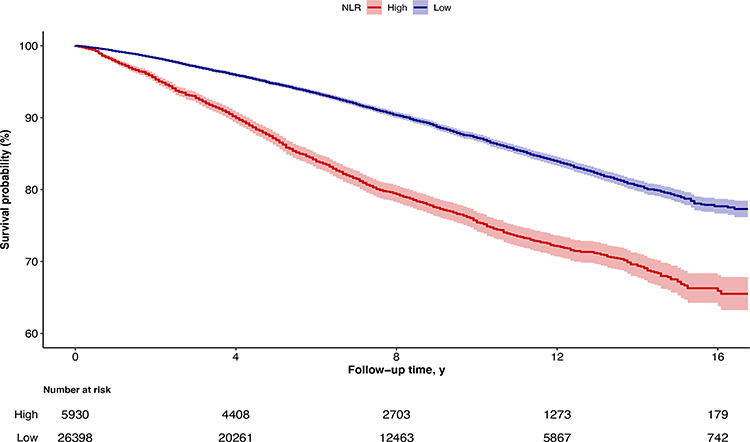 |
Figure 2 Kaplan-Meier Curves for Survival Probability, with Follow-up in Years. Survival according to NLR levels was determined using Kaplan Meier curves. Participants with higher NLR levels (NLR ≥3, red line) had unfavorable prognosis compared with those with lower (NLR < 3, blue line). |
Subgroup and Sensitivity Analyses
In the stratified analysis, the observed associations between NLR levels and mortality were not significantly different in age, gender, race/ethnicity, or BMI (Table 3; eTables 1 and 2 in the Supplement). In the sensitivity analyses, further adjusting for baseline comorbidities, the significant associations of NLR levels with all-cause mortality remained. The results were still unchanged when we excluded participants with the extreme 1% of the NLR ratio, excluded those with follow-up time less than 35 months, and excluded those with prevalent cancer, diabetes, and cardiovascular disease in baseline (eTable 3 in the Supplement). Similar sensitivity analysis results were observed for cancer mortality and cardiovascular disease mortality (eTables 4 and 5 in the Supplement).
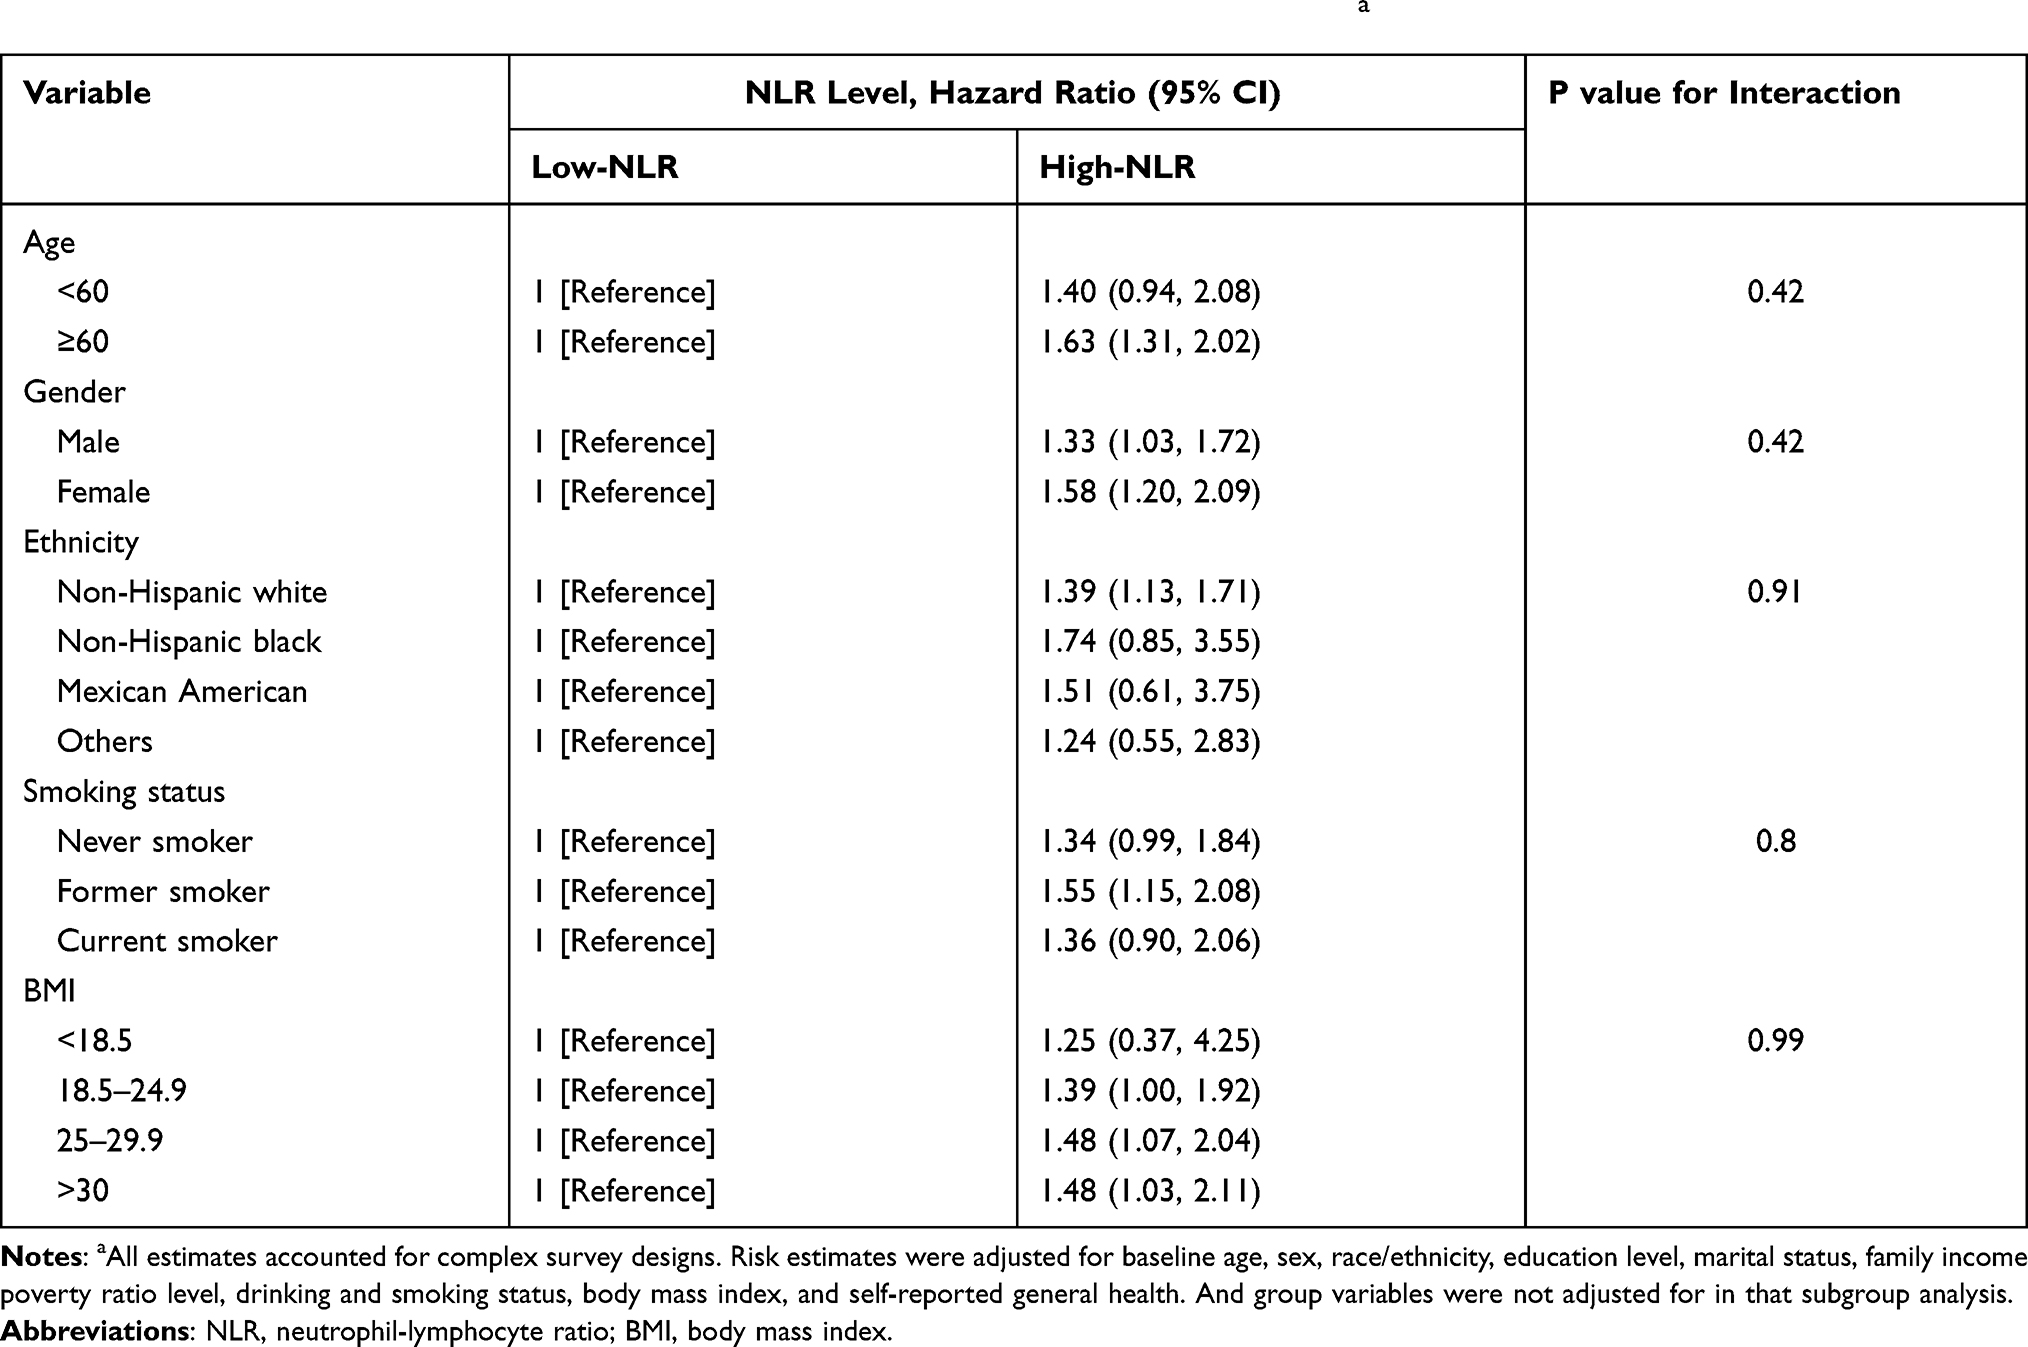 |
Table 3 Stratified Analyses for the Association of NLR Levels with All-Cause Mortality a |
Discussion
This study determined the association of NLR levels with all-cause and cause-specific mortality in US adults. In a cohort of US nationally representative sample, we found a robust association between all-cause mortality and NLR levels in adults. High-NLR group had a high risk of all-cause mortality. The association remained significant after taking account of demographic characteristics, lifestyle factors, socioeconomic status, and BMI. Overall, this study demonstrates that a high NLR is associated with high risk of all-cause mortality in the US general population.
Mounting evidence suggests that NLR had relation with unfavorable clinical outcomes in patients with cardiovascular diseases, malignancies, and other chronic inflammatory diseases.4,5,11,12,23 In the general population, our results show that elevated NLR is associated with high risk of all-cause mortality. The association remains after excluding participants with cancer, diabetes or cardiovascular diseases at baseline in the sensitivity analyses (eTable 3). However, note that a higher NLR is statistically nonsignificant associated with mortality of specific causes including cardiovascular disease and cancer in our study. The reason may be that we did not have data on incident cancer, incident cardiovascular event, or site-specific cancer mortality. And we just evaluated the NLR levels with long-term outcomes in patients with cancer or cardiovascular disease. Herein, more studies are still needed to examine the associations between NLR levels and risk of cardiovascular disease and cancer.
In the presence of systemic inflammation, molecules or cellular components in the peripheral blood alter accordingly. Indicators for assessing the systemic inflammation have received increased attention and are valuable for predicting clinical outcomes in practice.32–34 The previous studies reported that C-reactive protein may be a death prognosis factor in general people35 and in patients with cardiovascular disease,35,36 lung cancer,37 or colorectal cancer.38 Erythrocyte sedimentation rate is also a potential marker for mortality in general people39 and in patients with nontuberculous mycobacterial pulmonary disease.40 Other researchers reported that complete blood cell count range and albumin levels were associated with outcomes.41 Compared with the above indicators, NLR is inexpensive, easily available, and potentially modifiable. So NLR may be an attractive marker for systemic inflammation status in medical screening setting.
Our study has some strengths. We used the generalizability of NHANES data that contained a nationally representative sample, which enables us to generalize our findings to a broader population. Another strength of this research is that we adjusted for a variety of potential confounders, including demographic status, lifestyle factors, socioeconomic status, and BMI. Finally, our research spans a longer follow-up period (median, 7.5 years).
Our study also has limitations. Firstly, this study is limited by its observational design. Although we adjusted for many potential confounders and the cohort represents a large sample, residual confounding, especially by unmeasured variables, cannot be excluded. Secondly, we obtained the death data by acquiring the National Death Index. Due to the incomplete linkage some biases could be introduced.42,43 Thirdly, whether these associations remained for hospitalized patients also warrants additional investigation. Fourthly, because this study only examined baseline NLR, and did not investigate patterns of change in NLR nor its impact on mortality, the results may have been biased in interpretation. Longitudinal studies can be further implemented to make up this limitation.
This study only analyzed the baseline NLR, and did not investigate the change pattern of NLR nor its influence in mortality, which may lead to a potential bias in the interpretation of the present results.
Conclusions
Our findings suggested that elevated NLR significantly associated with an increased risk of long-term all-cause mortality among US general adults. The NLR defined herein emerge from routine complete blood count testing, ensuring that it can be easily applied in clinical practice. The statistically nonsignificant associations of NLR levels with cause-specific mortality desires further investigation.
Abbreviations
NLR, neutrophil-lymphocyte ratio; NHANES, National Health and Nutrition Examination Surveys; NCHS, National Center for Health Statistics; STROBE, strengthening the reporting of observational studies in epidemiology; PIR, income-poverty ratio; BMI, body mass index.
Data Sharing Statement
No additional data are available. NHANES and the NDI linkage data are publicly available at https://www.cdc.gov/nchs/nhanes/index.htm and https://www.cdc.gov/nchs/data-linkage/mortality-public.htm. We intend to provide relevant code on written reasonable request.
Acknowledgments
We thank the participants and staff of the National Health and Nutrition Examination Survey for their valuable contributions. They were not compensated for their contributions.
Funding
This study was supported by grant from the National Natural Science Foundation of China (No. 81672300). The funder had no role in design and conduct of the study; collection, management, analysis, and interpretation of the data; preparation, review, and approval of the manuscript; or the decision to submit the manuscript for publication.
Disclosure
All authors declare no conflicts of interest in this work.
References
1. Kelsey KT, Wiencke JK. Immunomethylomics: a novel cancer risk prediction tool. Ann Am Thorac Soc. 2018;15(Suppl 2):S76–s80. doi:10.1513/AnnalsATS.201706-477MG
2. Xia WY, Zhu XR, Feng W, et al. Neutrophil-lymphocyte ratio and platelet-lymphocyte ratio associations with heart and body dose and their effects on patient outcomes in locally advanced non-small cell lung cancer treated with definitive radiotherapy. Transl Lung Cancer Res. 2020;9(5):1996–2007. doi:10.21037/tlcr-20-831
3. Yuk HD, Ku JH. Role of systemic inflammatory response markers in urothelial carcinoma. Front Oncol. 2020;10:1473. doi:10.3389/fonc.2020.01473
4. Stevens L, Pathak S, Nunes QM, et al. Prognostic significance of pre-operative C-reactive protein and the neutrophil-lymphocyte ratio in resectable pancreatic cancer: a systematic review. HPB (Oxford). 2015;17(4):285–291. doi:10.1111/hpb.12355
5. Wei B, Yao M, Xing C, et al. The neutrophil lymphocyte ratio is associated with breast cancer prognosis: an updated systematic review and meta-analysis. Onco Targets Ther. 2016;9:5567–5575. doi:10.2147/OTT.S108419
6. Drobni ZD, Zafar A, Zubiri L, et al. Decreased absolute lymphocyte count and increased neutrophil/lymphocyte ratio with immune checkpoint inhibitor-associated myocarditis. J Am Heart Assoc. 2020;9(23):e018306. doi:10.1161/JAHA.120.018306
7. Kara M, Uysal S, Altinişik U, Cevizci S, Güçlü O, Dereköy FS. The pre-treatment neutrophil-to-lymphocyte ratio, platelet-to-lymphocyte ratio, and red cell distribution width predict prognosis in patients with laryngeal carcinoma. Eur Arch Otorhinolaryngol. 2017;274(1):535–542. doi:10.1007/s00405-016-4250-8
8. Xia WK, Liu ZL, Shen D, Lin QF, Su J, Mao WD. Prognostic performance of pre-treatment NLR and PLR in patients suffering from osteosarcoma. World J Surg Oncol. 2016;14:127. doi:10.1186/s12957-016-0889-2
9. Salman T, Kazaz SN, Varol U, et al. Prognostic value of the pretreatment neutrophil-to-lymphocyte ratio and platelet-to-lymphocyte ratio for patients with neuroendocrine tumors: an izmir oncology group study. Chemotherapy. 2016;61(6):281–286. doi:10.1159/000445045
10. Wang Y, Peng C, Cheng Z, et al. The prognostic significance of preoperative neutrophil-lymphocyte ratio in patients with hepatocellular carcinoma receiving hepatectomy: a systematic review and meta-analysis. Int J Surg. 2018;55:73–80. doi:10.1016/j.ijsu.2018.05.022
11. Mozos I, Malainer C, Horbańczuk J, et al. Inflammatory markers for arterial stiffness in cardiovascular diseases. Front Immunol. 2017;8:1058. doi:10.3389/fimmu.2017.01058
12. Yaman M, Arslan U, Beton O, Pamukcu HE, Dogdu O. Early and late aortic propagation velocity values in STEMI patients after successful primary PCI and their relationship with neutrophil to lymphocyte ratio. Eur Rev Med Pharmacol Sci. 2016;20(5):912–918.
13. Fan Q, Zhu H, Zhao J, et al. Risk factors for myocardial injury in patients with coronavirus disease 2019 in China. ESC Heart Fail. 2020;7(6):4108–4117. doi:10.1002/ehf2.13022
14. Araos P, Figueroa S, Amador CA. The role of neutrophils in hypertension. Int J Mol Sci. 2020;21:22. doi:10.3390/ijms21228536
15. Cataudella E, Giraffa CM, Di Marca S, et al. Neutrophil-to-lymphocyte ratio: an emerging marker predicting prognosis in elderly adults with community-acquired pneumonia. J Am Geriatr Soc. 2017;65(8):1796–1801. doi:10.1111/jgs.14894
16. Gharebaghi N, Valizade Hasanloei MA, Medizadeh Khalifani A, Pakzad S, Lahooti D. Neutrophil-to-lymphocyte ratio in patients with gram-negative sepsis admitted to intensive care unit. Anaesthesiol Intensive Ther. 2019;51(1):11–16. doi:10.5603/AIT.a2019.0009
17. Naess A, Nilssen SS, Mo R, Eide GE, Sjursen H. Role of neutrophil to lymphocyte and monocyte to lymphocyte ratios in the diagnosis of bacterial infection in patients with fever. Infection. 2017;45(3):299–307. doi:10.1007/s15010-016-0972-1
18. de Jager CP, van Wijk PT, Mathoera RB, de Jongh-leuvenink J, van der Poll T, Wever PC. Lymphocytopenia and neutrophil-lymphocyte count ratio predict bacteremia better than conventional infection markers in an emergency care unit. Crit Care. 2010;14(5):R192. doi:10.1186/cc9309
19. Chen Y, Ye LJ, Wu Y, et al. Neutrophil-lymphocyte ratio in predicting infective endocarditis: a case-control retrospective study. Mediators Inflamm. 2020;2020:8586418. doi:10.1155/2020/8586418
20. Ham SY, Yoon HJ, Nam SB, Yun BH, Eum D, Shin CS. Prognostic value of neutrophil/lymphocyte ratio and mean platelet volume/platelet ratio for 1-year mortality in critically ill patients. Sci Rep. 2020;10(1):21513. doi:10.1038/s41598-020-78476-y
21. Huang X, Qin Z, Xu M, et al. Neutrophil: lymphocyte ratio is positively associated with subclinical diabetic cardiomyopathy. BMC Endocr Disord. 2020;20(1):99. doi:10.1186/s12902-020-00571-y
22. Mertoglu C, Gunay M. Neutrophil-Lymphocyte ratio and Platelet-Lymphocyte ratio as useful predictive markers of prediabetes and diabetes mellitus. Diabetes Metab Syndr. 2017;11(Suppl 1):S127–s131. doi:10.1016/j.dsx.2016.12.021
23. Yolbas S, Yildirim A, Gozel N, Uz B, Koca SS. Hematological indices may be useful in the diagnosis of systemic lupus erythematosus and in determining disease activity in Behçet’s disease. Med Princ Pract. 2016;25(6):510–516. doi:10.1159/000447948
24. Kim DS, Shin D, Lee MS, et al. Assessments of neutrophil to lymphocyte ratio and platelet to lymphocyte ratio in Korean patients with psoriasis vulgaris and psoriatic arthritis. J Dermatol. 2016;43(3):305–310. doi:10.1111/1346-8138.13061
25. Balta S, Kurtoglu E, Kucuk U, Demirkol S, Ozturk C. Neutrophil-lymphocyte ratio as an important assessment tool. Expert Rev Cardiovasc Ther. 2014;12(5):537–538. doi:10.1586/14779072.2014.902309
26. von Elm E, Altman DG, Egger M, Pocock SJ, Gøtzsche PC, Vandenbroucke JP. The Strengthening the Reporting of Observational Studies in Epidemiology (STROBE) statement: guidelines for reporting observational studies. Lancet. 2007;370(9596):1453–1457. doi:10.1016/S0140-6736(07)61602-X
27. Centers for Disease Control and Prevention (CDC). National Center for Health Statistics (NCHS). National Health and Nutrition Examination Survey Data. Hyattsville, MD: U.S. Department of Health and Human Services, Centers for Disease Control and Prevention. Available from: https://wwwn.cdc.gov/nchs/nhanes/analyticguidelines.aspx#plan-and-operations.
28. Centers for Disease Control and Prevention (CDC). National Center for Health Statistics (NCHS). 2015 Public-Use Linked Mortality Files; 2019. Available from: https://www.cdc.gov/nchs/data-linkage/mortality-public.htm.
29. Brämer GR. International statistical classification of diseases and related health problems. Tenth revision. World Health Stat Q. 1988;41(1):32–36.
30. Blackwell DL, Lucas JW, Clarke TC. Summary health statistics for U.S. adults: national health interview survey, 2012. Vital Health Stat 10. 2014;260:1–161.
31. Gardner JW, Stewart WH. Cigarette smoking and health characteristics United States-July 1964-June 1965. Vital Health Stat. 1967;10:34.
32. Mathur K, Kurbanova N, Qayyum R. Platelet-lymphocyte ratio (PLR) and all-cause mortality in general population: insights from national health and nutrition education survey. Platelets. 2019;30(8):1036–1041. doi:10.1080/09537104.2019.1571188
33. Wang H, Wang MS, Zhou YH, Shi JP, Wang WJ. Prognostic values of LDH and CRP in cervical cancer. Onco Targets Ther. 2020;13:1255–1263. doi:10.2147/OTT.S235027
34. Erikssen G, Liestøl K, Bjørnholt JV, Stormorken H, Thaulow E, Erikssen J. Erythrocyte sedimentation rate: a possible marker of atherosclerosis and a strong predictor of coronary heart disease mortality. Eur Heart J. 2000;21(19):1614–1620. doi:10.1053/euhj.2000.2148
35. Liu J, Zhang Y, Lavie CJ, et al. Associations of C-reactive protein and fibrinogen with mortality from all-causes, cardiovascular disease and cancer among U.S. adults. Prev Med. 2020;139:106044. doi:10.1016/j.ypmed.2020.106044
36. Veeranna V, Zalawadiya SK, Panaich S, Patel KV, Afonso L. Comparative analysis of red cell distribution width and high sensitivity C-reactive protein for coronary heart disease mortality prediction in multi-ethnic population: findings from the 1999-2004 NHANES. Int J Cardiol. 2013;168(6):5156–5161. doi:10.1016/j.ijcard.2013.07.109
37. Bittoni MA, Focht BC, Clinton SK, Buckworth J, Harris RE. Prospective evaluation of C-reactive protein, smoking and lung cancer death in the Third National Health and Nutrition Examination Survey. Int J Oncol. 2015;47(4):1537–1544. doi:10.3892/ijo.2015.3141
38. Goyal A, Terry MB, Jin Z, Siegel AB. C-reactive protein and colorectal cancer mortality in U.S. adults. Cancer Epidemiol Biomarkers Prev. 2014;23(8):1609–1618. doi:10.1158/1055-9965.EPI-13-0577
39. Kantor ED, Udumyan R, Giovannucci EL, et al. Association of blood marker of inflammation in late adolescence with premature mortality. JAMA Pediatr. 2019;173(11):1095–1097. doi:10.1001/jamapediatrics.2019.2835
40. Kim HJ, Kwak N, Hong H, et al. BACES score for predicting mortality in nontuberculous mycobacterial pulmonary disease. Am J Respir Crit Care Med. 2021;203(2):230–236. doi:10.1164/rccm.202004-1418OC
41. Zhu J, Lian L, Qin H, et al. Prognostic evaluation of patients with resectable lung cancer using systemic inflammatory response parameters. Oncol Lett. 2019;17(2):2244–2256. doi:10.3892/ol.2018.9858
42. Chen C, Ye Y, Zhang Y, Pan XF, Pan A. Weight change across adulthood in relation to all cause and cause specific mortality: prospective cohort study. BMJ. 2019;367:l5584. doi:10.1136/bmj.l5584
43. Mirel LB, El Bural Félix S, Zhang C, Golden C, Cox CS. Comparative analysis of the national health interview survey public-use and restricted-use linked mortality files. Natl Health Stat Report. 2020;143:1–32.
 © 2021 The Author(s). This work is published and licensed by Dove Medical Press Limited. The full terms of this license are available at https://www.dovepress.com/terms.php and incorporate the Creative Commons Attribution - Non Commercial (unported, v3.0) License.
By accessing the work you hereby accept the Terms. Non-commercial uses of the work are permitted without any further permission from Dove Medical Press Limited, provided the work is properly attributed. For permission for commercial use of this work, please see paragraphs 4.2 and 5 of our Terms.
© 2021 The Author(s). This work is published and licensed by Dove Medical Press Limited. The full terms of this license are available at https://www.dovepress.com/terms.php and incorporate the Creative Commons Attribution - Non Commercial (unported, v3.0) License.
By accessing the work you hereby accept the Terms. Non-commercial uses of the work are permitted without any further permission from Dove Medical Press Limited, provided the work is properly attributed. For permission for commercial use of this work, please see paragraphs 4.2 and 5 of our Terms.