")
Back to Journals » Diabetes, Metabolic Syndrome and Obesity » Volume 16
Association Between Hemoglobin Glycation Index and Metabolic Syndrome in Middle-Aged and Older People
Authors Xie SS , Luo XT, Dong MH , Wang Q, Li J, Wu QF
Received 1 February 2023
Accepted for publication 5 May 2023
Published 19 May 2023 Volume 2023:16 Pages 1471—1479
DOI https://doi.org/10.2147/DMSO.S406660
Checked for plagiarism Yes
Review by Single anonymous peer review
Peer reviewer comments 5
Editor who approved publication: Professor Gian Paolo Fadini
Si-si Xie,1 Xiao-ting Luo,2 Ming-hua Dong,3 Qi Wang,3 Jian Li,4 Qing-feng Wu3
1School of Graduate, Gannan Medical University, Ganzhou, Jiangxi, People’s Republic of China; 2School of General Medicine, Gannan Medical University, Ganzhou, Jiangxi, People’s Republic of China; 3School of Public Health and Health Management, Gannan Medical University, Ganzhou, Jiangxi, People’s Republic of China; 4School of Basic Medical, Gannan Medical University, Ganzhou, Jiangxi, People’s Republic of China
Correspondence: Qing-feng Wu, Gannan Medical University, Rongjiang New District College Park, Ganzhou, Jiangxi, 341000, People’s Republic of China, Tel/Fax +86 18970786090, Email [email protected]
Purpose: Hemoglobin glycation index (HGI) is used to describe the difference between estimated and measured glycated hemoglobin A1c (HbA1c). The present study aimed to investigate the association between metabolic syndrome (MetS) and HGI in middle-aged and elderly Chinese.
Patients and Methods: In this cross-sectional study, a multi-stage random sampling method was used to select objects from the permanent residents aged 35 years and above living in Ganzhou, Jiangxi, China. The demographic information, history of illness, physical examination, and blood biochemistry data were obtained. HGI was calculated from fasting plasma glucose (FPG) and HbA1c (HGI = measured HbA1c value - predicted HbA1c value). All participants were divided into low HGI and high HGI groups using the median HGI as a cut-off value. Univariate analysis was used to detect the influencing factors of HGI, and Logistic regression analysis was adopted to analyze the relationship between significant variables found in univariate analysis, MetS, or MetS’s components and HGI.
Results: A total of 1826 participants were enrolled in the study, and the prevalence of MetS was 27.4%. There were 908 in the low HGI group and 918 in the high HGI group, and the prevalence of MetS was 23.7% and 31.0%, respectively. Logistic regression analysis showed that the prevalence of MetS in the high HGI group was higher than that in the low HGI group (OR=1.384, 95% CI:1.110~1.725), further analysis showed that HGI was related with abdominal obesity (OR=1.287, 95% CI:1.061~1.561), hypertension (OR=1.349, 95% CI:1.115~1.632), and hypercholesterolemia (OR=1.376, 95% CI:1.124~1.684) (all P < 0.05). After adjusting for age, sex, and serum uric acid (UA), the relationship still existed.
Conclusion: This study found that HGI is directly associated with MetS.
Keywords: hemoglobin glycation index, metabolic syndrome, cross-sectional study
Introduction
MetS is not a single disease, but a combination of metabolically interrelated risk factors such as abdominal obesity, hyperglycaemia, dyslipidaemia, and hypertension.1 In recent years, with the economic development in China, high-calorie diet has become more common, which may be associated with the increasing prevalence of MetS.2,3 The National Health and Nutrition Examination Survey of the United States showed that the MetS prevalence of adults was about 25% worldwide, ranging from 20% to 30% in most countries.4 Data from the China Health and Nutrition Survey in 2009 showed that the prevalence of MetS in Chinese adults was 10.50%,5 but data from Longitudinal Study 2011–2015 showed that the prevalence of MetS was roared 25.55% in people aged 45 years and older.6 MetS significantly increased the risk of type 2 diabetes mellitus (T2DM) and cardiovascular disease (CVD). Studies have shown that MetS patients experience a double increase in the risks of CVD within 5–10 years, five-fold in T2DM, and 1.6 times in mortality rates.7,8 The rising burden in economy and health-care system caused by MetS9 recommended that more research should be conducted on MetS metrics.
HbA1c reflects an individual’s average glucose levels over the past 8–12 weeks and is recommended in clinical practice as an important reference for the diagnosis of diabetes and the control of glycaemic levels in diabetic patients.10 Indeed, individual variations in HbA1c caused by factors other than blood glucose concentration have been reported in subjects with T2DM and in nondiabetic individuals; these variations were likely due to genetic factors, differences in HbA1c rates or in red cell survival among different ethnic groups.11 In order to better distinguish individual differences and predict related diseases, some scholars have proposed the HGI. It is calculated based on the difference reflecting the magnitude and direction between the observed HbA1c-predicted HbA1c,12 and the predicted HbA1c value is estimated based on the significant linear relationship between FPG and HbA1c (HGI=observed HbA1c-predicted HbA1c). The HGI can identify people with HbA1c levels that are higher or lower than average compared to other people with the same blood glucose concentrations.13 Studies have shown that HGI has a good predictive effect on chronic diseases such as T2DM-related complications, coronary atherosclerosis, and hepatic steatosis.14,15 However, the correlation between HGI and MetS has rarely been reported. Therefore, the correlation between MetS and HGI will be detected in this paper based on the population in Ganzhou, Jiangxi, China.
Materials and Methods
Study Design and Study Population
Data in this study were the baseline of the Gannan Medical University cohort study conducted from June to September 2020. Participants were permanent residents of Ganzhou, Jiangxi, China. People aged 35 years and above were sampled, and a total of 1826 participants enrolled in the study. Inclusion criteria for the study: 35 years or older; more than 1 year of residence in Ganzhou; no severe physical disability; and able to communicate normally. Exclusion criteria: pregnant women; the completion rate of questionnaires was less than 70%.
This study followed the principles in the Declaration of Helsinki and was approved by the medical ethics committee of Gannan Medical University (The number of ethics committee: NO.2019129). All participants volunteered to participate in the study and signed informed consent.
Information and Biomarkers Collection
Physical examinations and face-to-face questionnaires were conducted among the population to collect data on demographic characteristics, disease histories, anthropometric indicators etc. Meanwhile, fast blood samples were collected from 7 a.m. to 10 a.m., and all samples were submitted to the same laboratory. The levels of triglycerides (TG, mmol/L), high-density lipoprotein cholesterol (HDL-C, mmol/L), UA (μmol/L), HbA1c, and FPG (mmol/L) were measured by professionals using a fully automatic biochemical analyzer (Beckman Coulter AU5800). The latex particle-enhanced turbidimetric immunoassay, hexokinase method, GPO-PAP method, peroxide scavenging, and uricase-based method were used to detect HbA1c, FPG, TG, HDL-C, and UA, respectively. The above biomarkers were detected using kits produced by the Medical System company. All questionnaires and physical examinations were carried out by uniformly trained investigators, and all samples were processed by professional medical staff in the laboratory department.
Definition of MetS
According to the MetS diagnostic criteria formulated by the Chinese Diabetes Society, patients with three or more of the following items can be diagnosed:1 (1) abdominal obesity (waist circumference ≥90 cm for men and 85 cm for women); (2) hyperglycemia: FPG ≥6.10mmol/L or diagnosed diabetes mellitus; (3) hypertension: blood pressure ≥130/85mmHg (1mmHg=0.133kPa) or diagnosed hypertension; (4) hypertriglyceridemia: Fasting triglyceride (TG) ≥1.70mmol/L; (5) Low HDL-C: fasting HDL-C <1.04mmol/L.
Index of Glycated Hemoglobin Variation
HGI = measured HbA1c value - predicted HbA1c Value
According to the scatter plot of HbA1c and FPG a linear regression equation was established to estimate the predicted HbA1c value. The predicted value of HbA1c (%) was calculated by the linear regression equation (predicted HbA1c = 2.941 + 0.392 × FPG (mmol/L)), R2 = 0.670, (P<0.001). (Figure 1)
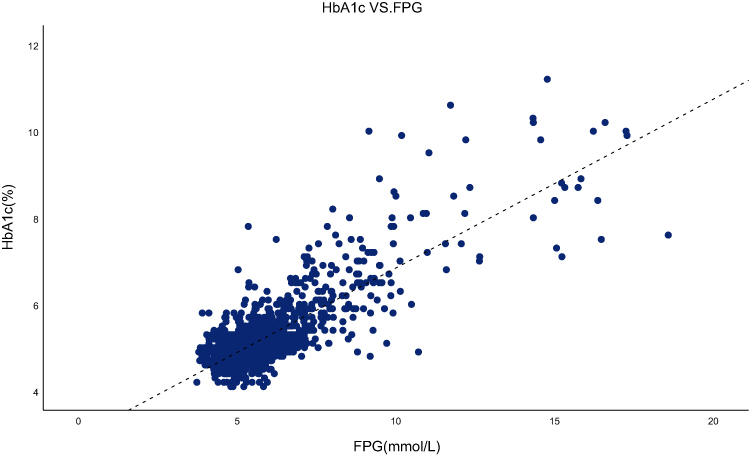 |
Figure 1 Regression of HbA1c VS FPG. Abbreviations: HbA1c, glycated hemoglobin A1c; FPG, fasting plasma glucose. Note: The dotted line represents the simple linear regression line of the equation: predicted HbA1c = 2.941 + 0.392 x FPG (mmol/L), R2 = 0.670 (P<0.001). |
Participants Group
Two main subgroups were included in this study.
- Individuals with and without MetS.
- According to the median HGI value, the subjects were divided into two groups: low HGI group (HGI≤-0.03%) and high HGI group (HGI > −0.03%).
Statistical Analysis
All analyses were conducted using Statistical Product and Service Solutions 26.0 (SPSS 26.0). Mean ± standard deviation was used to represent the measurement data with approximately normal distribution, and the t-test was used for comparison between groups. Categorical variables were described by percentage, and chi-squared test was used for comparison between groups. The risk factors for MetS and the correlation between HGI and MetS were analyzed using binary Logistic regression. After adjusting for age, sex, and UA, we investigated the independent correlation between HGI and MetS using Logistic regression analysis, and P<0.05 (two-sided) was considered statistically significant.
Results
Clinical Characteristics of All Participants
This study included 1826 subjects (609 males and 1217 females) with an average age of 54.85 years (54.85±7.59), the prevalence of MetS was 27.4% (500 cases), and the median HGI was −0.03 (−0.24, 0.19). (Table 1)
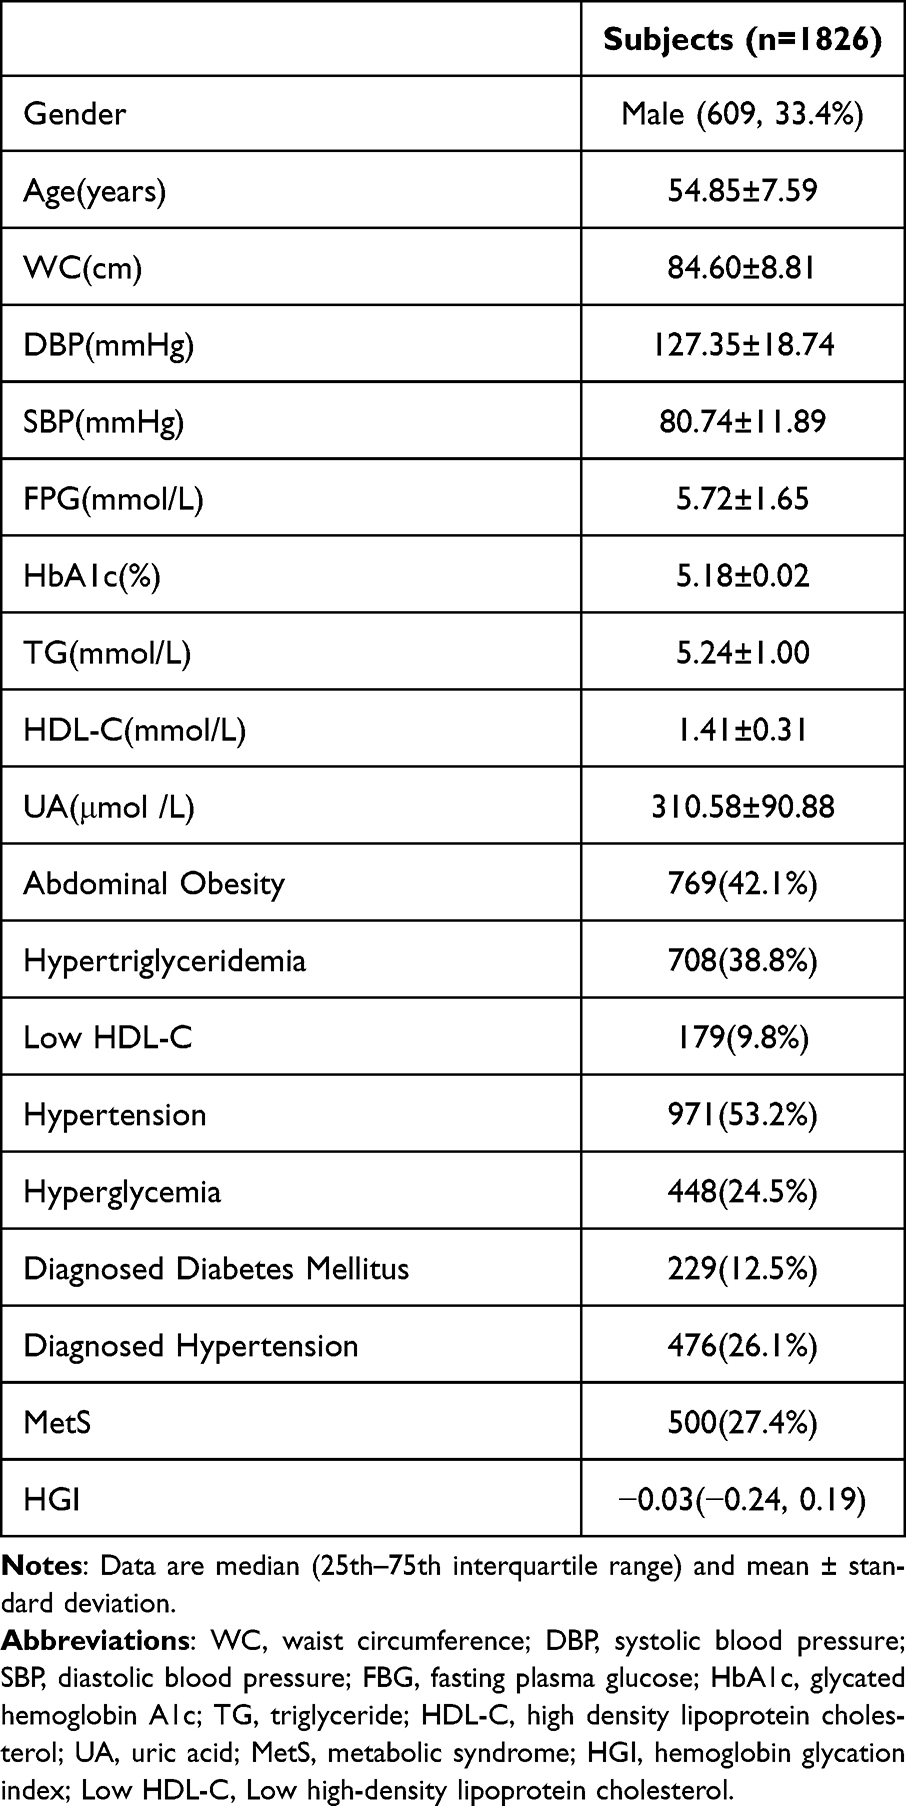 |
Table 1 Clinical Characteristics of All Participants |
Comparison of Basic Parameters Between the High and Low HGI Groups
Compared to the low HGI group, the prevalence of MetS was higher in the high HGI group (P<0.001) (Figure 2). There were significant differences in age, WC, DPB, SBP, FPG, and TG between the two HGI groups. The prevalence of abdominal obesity, hypertension, hypertriglyceridemia, and Low HDL-C in the high HGI group was higher than those of the low HGI group (P<0.05). No statistical differences were found in gender, HDL-C, and UA between the two groups (P>0.05). (Table 2)
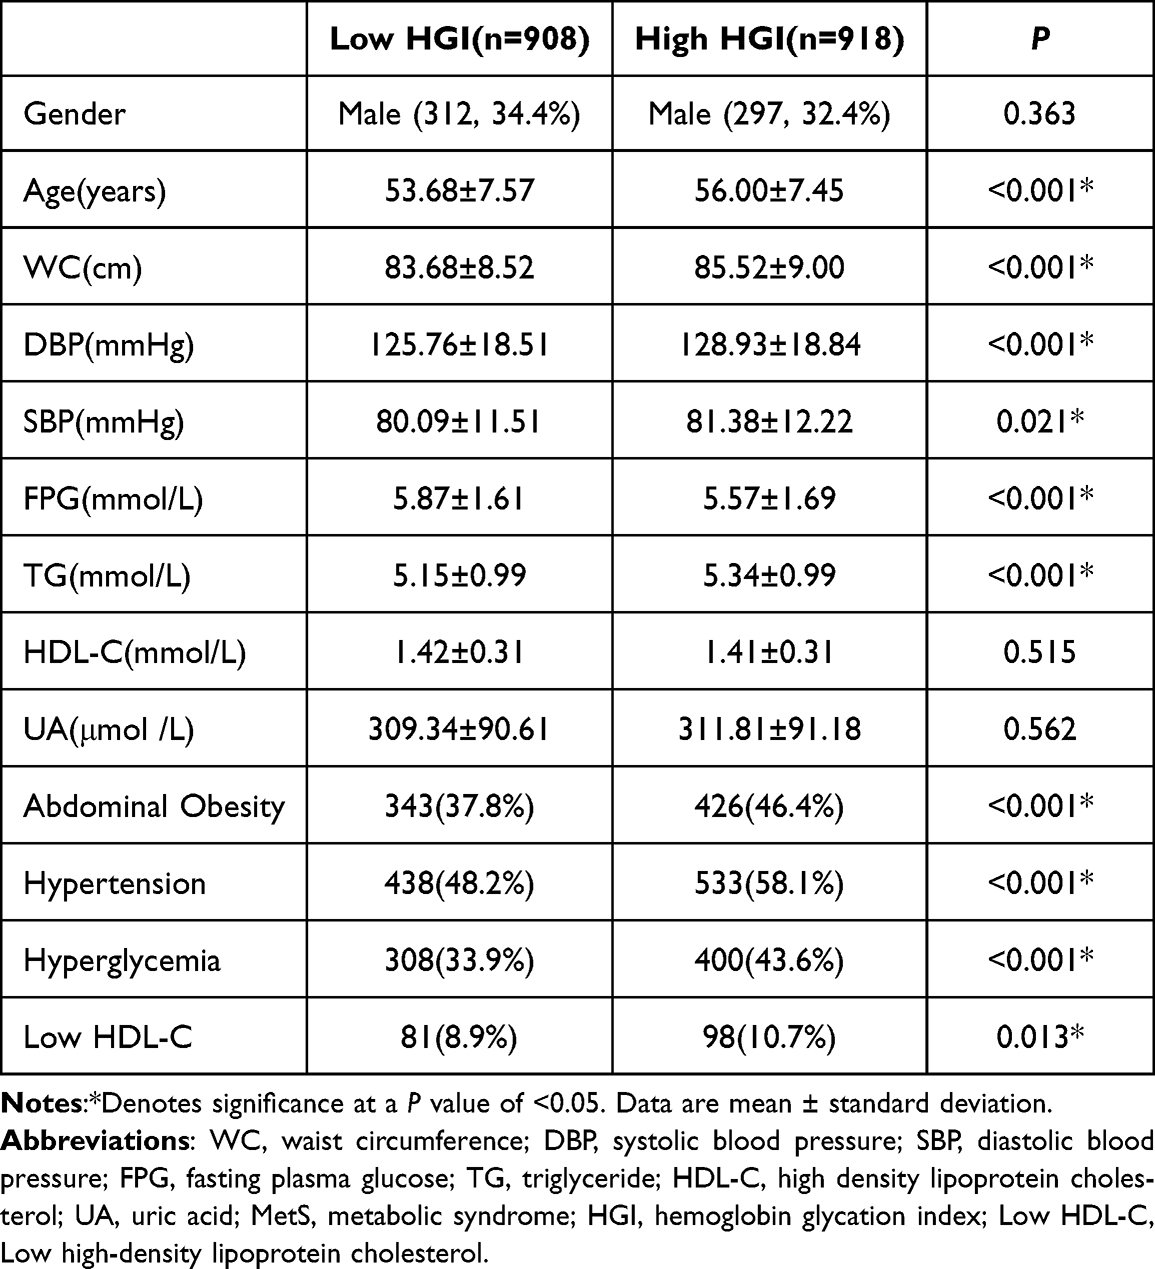 |
Table 2 Comparison of Indicators Between High HGI Group and Low HGI Group |
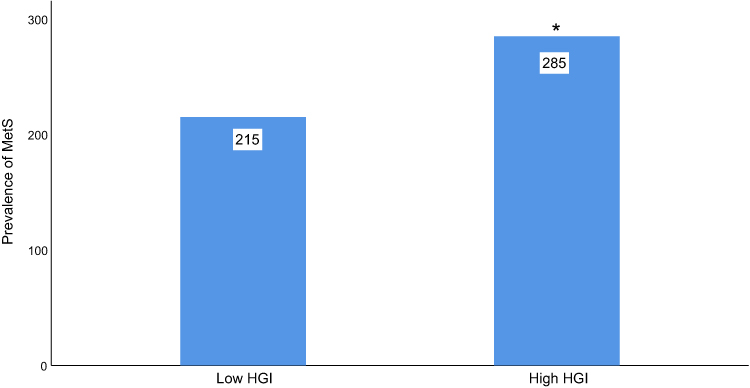 |
Figure 2 Comparison of the prevalence of MetS between the high HGI group and the low HGI group in all subjects. Abbreviations: Low HGI, Low hemoglobin glycation index group; High HGI, High hemoglobin glycation index group; MetS, metabolic syndrome. Note: *Denotes significance at a P value of <0.05. |
Dichotomous Logistic Regression Analysis of Risk Factors for MetS
Dichotomous logistic regression analysis was used to analyze the relative factors of MetS among age, gender, UA, and HGI. The results indicated that age, UA, and HGI were associated with the prevalence of MetS. Compared to the low HGI group, the prevalence of MetS increased 1.384-fold in the high HGI group (P=0.004) (Table 3).
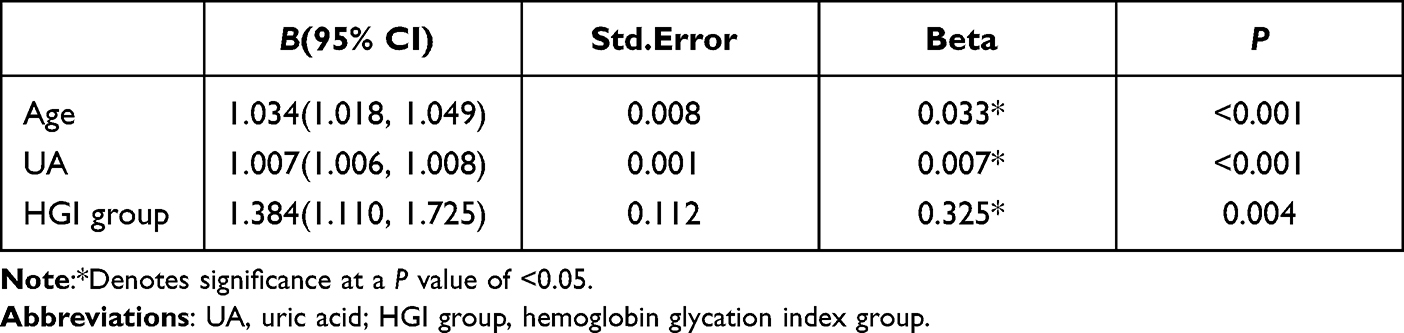 |
Table 3 Logistic Regression Analysis of Risk Factors for MetS Prevalence |
Correlation Analysis of HGI Groups with MetS and Its Diagnostic Components
Univariate data analysis showed that the HGI group was influencing factors for MetS prevalence. In addition, HGI was correlated with abdominal obesity, hypertension, and hypertriglyceridemia. However, HGI was not correlated with Low HDL-C (Table 4).
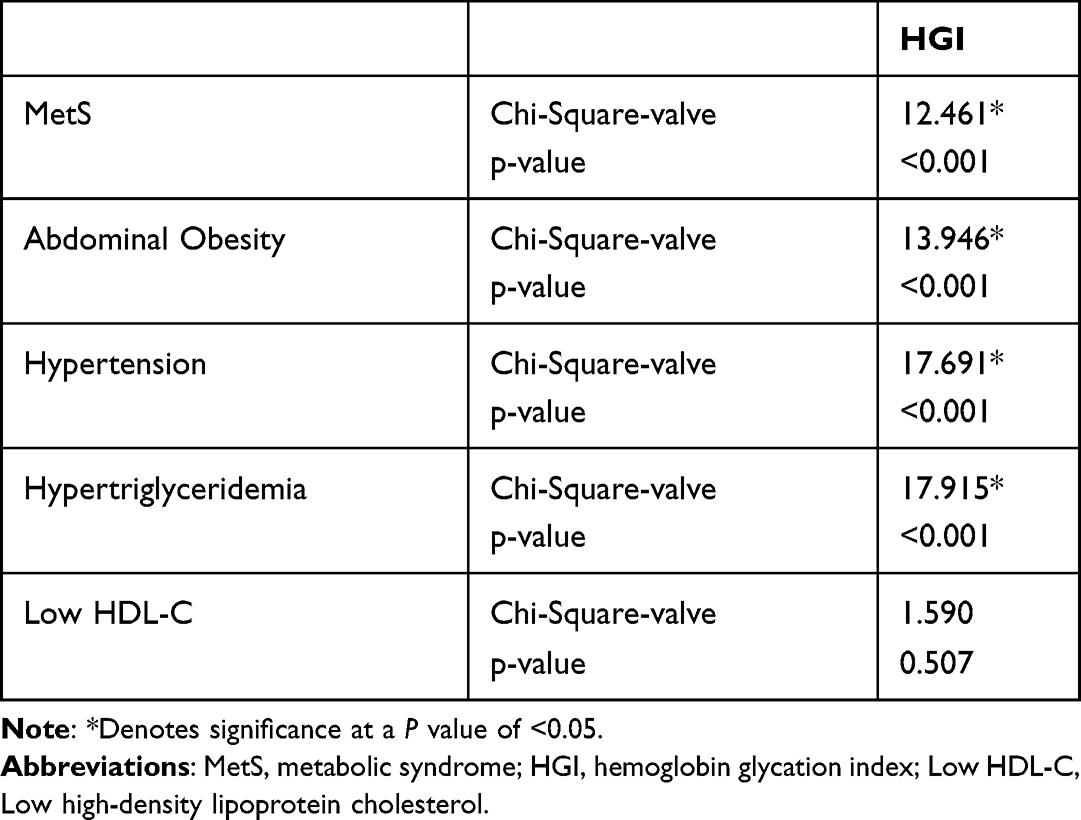 |
Table 4 Correlation Analysis of HGI Groups with MetS and Its Diagnostic Components |
Logistic Regression Analysis of HGI with MetS and Its Components
For all participants, the high HGI group was negatively correlated with abdominal obesity, hypertension, and hypertriglyceridemia in the crude model 1 (Table 5). After adjustment for age, gender, and UA, elevated HGI was still associated with abdominal obesity and hypertriglyceridemia in model 2 (Table 6).
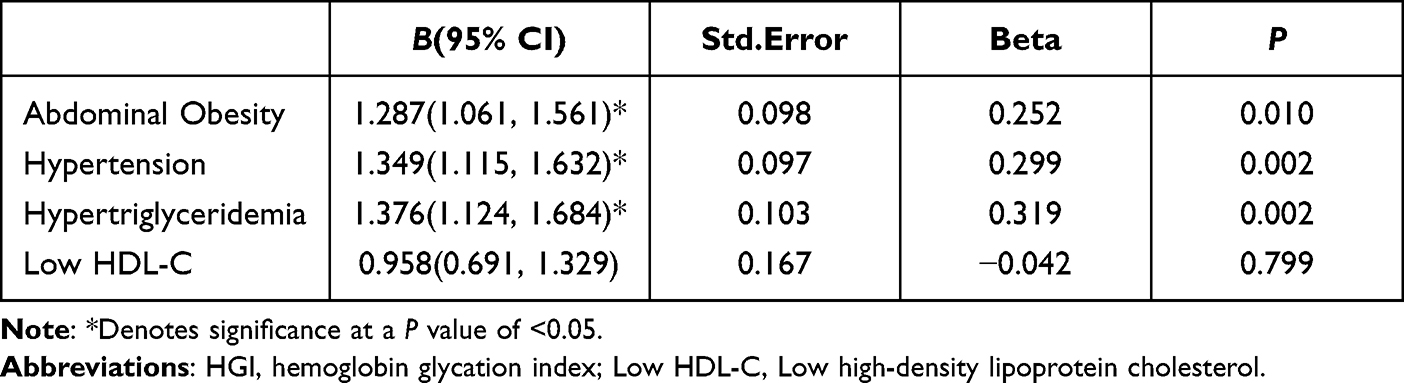 |
Table 5 Association of Model 1 HGI with MetS Diagnosis |
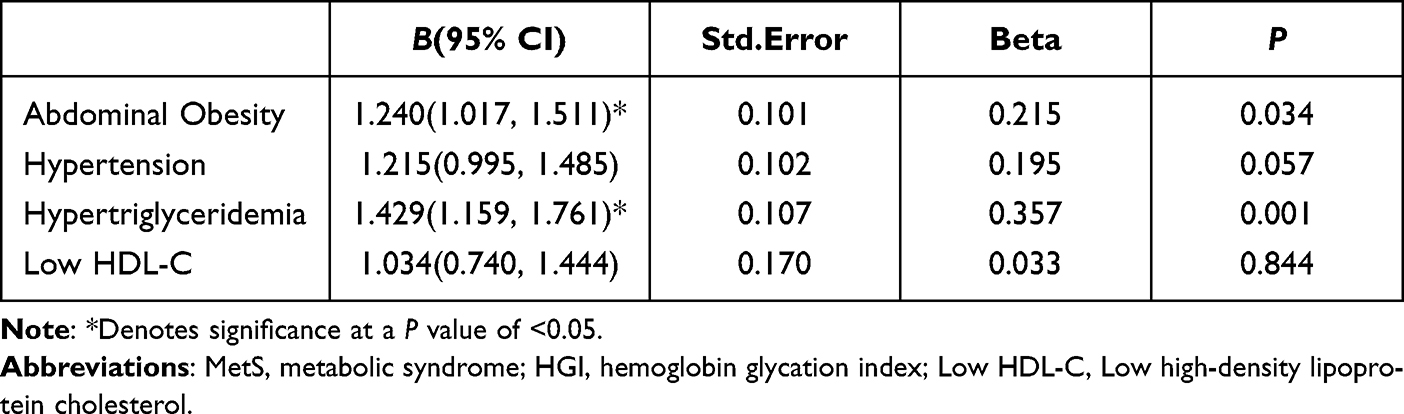 |
Table 6 Association Between HGI and MetS Diagnosis in Model 2 |
Discussion
Our survey showed that the prevalence of MetS in subjects over 35 years or older was 27.4% and the age-standardized prevalence of MetS was 13.63%. This estimated prevalence was similar to the data of 14.39% from a report among adults over 18 years old across China from May 2013 to July 2014.16 However, it is lower than the value of 25.00% in the Middle East and 34.70% in America.4,17 MetS forms a cluster of metabolic dysregulations including ectopic lipid accumulation, insulin resistance (IR), obesity, and many other health factors.18 In this study, we investigated the relationship between MetS and HGI.
Univariate analysis results showed that people with higher HGI had a higher prevalence of MetS. The logistic regression analysis showed that the risk of MetS in the high HGI group was 1.384-fold for the risk of low HGI group. Multivariate logistic regression analysis showed that higher HGI was positively associated with the prevalence risk of abdominal obesity, hypertension, hypercholesterolemia, and MetS, even when the influence of age, gender, and UA was adjusted, the relationship still existed. However, the association between HGI and Low HDL-C was not statistically significant in this study. The results of this study show that high HGI is associated with multiple diagnostic factors of MetS. Therefore, high HGI is thought to be associated with MetS prevalence, and some possible mechanisms are as follows.
HbA1c, as an indicator of the long-term stability of blood glucose, is related to pancreatic islet β-cell dysfunction and the degree of IR.19 Studies have shown that HbA1c level can not only be used to identify patients at high risk of diabetes but also have a certain role in the identification of cardiovascular disease.20 HGI is defined as the difference between the observed HbA1c value and the predicted HbA1c value, representing the degree of non-enzymatic glycation of hemoglobin.11 Existing studies have shown that high HGI can be used as a glucose metabolism phenotype, which reflects the levels of inflammatory markers such as C-reactive protein, erythrocyte sedimentation rate, white blood cell count, and complement C3.21
Abdominal obesity is the result of excessive fat storage in the body. Its physiological mechanism is a chronic inflammatory response caused by the release of inflammatory molecular mediators from adipocytes to maintain metabolic homeostasis under oxidative stress, and visceral fat accumulation is an independent risk factor for diabetes. High plasma levels of C-reactive protein (Crp) and fibrinogen in people with higher HGI are the results of hepatic secretion in response to factors released by macrophages and adipocytes during the acute phase of the inflammatory response.13,22
It has been proven that hyperinsulinemia is one of the pathophysiological basis of hypertension. The pathological mechanism is that hyperinsulinemia may induce renal sodium and water retention, thereby activating the renin-angiotensin-aldosterone system, enhancing sympathetic nerve activity, promoting endothelial cell dysfunction, and thereby increasing peripheral and renal vascular resistance. In addition, hyperinsulinemia may have a synergistic effect on obesity and hypertension by increasing adipokine secretion, and sympathetic nervous system activity.23 HGI elevation may contribute to atherosclerosis through pro-inflammatory cell signaling and oxidative stress. Besides, it may lead to endothelial cell damage, further promoting endothelial cell release of endothelin, inhibiting nitric oxide, and prostacyclin production, causing vasodilatory dysfunction, and further contributing to elevated hypertension.20
Insulin is involved in the anabolic activity of skeletal muscle.24 IR is significantly associated with hypertriglyceridemia and low high-density lipoprotein cholesterol.25 Overexpression of lipoprotein lipase (LPL) in the liver or muscle induces lipid accumulation in the respective tissues, tilts immune cells in the skeletal muscle toward a proinflammatory phenotype, increases proinflammatory macrophages in the cells, releases cytokines and other metabolites, and induces activation of several kinases and phosphatases in muscle fibers. It further leads to hypertriglyceridemia, peripheral ectopic fat deposition, and severe IR.24,26,27
There are several limitations to this study. First, because of the cross-sectional nature of the study, causality cannot be inferred. Secondly, as a field investigation study, there are uncontrollable factors in the field situation, so the gender ratio of the subjects included in this study is quite different, which may have a certain impact on the results. Finally, as a regional study, the representativeness of the results of this study has certain limitations.
Funding
This research was funded by National Natural Science Foundation of China (81660566, 81960621), research project of Gannan Medical University (YB201940) and PhD initiation fund project (QD201602, QD202015). These funds cover the costs of publishing the manuscript.
Disclosure
The authors report no conflicts of interest in this work.
References
1. Zhu D. Guidelines for the prevention and treatment of type 2 diabetes in China (2020 edition). Chin J Pract Intern Med. 2021;41(09):757–784. doi:10.19538/j.nk2021090106
2. Xu Y, Wang L, He J, et al. Prevalence and control of diabetes in Chinese adults. JAMA. 2013;310(9):948–959. doi:10.1001/jama.2013.168118
3. Saklayen MG. The global epidemic of the metabolic syndrome. Curr Hypertens Rep. 2018;20(2):12. doi:10.1007/s11906-018-0812-z
4. Hirode G, Wong RJ. Trends in the prevalence of metabolic syndrome in the United States, 2011–2016. JAMA. 2020;323(24):2526–2528. doi:10.1001/jama.2020.4501
5. Xi B, He D, Hu Y, Zhou D. Prevalence of metabolic syndrome and its influencing factors among the Chinese adults: the China Health and Nutrition Survey in 2009. Prev Med. 2013;57(6):867–871. doi:10.1016/j.ypmed.2013.09.023
6. Liu B, Chen G, Zhao R, Huang D, Tao L. Temporal trends in the prevalence of metabolic syndrome among middle-aged and elderly adults from 2011 to 2015 in China: the China health and retirement longitudinal study (CHARLS). BMC Public Health. 2021;21(1):1045. doi:10.1186/s12889-021-11042-x
7. Alberti KG, Eckel RH, Grundy SM, et al. Harmonizing the metabolic syndrome: a joint interim statement of the international diabetes federation task force on epidemiology and prevention; national heart, lung, and blood institute; American Heart Association; World Heart Federation; International Atherosclerosis Society; and International Association for the Study of Obesity. Circulation. 2009;120(16):1640–1645. doi:10.1161/circulationaha.109.192644
8. O’Neill S, O’Driscoll L. Metabolic syndrome: a closer look at the growing epidemic and its associated pathologies. Obes Rev. 2015;16(1):1–12. doi:10.1111/obr.12229
9. Bovolini A, Garcia J, Andrade MA, Duarte JA. Metabolic syndrome pathophysiology and predisposing factors. Int J Sports Med. 2021;42(3):199–214. doi:10.1055/a-1263-0898
10. Wang M, Hng TM. HbA1c: more than just a number. Aust J Gen Pract. 2021;50(9):628–632. doi:10.31128/ajgp-03-21-5866
11. Marini MA, Fiorentino TV, Succurro E, et al. Association between hemoglobin glycation index with insulin resistance and carotid atherosclerosis in non-diabetic individuals. PLoS One. 2017;12(4):e0175547. doi:10.1371/journal.pone.0175547
12. Hempe JM, Gomez R, McCarter RJ, Chalew SA. High and low hemoglobin glycation phenotypes in type 1 diabetes: a challenge for interpretation of glycemic control. J Diabetes Complications. 2002;16(5):313–320. doi:10.1016/s1056-8727(01)00227-6
13. Hempe JM, Hsia DS. Variation in the hemoglobin glycation index. J Diabetes Complications. 2022;36(7):108223. doi:10.1016/j.jdiacomp.2022.108223
14. Lin L, Wang A, He Y, et al. Effects of the hemoglobin glycation index on hyperglycemia diagnosis: results from the REACTION study. Diabetes Res Clin Pract. 2021;180:109039. doi:10.1016/j.diabres.2021.109039
15. Klein KR, Franek E, Marso S, et al. Hemoglobin glycation index, calculated from a single fasting glucose value, as a prediction tool for severe hypoglycemia and major adverse cardiovascular events in DEVOTE. BMJ Open Diabetes Res Care. 2021;9(2). doi:10.1136/bmjdrc-2021-002339
16. Lan Y, Mai Z, Zhou S, et al. Prevalence of metabolic syndrome in China: an up-dated cross-sectional study. PLoS One. 2018;13(4):e0196012. doi:10.1371/journal.pone.0196012
17. Ansarimoghaddam A, Adineh HA, Zareban I, Iranpour S, HosseinZadeh A, Kh F. Prevalence of metabolic syndrome in Middle-East countries: meta-analysis of cross-sectional studies. Diabetes Metab Syndr. 2018;12(2):195–201. doi:10.1016/j.dsx.2017.11.004
18. Bello-Chavolla OY, Vargas-Vázquez A, Antonio-Villa NE, Del Razo-Olvera FM, Elías-López D, Aguilar-Salinas CA. A high incidence of metabolic syndrome traits in mexicans points at obesity-related metabolic dysfunction. Diabetes Metab Syndr Obes. 2021;14:1073–1082. doi:10.2147/dmso.S266568
19. Yinhui HE, Haiyan XU, Qi FU, Tao Y. 糖化血红蛋白和病程对2 型糖尿病胰岛β细胞功能的影响 [Effects of glycosylated hemoglobin and disease course on islet β-cell function in patients with type 2 diabetes]. Nan Fang Yi Ke Da Xue Xue Bao. 2019;39(9):1003–1008. Chinese. doi:10.12122/j.issn.1673-4254.2019.09.01
20. Song J, Wei N, Zhao Y, Jiang Y, Wu X, Gao H. Elevated glycosylated hemoglobin levels and their interactive effects on hypertension risk in nondiabetic Chinese population: a cross-sectional survey. BMC Cardiovasc Disord. 2020;20(1):218. doi:10.1186/s12872-020-01501-5
21. Fiorentino TV, Marini MA, Succurro E, et al. Elevated hemoglobin glycation index identify non-diabetic individuals at increased risk of kidney dysfunction. Oncotarget. 2017;8(45):79576–79586. doi:10.18632/oncotarget.18572
22. Wan H, Wang Y, Xiang Q, et al. Associations between abdominal obesity indices and diabetic complications: Chinese visceral adiposity index and neck circumference. Cardiovasc Diabetol. 2020;19(1):118. doi:10.1186/s12933-020-01095-4
23. Wang F, Han L, Hu D. Fasting insulin, insulin resistance and risk of hypertension in the general population: a meta-analysis. Clin Chim Acta. 2017;464:57–63. doi:10.1016/j.cca.2016.11.009
24. Higuchi R, Iwane T, Suwa K, Nakajima K. Adjustment for waist circumference reveals a U-shaped association between glycated hemoglobin levels and body mass index in young adults. Can J Diabetes. 2019;43(3):201–206. doi:10.1016/j.jcjd.2018.09.007
25. Adeva-Andany MM, Martínez-Rodríguez J, González-Lucán M, Fernández-Fernández C, Castro-Quintela E. Insulin resistance is a cardiovascular risk factor in humans. Diabetes Metab Syndr. 2019;13(2):1449–1455. doi:10.1016/j.dsx.2019.02.023
26. Jia G, DeMarco VG, Sowers JR. Insulin resistance and hyperinsulinaemia in diabetic cardiomyopathy. Nat Rev Endocrinol. 2016;12(3):144–153. doi:10.1038/nrendo.2015.216
27. Tokarz VL, MacDonald PE, Klip A. The cell biology of systemic insulin function. J Cell Biol. 2018;217(7):2273 – 2289. doi:10.1083/jcb.201802095
 © 2023 The Author(s). This work is published and licensed by Dove Medical Press Limited. The full terms of this license are available at https://www.dovepress.com/terms.php and incorporate the Creative Commons Attribution - Non Commercial (unported, v3.0) License.
By accessing the work you hereby accept the Terms. Non-commercial uses of the work are permitted without any further permission from Dove Medical Press Limited, provided the work is properly attributed. For permission for commercial use of this work, please see paragraphs 4.2 and 5 of our Terms.
© 2023 The Author(s). This work is published and licensed by Dove Medical Press Limited. The full terms of this license are available at https://www.dovepress.com/terms.php and incorporate the Creative Commons Attribution - Non Commercial (unported, v3.0) License.
By accessing the work you hereby accept the Terms. Non-commercial uses of the work are permitted without any further permission from Dove Medical Press Limited, provided the work is properly attributed. For permission for commercial use of this work, please see paragraphs 4.2 and 5 of our Terms.