")
Back to Journals » Nature and Science of Sleep » Volume 13
Association Between Eating Habits and Risk of Obstructive Sleep Apnea: A Population-Based Study
Authors Du Y , Duan X, Zheng M, Zhao W , Huang J, Lao L, Weng F, Lin DE, Yang Z, Li H, Liu X , Deng H
Received 18 June 2021
Accepted for publication 9 September 2021
Published 9 October 2021 Volume 2021:13 Pages 1783—1795
DOI https://doi.org/10.2147/NSS.S325494
Checked for plagiarism Yes
Review by Single anonymous peer review
Peer reviewer comments 2
Editor who approved publication: Dr Sarah L Appleton
Yan Du,1,* Xueru Duan,1,* Murui Zheng,2,* Wenjing Zhao,3,* Jun Huang,4 Lixian Lao,5 Fan Weng,6 Dan-Er Lin,7 Zhenxiao Yang,1 Haiyi Li,1 Xudong Liu,1 Hai Deng5
1Department of Epidemiology, School of Public Health, Sun Yat-sen University, Guangzhou, People’s Republic of China; 2Guangzhou Center for Disease Control and Prevention, Guangzhou, People’s Republic of China; 3Department of Public Health, Faculty of Medicine, Hokkaido University, Sapporo, Japan; 4Department of Geriatrics, Institute of Geriatrics, Guangdong Provincial People’s Hospital, Guangdong Academy of Medical Science, Guangzhou, People’s Republic of China; 5Department of Cardiology, Guangdong Cardiovascular Institute, Guangdong Provincial People’s Hospital, Guangdong Academy of Medical Science, Guangzhou, People’s Republic of China; 6Guangzhou Yuexiu District Center for Disease Control and Prevention, Guangzhou, People’s Republic of China; 7Guangzhou Baiyun District Center for Disease Control and Prevention, Guangzhou, People’s Republic of China
*These authors contributed equally to this work
Correspondence: Xudong Liu; Hai Deng Tel +86-20-87330619
; +86-20-83827812-10263
Email [email protected]; [email protected]
Objective: The effect of dietary factors on OSA remains unclear. This study was to investigate the association of obstructive sleep apnea (OSA) with individual and overall effects of eating habits among adult Chinese.
Methods: A total of 9733 participants were selected from the baseline survey of the Guangzhou Heart Study. OSA was ascertained by Berlin Questionnaire. Food consumption was collected using a food frequency questionnaire, and eating patterns were extracted by principal component analysis. Odds ratios (ORs) with 95% confidence intervals (95% CIs) were calculated by the logistic regression model.
Results: After adjustment for confounders, fried food intake with ≥ 1/week was associated with an increased risk of OSA (OR: 1.77, 95% CI: 1.37– 2.27), while fruit consumption of ≥ 1/day was associated with a 26% reduced risk of OSA (OR: 0.74, 95% CI: 0.62– 0.88). Three eating patterns were defined and labeled as pattern I, II, and III. Eating pattern III which had higher factor loadings of animal innards, fried food, salted food, carbonate, and non-carbonated beverages was associated with an increased risk of OSA (OR: 1.30, 95% CI: 1.09– 1.55) when comparing the highest with the lowest tertile of pattern score, after adjusting for confounders; every 1-unit increment of pattern III score was associated with an increased risk of OSA (OR: 1.09, 95% CI: 1.04– 1.14). Neither pattern I nor pattern II was observed to be associated with OSA risk.
Conclusion: A higher frequency intake of fruits was associated with a reduced OSA risk and a diet with higher levels of consumption of animal innards, fried food, salted food, carbonated beverages, and non-carbonated beverages may increase the risk of OSA.
Keywords: obstructive sleep apnea, eating habits, diet, fruits, fried food
Introduction
Obstructive sleep apnea (OSA) is a common sleep disorder in clinical practice, characterized by recurrent episodes of the partial or complete collapse of the upper airway during sleep, resulting in reduced or absent airflow lasting for at least 10 seconds and associated with either cortical arousal or a fall in blood oxygen saturation.1 OSA has caused a large disease burden worldwide,2 approximately one billion people were estimated to have OSA,1,3 and the number of OSA patients was already up to 176 million in China.3,4 OSA was a major cause of daytime sleepiness, contributing to diminished life quality, impaired work performance, and increased motor vehicle crash risk.5 OSA has also constituted a major treatable risk factor for hypertension, atrial fibrillation, heart failure, coronary heart disease, stroke, and death.6,7
The enormous human and financial costs that accompany OSA, and the challenge of treating it effectively once it has developed, make it an appropriate target for prevention. Nowadays increasing evidence has highlighted the benefit of dietary control. Researchers found that favoring high-fat foods or disliking high-fiber foods would be associated with increased OSA severity.8 A cross-sectional study in Greece revealed that OSA patients with the highest quartile of total red meat intake were three times more likely to have severe OSA than those with the lowest quartile.9 Consistently, several epidemiological studies found that low-energy diet, low carbohydrate diet, and Mediterranean diet were associated with a decreased risk of OSA severity,10–15 while the intake of red meat, unprocessed red meat, and proarteriosclerotic diet (high in calories, fat, and simple carbohydrates and low in fish, fresh fruits, and vegetables) could contribute to OSA severity.9,16 Although some evidence supported the protective effect of certain healthy dietary elements in treating OSA, only one study17 examined the association between dietary factors and sleep apnea risk. In a cross-section study based on the Multi-Ethnic Study of Atherosclerosis (MESA), Reid et al reported that the moderate-to-more severe OSA was negatively associated with dietary quality and whole grain intake, and positively with high red/processed meat.17
Some researchers suggested that independent of obesity, the dysregulation of appetite hormones and changes in central nervous system responses to food stimuli might link to sleep disorders.17,18 Besides, the consumption of food rich in antioxidants and phytochemicals can help to reduce reactive oxygen production and improve antioxidant status,19,20 which in turn can slow the development of systemic oxidative damage,21,22 and then have an important function in the prevention of OSA. Also, eating food containing high levels of advanced glycation end products may prompt the development of OSA by inducing oxidative stress and inflammation.23 However, there lacks epidemiological evidence of the association between dietary factors and the risk of OSA. Thus, this study was to examine the association between eating habits and risk of OSA through a population-based study, addressing the effect of both individual dietary components and overall dietary profile.
Methods
Study Setting and Subjects
The subjects in this study were recruited from the baseline survey of the Guangzhou Heart Study, which was performed between July 2015 and August 2017, and a total of 12,013 permanent residents aged 35 years or above were successfully interviewed. The detailed information of the Guangzhou Heart Study can be seen in our previous reports.24,25 Subjects who were permanent residents registered in the Guangzhou Household Register System, aged ≥35 years old, and have lived in selected communities for six months or more were included in this study. Those were excluded if they were aged 75 years old or above, lacked OSA-related information, had lung diseases including chronic obstructive pulmonary disease and chest pain, had heart diseases including heart failure, atrial fibrillation, and myocardial infarction, had mental and cognitive disorders including dementia, deaf mutters, and disturbance of understanding, had difficulty in mobility, such as leg pain and high paraplegia, had a history of malignant tumors, and were pregnant or lactating women. Ultimately, 9733 (81%) subjects were included for further analysis. No significant difference was observed in age and gender between subjects included and not included.
This study was approved by the Medical Ethics Committee of Guangdong Provincial People’s Hospital and by the Ethical Review Committee for Biomedical Research, School of Public Health, Sun Yat-sen University. The study was performed in accordance with the Declaration of Helsinki, and written informed consent was obtained from each subject.
OSA Ascertainment
OSA was assessed with Berlin Questionnaire, which was used to identify OSA patients in the community population and was proved to have good validity and reliability among Chinese.26,27 Berlin Questionnaire was consisted of ten questions in three categories, referring to snoring (category I), daytime somnolence (category II), body mass index (BMI), and hypertension (category III). If the results of category I and category II showed frequent symptoms (>3–4 times/week), the scores of these two categories were given positive score; if there was a history of hypertension or a BMI of more than 30 kg/m2, the category III was given positive score. A subject with a positive score on two or more categories was evaluated as having high risk and classified into the OSA group, otherwise as having low risk and classified into the non-OSA group.28
Dietary Exposure Assessment
A food frequency questionnaire (FFQ) with 22-food groups was used to collect exposure information of diet and dietary supplements, with a face-to-face approach. The 22 food groups in this FFQ included wheat and its products (noodles, bread, steamed buns, biscuits, etc.), rice and its products (rice noodles, rice flour, rice cakes, etc.), coarse grain (corn, millet, purple rice, sorghum, oats, buckwheat, etc.), beans and soy products (soybeans, miscellaneous beans, tofu, dried beancurd sticks, soy milk, etc.), red meat (beef, lamb, pork, etc.), poultry meat (chicken, duck, goose, pigeon, etc.), fish and aquatic products (fish, shrimp, crab, shellfish, squid, etc.), eggs (eggs of duck, goose, quail, etc), animal innards (pig liver/belly/intestines, chicken gizzards, foie gras, etc.), fried food (barbecue, fried dough sticks, fried cakes, French fries, etc.), salted food (sauce/preserved mustard, fermented bean curd, salted fish/meat, salted products, etc.), fresh vegetables (potatoes, Chinese cabbage, cabbage, rape, lettuce, pepper, broccoli, cauliflower, loofah, white radish, mustard, eggplant, tomato, carrots, etc.), nuts (melon seeds, chestnuts, peanuts, walnuts, cashews, pistachios, etc.), non-fermented milk (liquid milk, milk powder, etc.), fermented milk (yogurt, cheese, etc.), fresh fruits (apple, banana, pear, peach, orange, tangerine, grape, litchi, longan, watermelon, melon, kiwi, etc.), carbonated beverages (Cola, Sprite, Fanta, etc.), non-carbonated beverages (fruit and vegetable drinks, tea drinks, lactic acid drinks, orange, green tea, black tea, yogurt, etc.), vitamin supplements (vitamin C, B, K, D and multivitamin, etc.), mineral supplements (calcium, iron, zinc, etc.), healthcare products (traditional Chinese medicine, health products, etc.), and fish oil (fish oil, cod liver oil, etc.). The specific foods contained in each food group were shown in the Supplementary Table S1. A series of food pictures were provided to each subject to help recall food intake information when the survey was conducted. Subjects were asked to answer whether consumed a certain food group over the past twelve months. If their response was yes, their intake frequency of this certain food group further needed to be provided. Five defined options of the intake frequency were provided in advance (“<1 time per month”, “1 to 3 times per month”, “1 to 3 times per week”, “4 to 6 times per week”, “≥1 time per day”).
Potential Covariates Evaluation
A structured questionnaire was used to collect a wide range of information including social-demographic factors (age, gender, marital status, education level, and retirement), history of disease, cigarette smoking and alcohol consumption. Leisure-time physical activity was assessed by the modified Global Physical Activity Questionnaire, and the total volume of leisure-time physical activity was described by metabolic equivalent-hours per week (MET-hours/week); the details of the assessment of leisure-time physical activity has been shown in our latest report.25 In addition, each subject received a health examination according to examination protocols. Weight and height were measured to calculate body mass index (kg/m2); neck circumference, waist circumference, and hip circumference were measured and the latter two were used to calculate the waist–hip ratio. Systolic and diastolic blood pressure were measured three times, and then the mean of three measurements was calculated; a Subject whose systolic blood pressure ≥140 mmHg or diastolic blood pressure ≥90 mmHg was considered as having hypertension. Fasting blood sample of each subject was collected, and serum concentrations of fasting blood glucose, cholesterol, low-density lipoprotein cholesterol, and triglyceride were detected. A participant who self-reported physician-diagnosed diabetes or whose fasting blood glucose ≥7.0 mmol/L was considered to have diabetes. A participant who self-reported physician-diagnosed dyslipidemia or whose serum cholesterol of ≥5.2 mmol/L, low-density lipoprotein cholesterol of ≥3.4 mmol/L, or triglyceride of ≥1.7 mmol/L was defined as having dyslipidemia.29
Statistical Analysis
All statistical analyses were performed using R-software (version 3.1.3). P-value was derived from two-sided tests and of less than 0.05 was deemed to be statistically significant. Chi-square tests or t-tests were used to examine the difference of covariates between the OSA group and the non-OSA group. When analyzing the effect of a specific food group on OSA risk, a category of intake frequency was combined to an adjacent category, if this sample size in this category was small.
The eating patterns which represented the whole profile of the diet were then extracted using the principal components analysis (PCA) with varimax-rotated transformation,30–32 based on 22 food groups mentioned above. PCA uses the correlation matrix of food intake variables to identify common patterns of food consumption within the data in order to account for the largest amount of variation in diet.33 The varimax rotation is a statistical technique used to clarify the relationship among factors; it simplifies the loadings of items by removing the middle ground and more specifically identifying the factor upon which data load.34 In order to derive the eating patterns, a simple score was assigned to each category of the intake frequency of each food group: 1 score = “<1 time per month”, 2 scores = “1 to 3 times per month”, 3 scores = “1 to 3 times per week”, 4 scores = “4 to 6 times per week”, 5 scores = “≥1 time per day”. Dietary groups with absolute rotated factor loadings of ≥0.40 were referred to as “dominant components” hereafter. The eating pattern score of each subject was calculated using the regression method. A positive loading for a food group showed a direct association with the pattern, while a negative loading indicated that this food group inversely contributed to the pattern. Three eating patterns were successfully defined (Supplementary Table S2) and labeled as pattern I, pattern II and pattern III. The pattern I was characterized with a higher loading of beans and soy products, coarse grain, eggs, nuts, non-fermented milk, fermented milk, vitamin supplement, mineral supplement, healthcare products, and fish oil, explaining about 40.8% of total variance; Pattern II was characterized with a higher loading of red meat, poultry meat, and fish and aquatic product, explaining about 29.8% of the total variance; Pattern III was characterized with a higher loading of animal innards, fried food, salted food, carbonated beverages, and non-carbonated beverages, explaining about 29.5% of the total variance. The scores of patterns were then transformed into categorical variables using the tertile method.
Unadjusted and adjusted odds ratios (OR) with 95% confidence intervals (95% CIs) were calculated via the logistic regression model to assess the association of OSA risk with individual food groups and with eating patterns. In the multivariable models, we firstly only adjusted for the potential confounders, and then adjusted for both confounders and BMI, and finally further adjusted for three eating patterns and all confounders. In addition, the categories of each food group or medians of categories of each eating pattern score were included as a numerical variable in the logistic model to test for a linear trend. Potential nonlinear relationships were examined using restrited cubic splines. Stratified analyses were performed based on gender (male, female) and mean age (≤55, >55). The multiplicative interactions of each eating pattern with sex, and with age were examined, respectively, by using the likelihood ratio test, with a comparison of the likelihood scores of the two models with and without the interaction terms; however, no interaction was observed.
Results
A total of 1258 (13%) participants were classified into the OSA group and 8475 (87%) into the non-OSA group according to the Berlin Questionnaire (Table 1). The means of age, body mass index, waist–hip ratio, and neck circumference in the OSA group were all larger than those in the non-OSA group (all P < 0.001). More participants in the non-OSA group than in the OSA group were non-smokers, non-drinkers, and did not have hypertension, diabetes, and dyslipidemia (all P < 0.001). The mean of the eating pattern I score was significantly higher in the non-OSA group (P < 0.001), whereas the mean of eating pattern III score was significantly higher in the OSA group (P < 0.001); the non-OSA group and the OSA group had a similar score of eating pattern II (Figure 1).
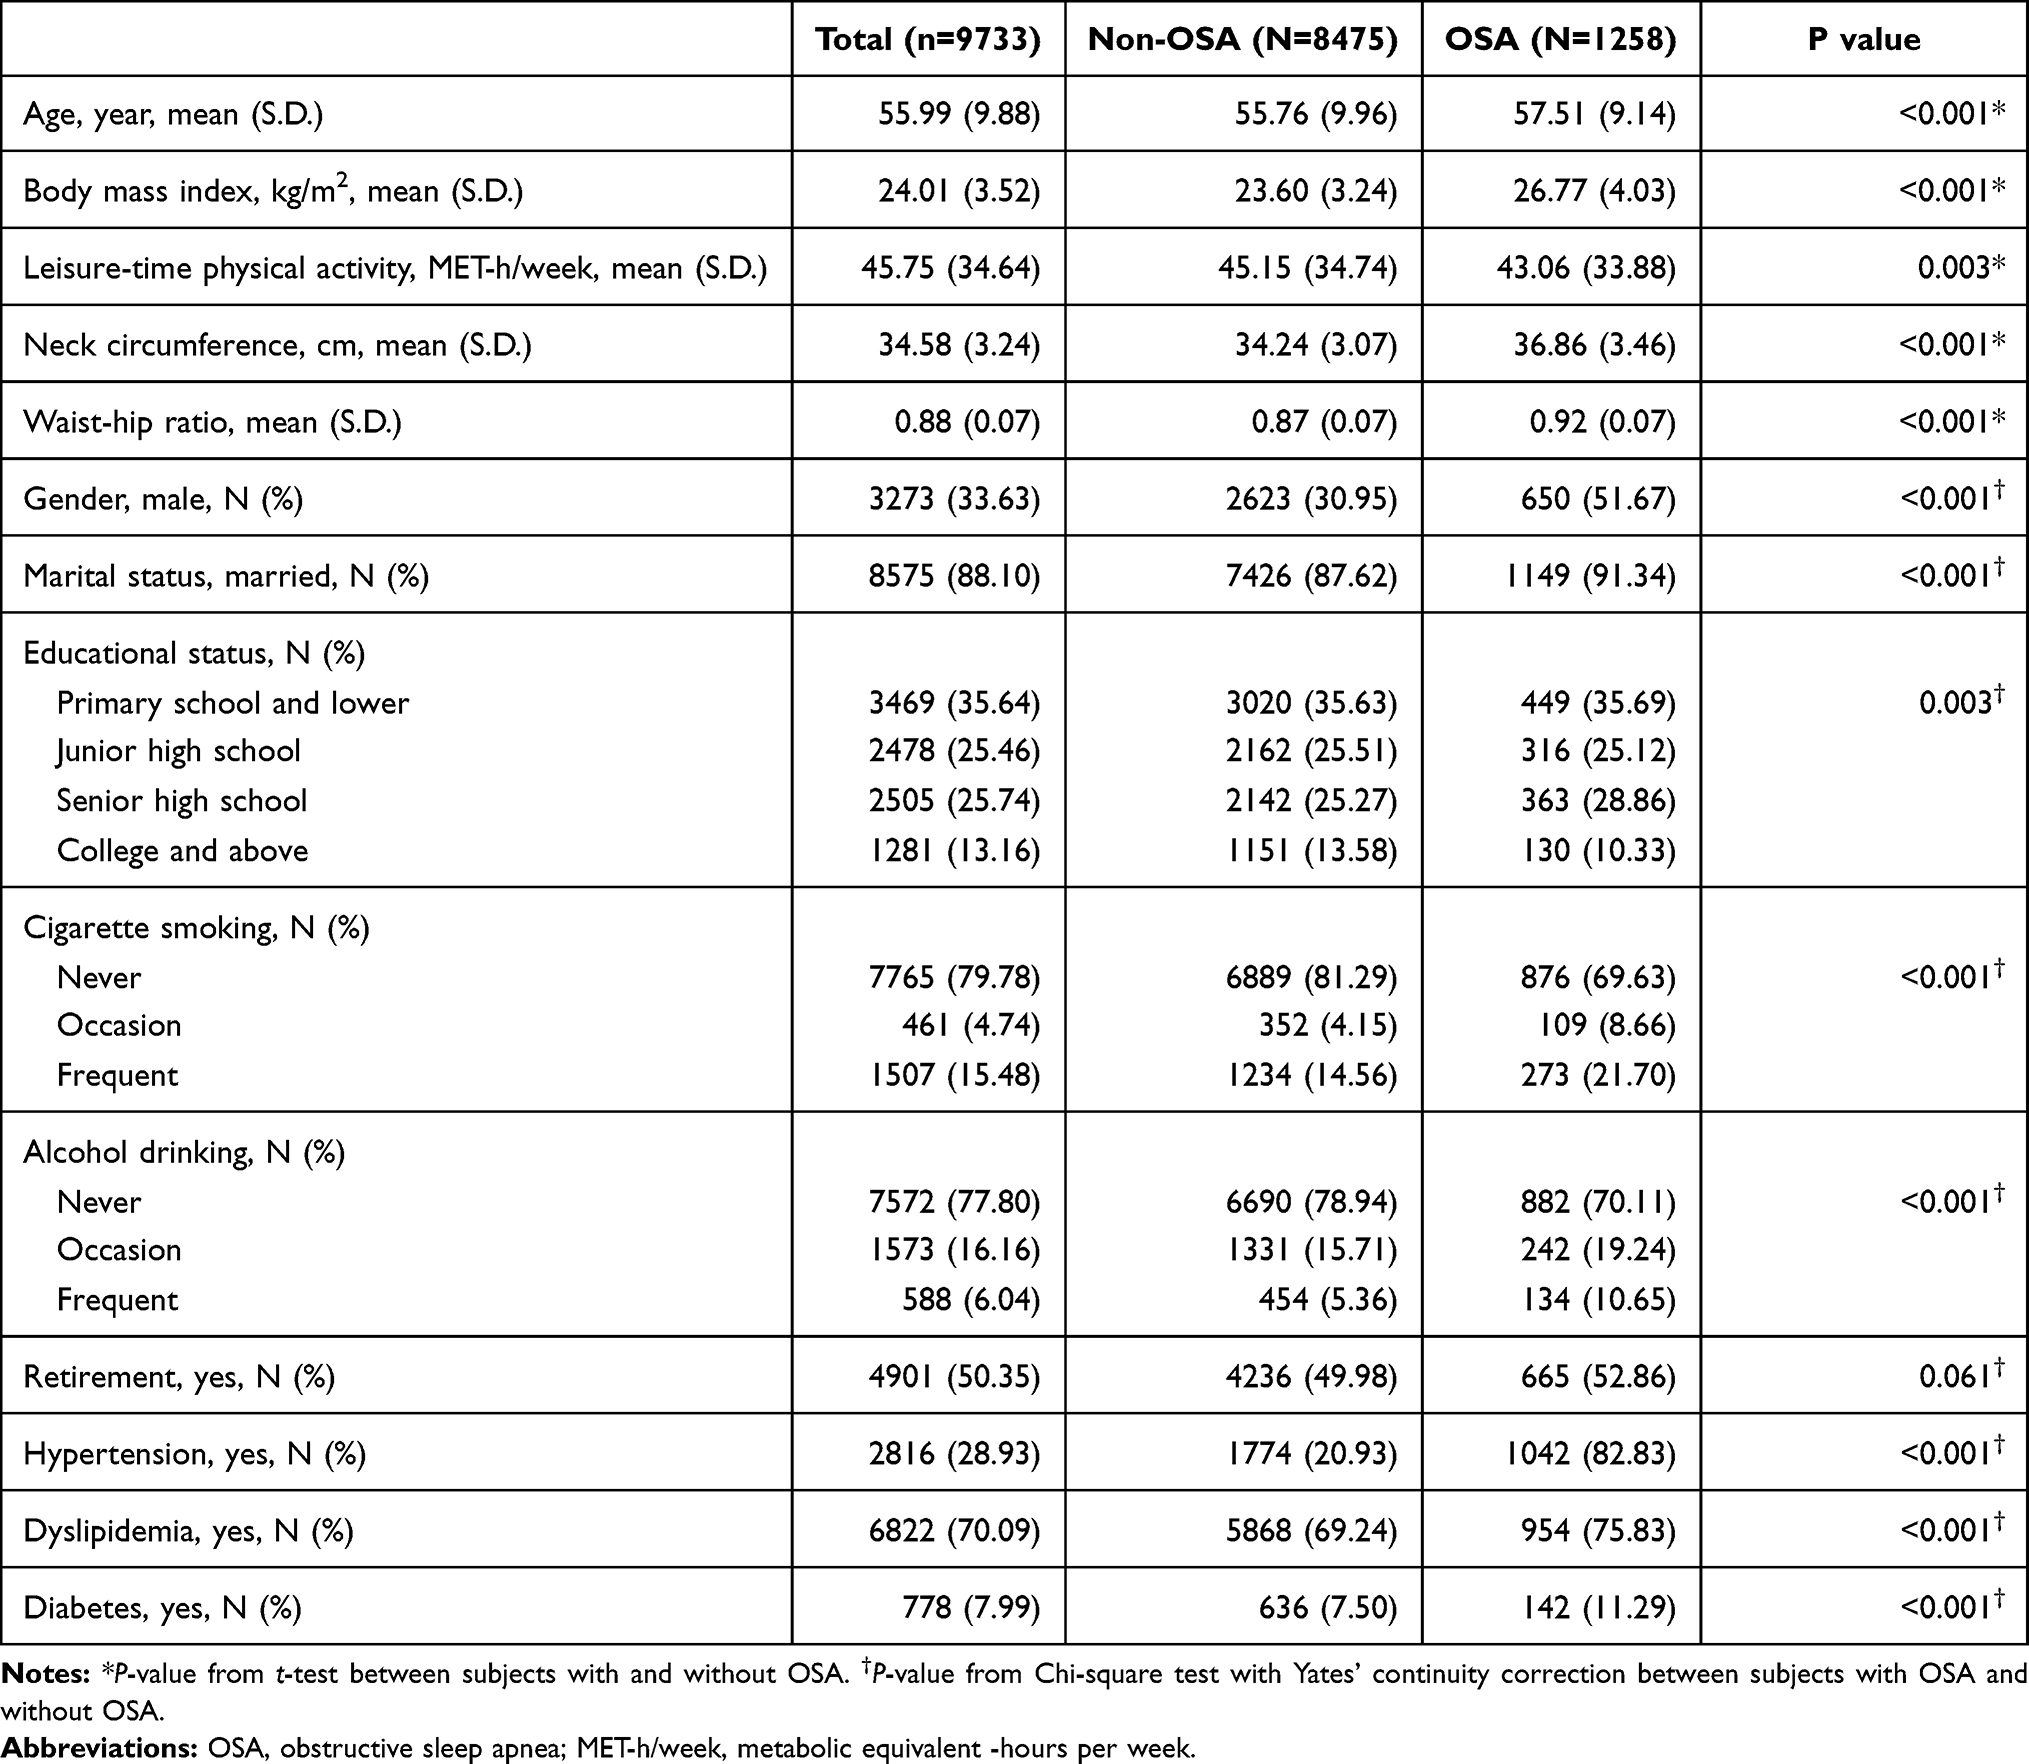 |
Table 1 Basic Characteristics of the Study Subjects |
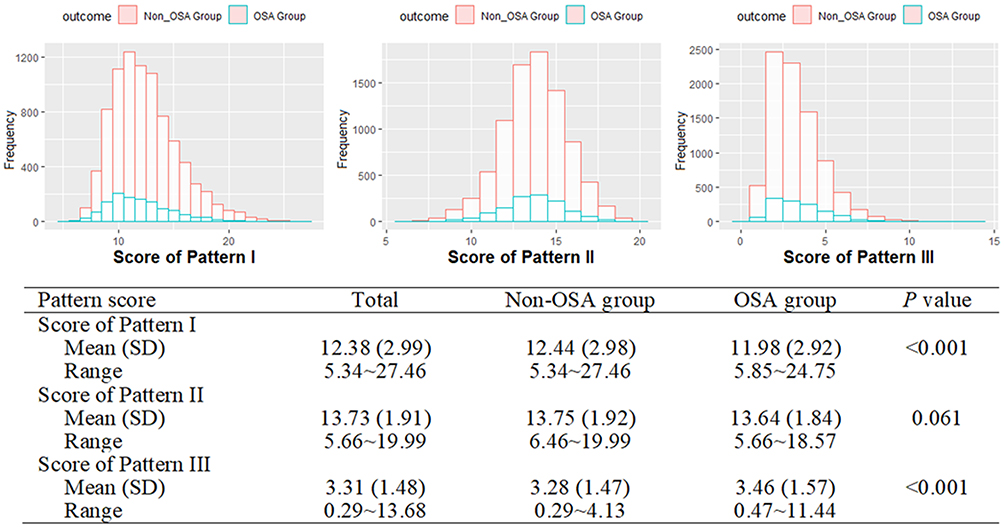 |
Figure 1 Distribution of scores of three eating patterns. |
The association between intake frequency of each dietary group and risk of OSA is presented in Table 2. In comparison to the consumption of ≤3/week, the consumption of the fruits of ≥1/day was associated with a 26% reduced risk of OSA (OR: 0.74, 95% CI: 0.62–0.88, P-trend < 0.001) after adjustment for covariates. When compared with the fried food intake of less than once per month, the fried food intake of once or more per week was associated with an increased risk of OSA (OR: 1.77, 95% CI: 1.37–2.27, P-trend < 0.001) after adjustment for covariates. Other 20 groups were not observed to be associated with the risk of OSA. Further adjustment for BMI and covariates did get consistent results. In the age-stratified analysis (Supplementary Table S3), similar results were observed among groups of both ≤55 years and >55 years. But in the gender-stratified analysis (Supplementary Table S4), consistent results were only observed in fried food intake rather than fruit intake. When comparing the intake of ≥1/day with of <3/week, a significant association of fruit intake with OSA risk was observed in males (OR: 0.58, 95% CI: 0.45–0.75) rather than in females (OR: 0.87, 95% CI: 0.68–1.12).
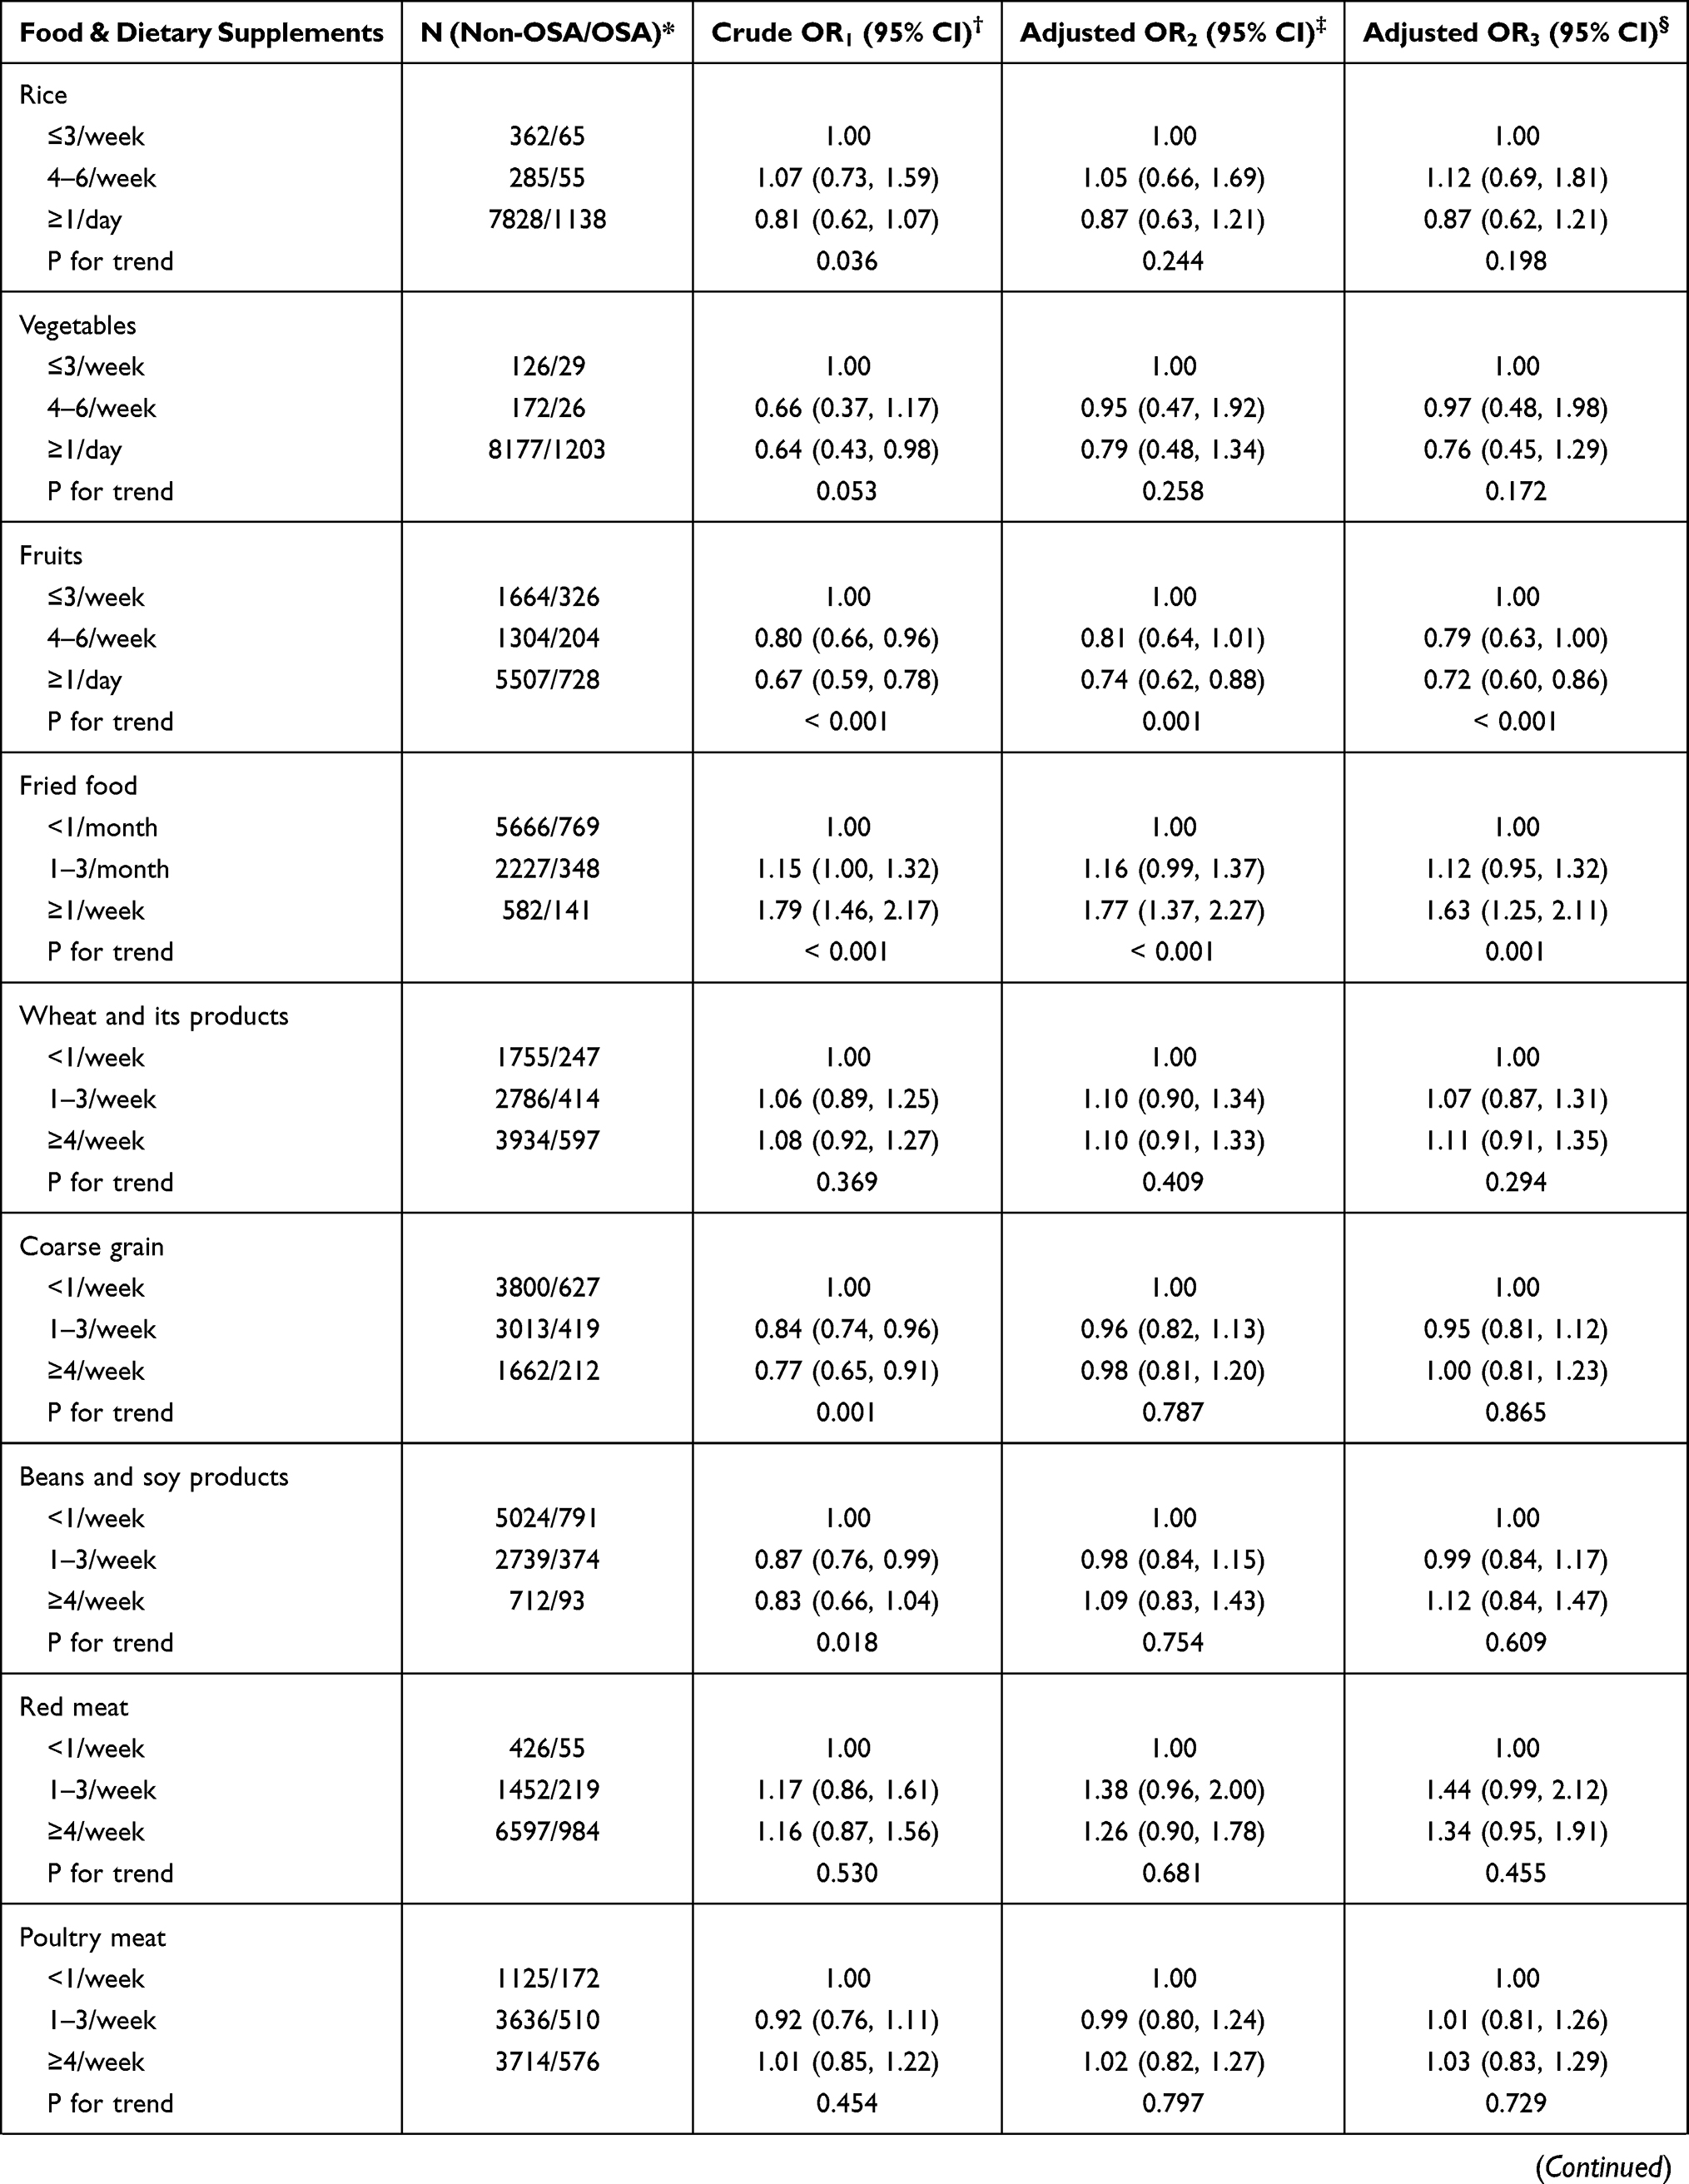 | 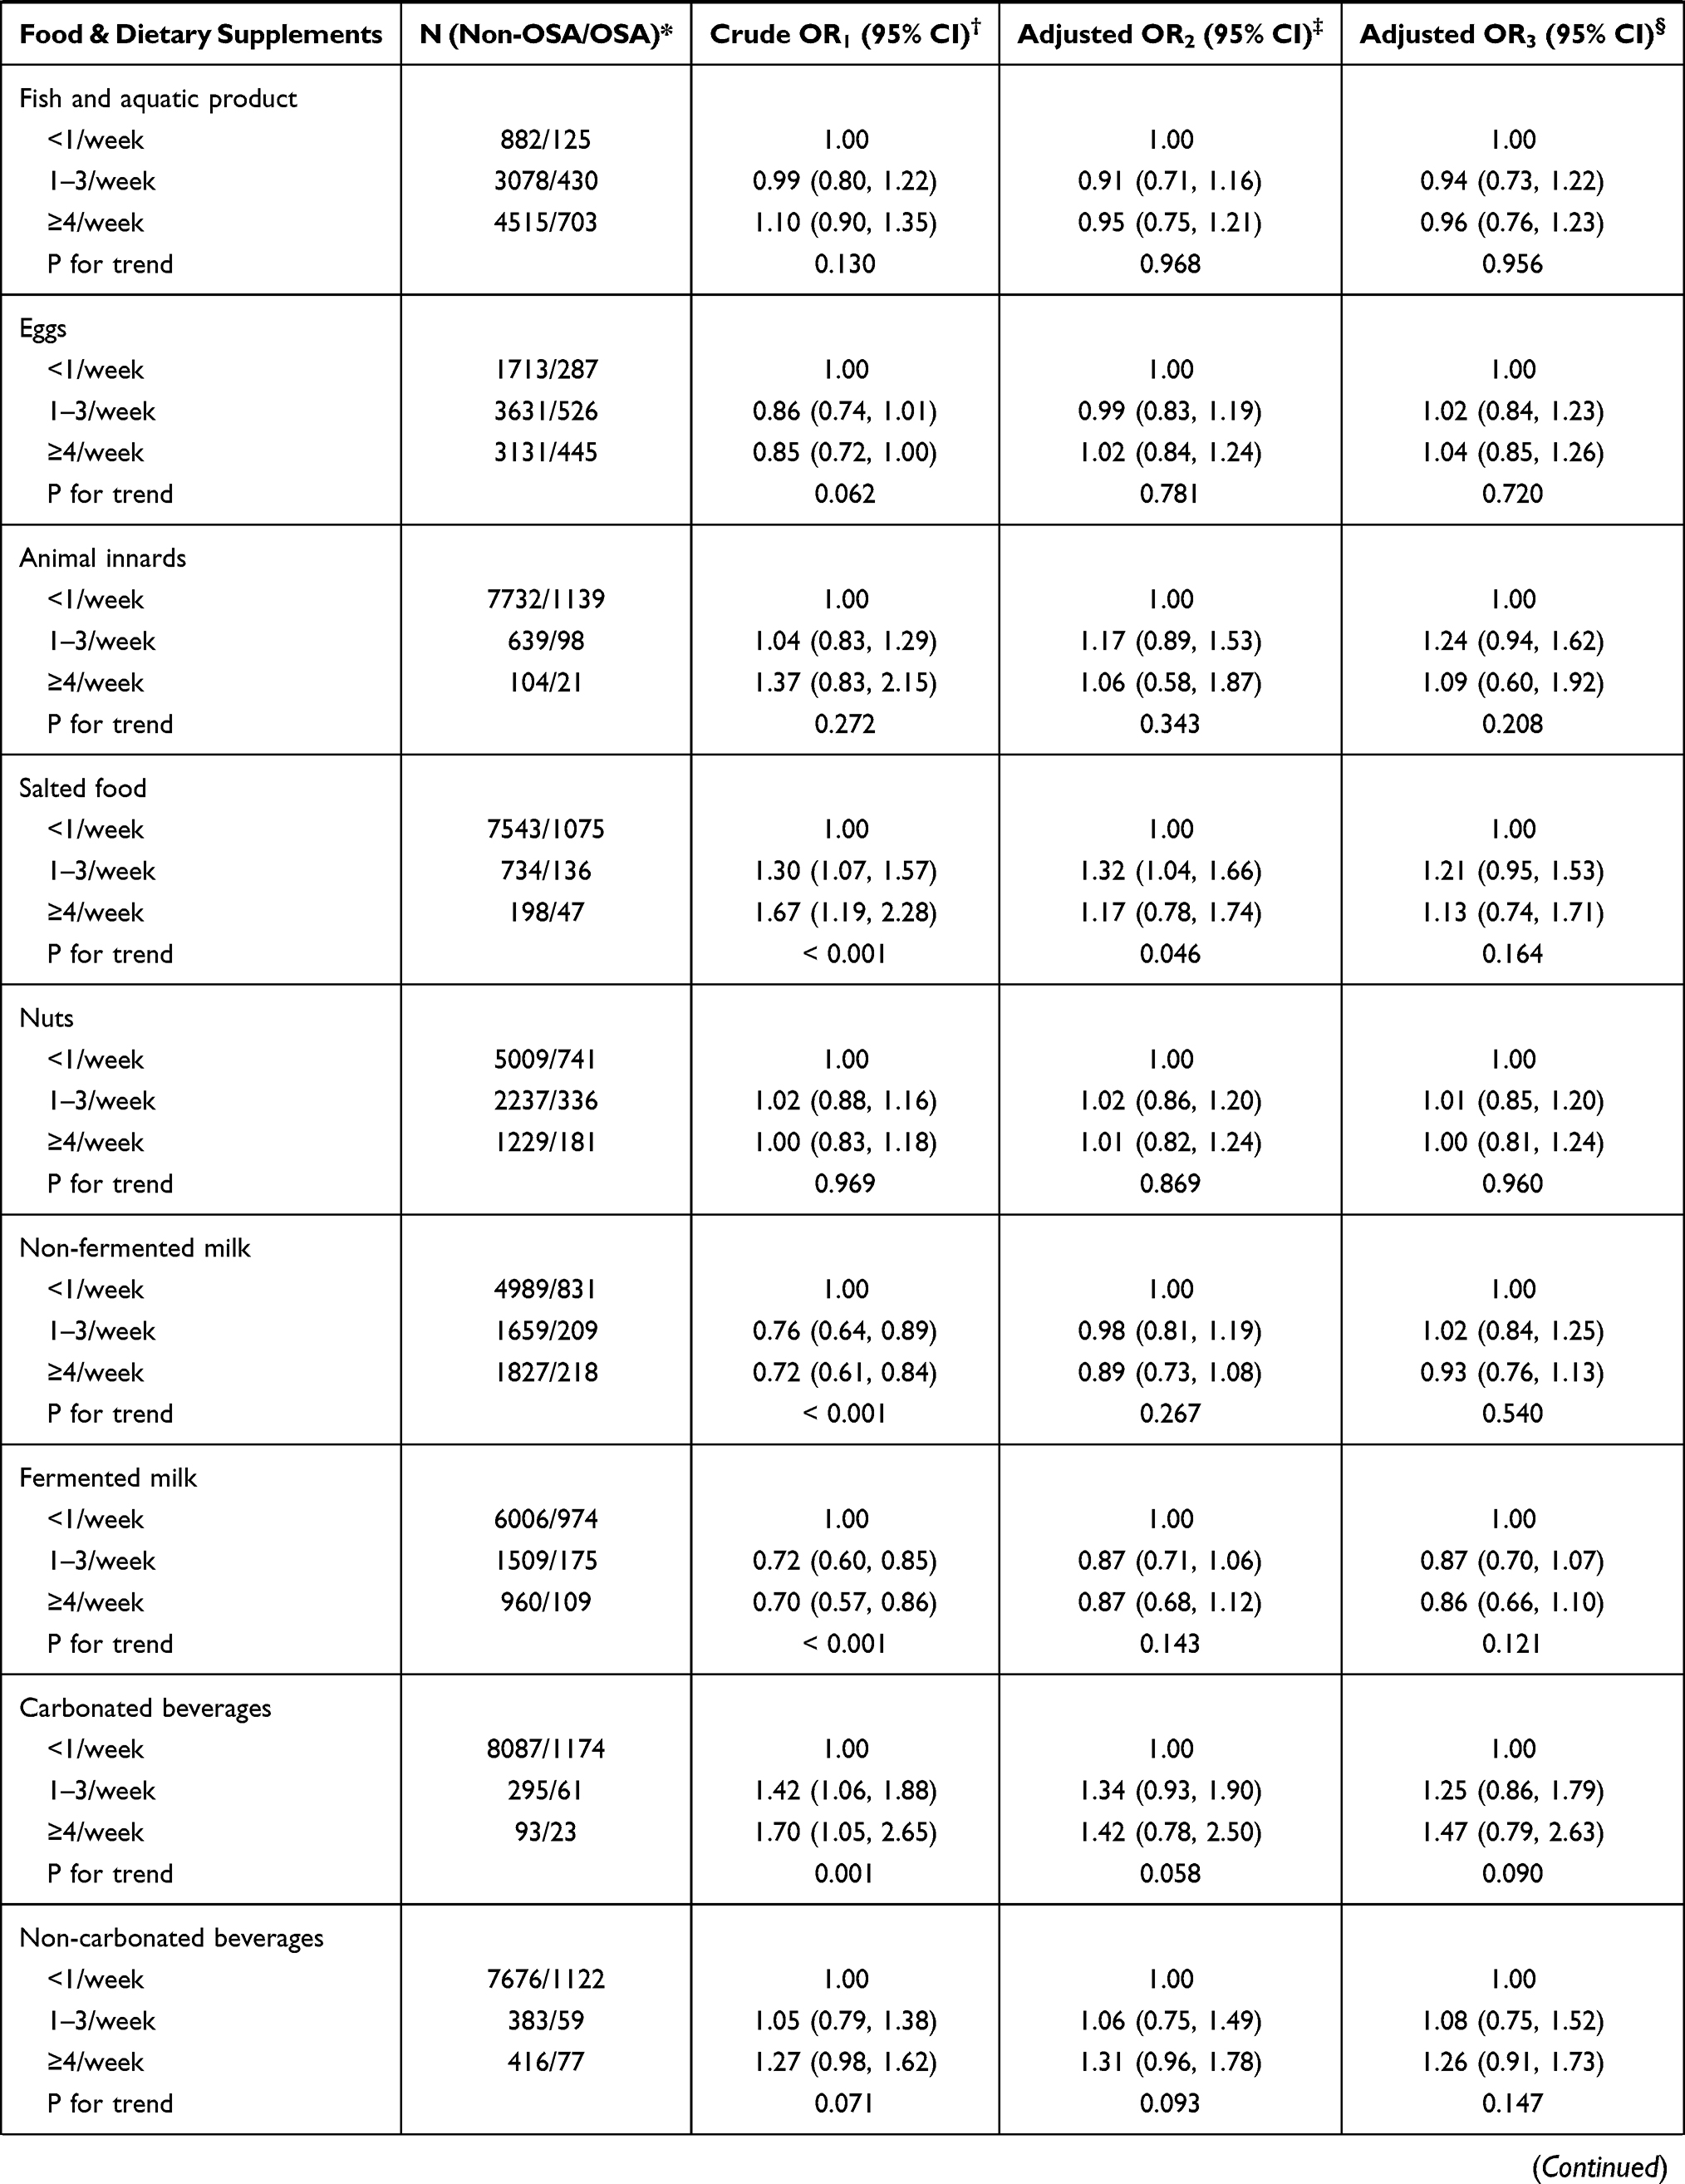 | 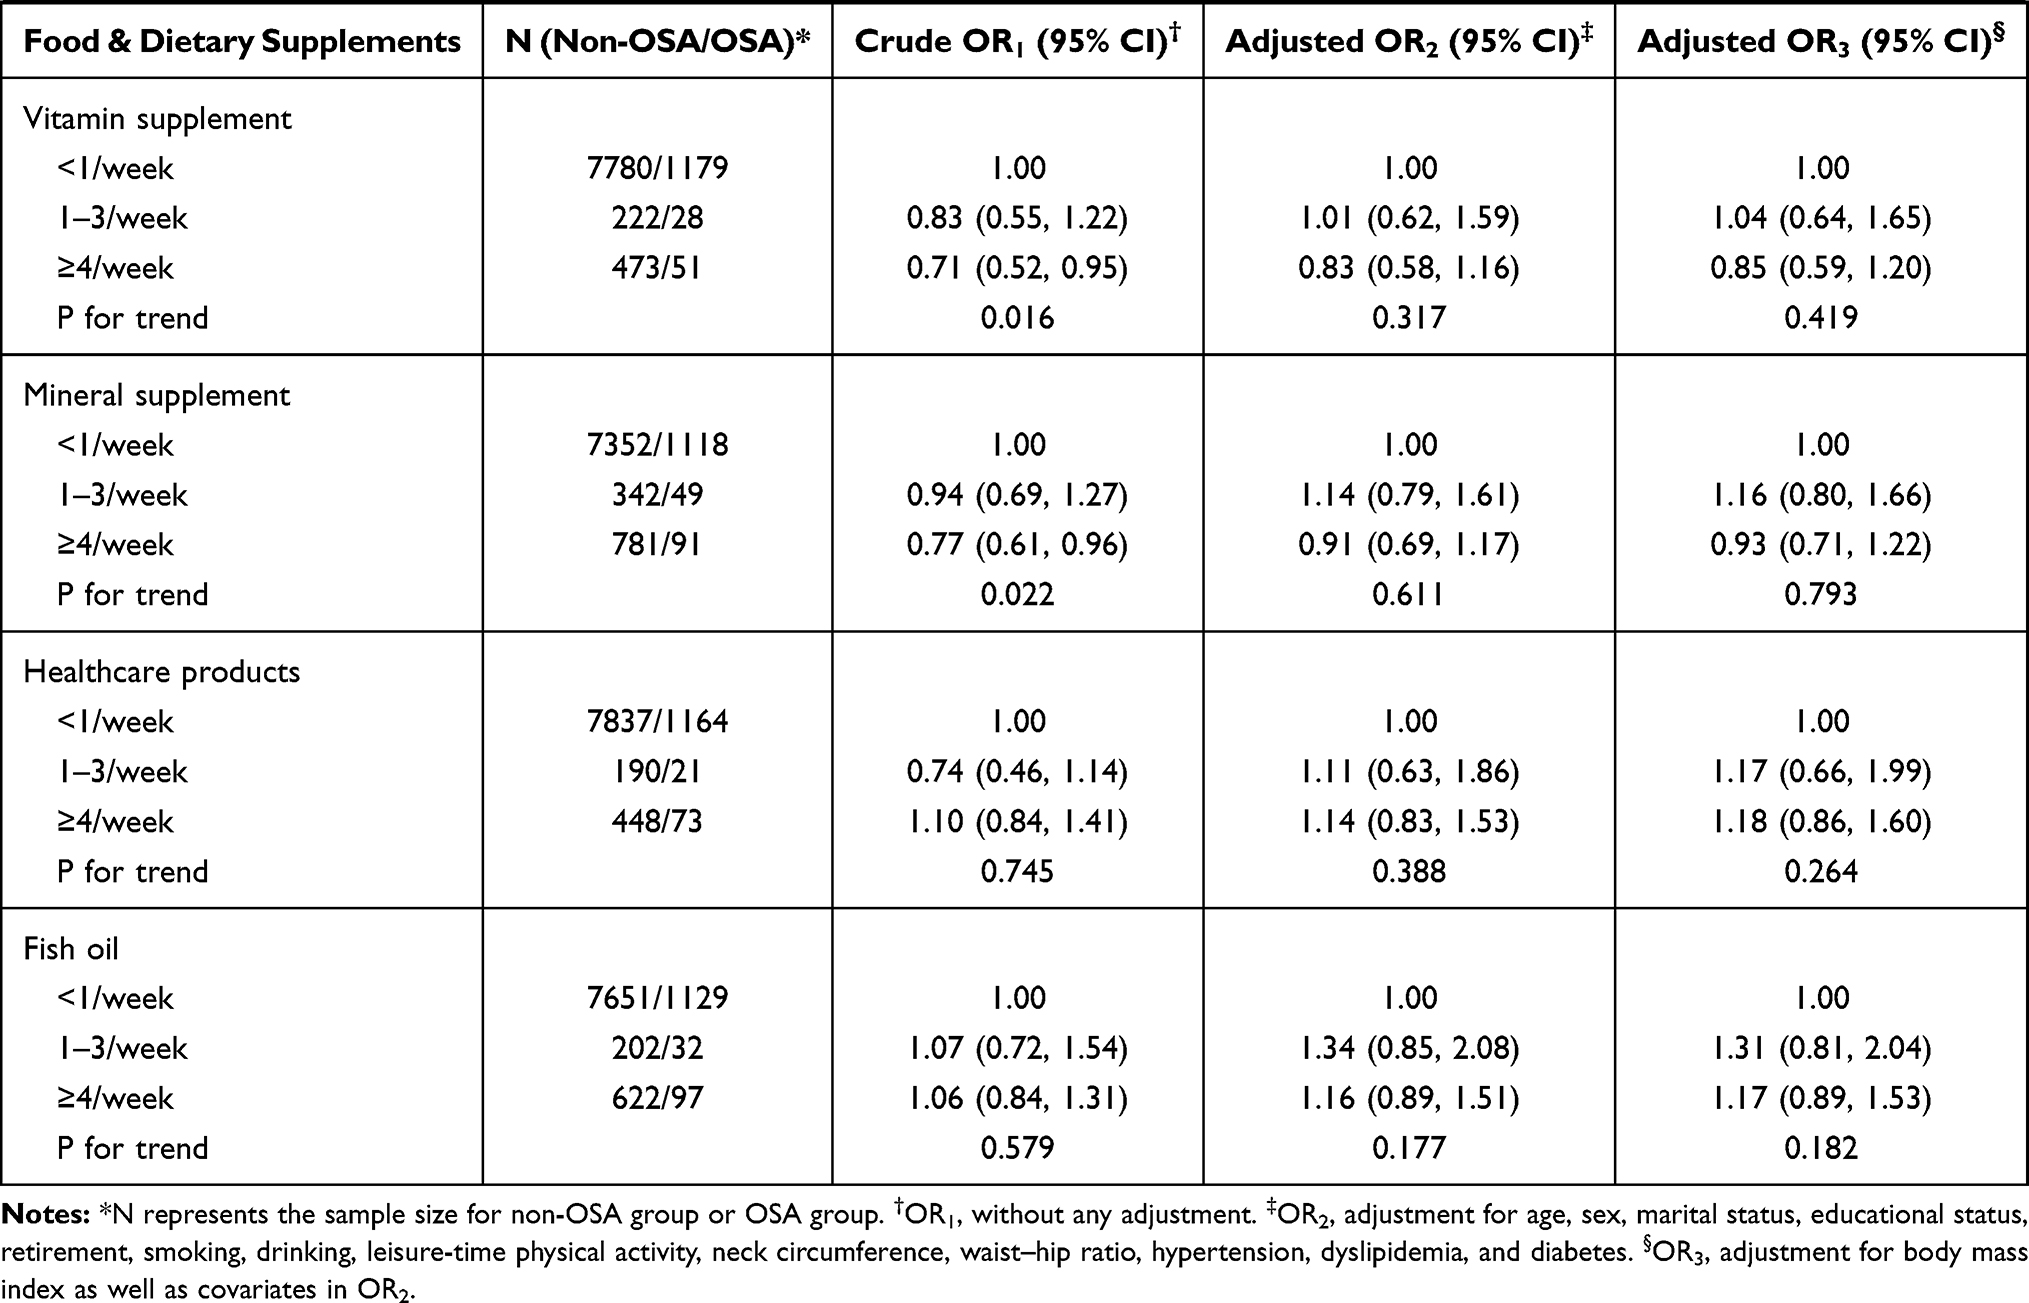 |
Table 2 The Association Between Food and Dietary Supplements Consumption and Risk of OSA |
Table 3 presents the association between three eating patterns and OSA risk. In comparison to those within the lowest tertile of pattern III score, participants within the highest tertile were associated with a 1.30-fold risk of OSA (OR: 1.30, 95% CI: 1.09–1.55, P-trend < 0.016) after adjustment for potential confounders. Every 1-unit increment of score of the Pattern III was associated with a 9% increased risk of OSA (OR: 1.09, 95% CI: 1.00–1.20). Neither pattern I nor Pattern II was observed to be related to the risk of OSA. The analysis by further adjustment for BMI and other two patterns also yield similar consistent results. Potential nonlinear relationships were examined using restricted cubic splines (Supplementary Figure S1); however, the nonlinear trend was not observed for any pattern.
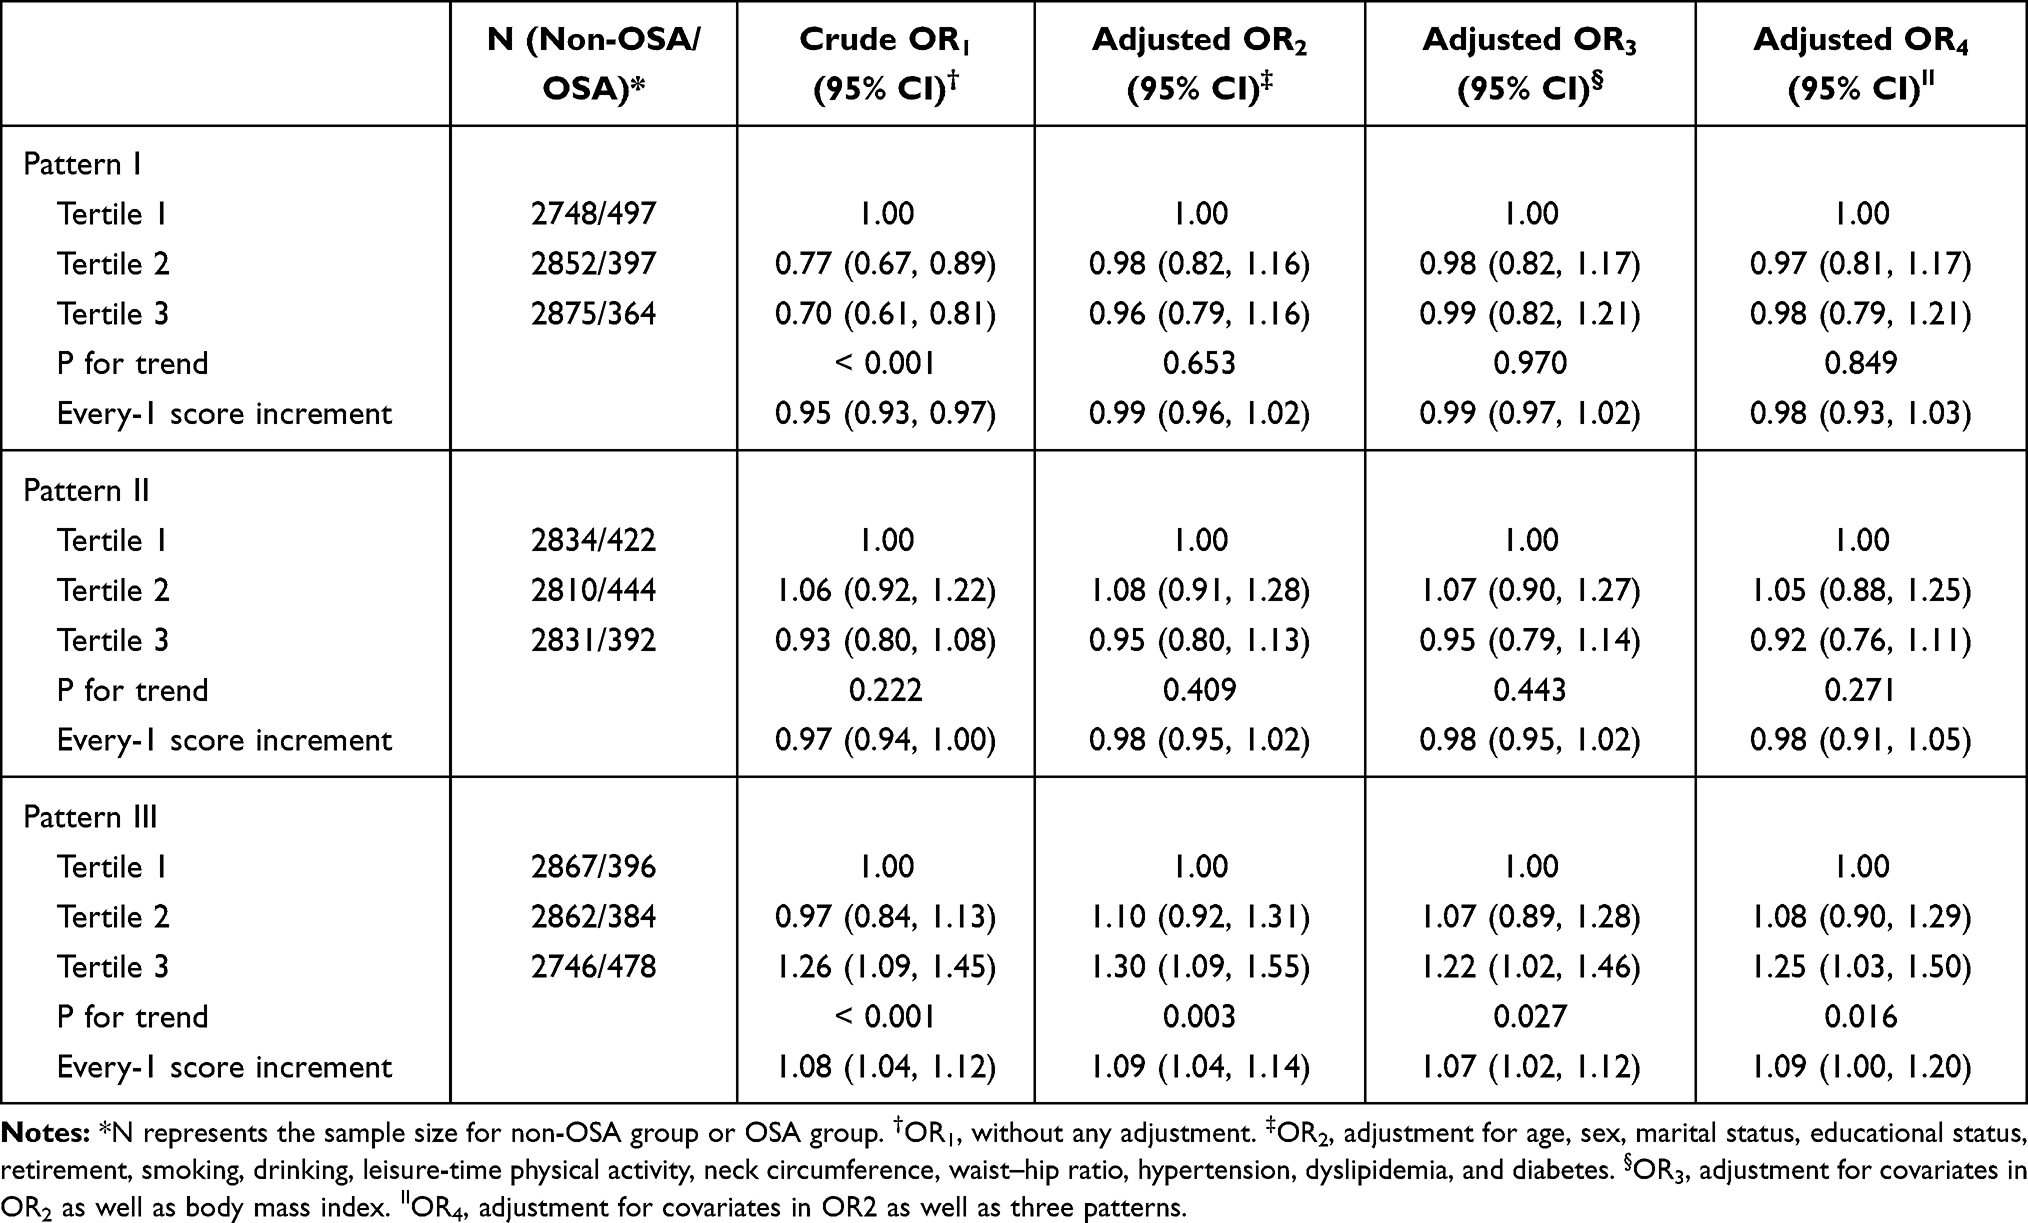 |
Table 3 The Association of Eating Patterns with Risk of OSA |
In stratified analysis by age (Supplementary Table S5), when comparing the highest with lowest tertiles of pattern score, we obtained the consistent results that pattern III was positively associated with OSA risk in participants within ≤55 years group (OR: 1.45, 95% CI = 1.07–1.97) and >55 years group (OR: 1.15, 95% CI = 1.01–1.45). In stratified analysis by gender, we also yielded similar results (Supplementary Table S6); when comparing the highest with lowest tertiles of pattern scores among males, pattern III was associated with a 42% (OR: 1.42, 95% CI = 1.07–1.88) increased risk with OSA; every 1 score increment of pattern III score was associated a 12% (OR: 1.12, 95% CI = 1.02–1.29) increased risk of OSA in females.
Discussion
Our results showed that fried food and eating pattern III, characterized as having higher factor loadings of animal innards, fried food, salted food, carbonated beverages, and non-carbonated beverages, were positively associated with risk of OSA, whereas higher frequency intake of fruits intake was associated with lower OSA risk. No significant association was observed for the remaining two eating patterns and other dietary groups.
In this study, fruit consumption more than once per day was found to be related to a decreased OSA risk, which was consistent with the results from a randomized trial in Greece that adherence to the Mediterranean diet, one of the characteristics of which was a higher proportion of fruit consumption, was effective in reducing the AHI and lessening the severity of OSA.14 Fruit also played a protective effect on OSA-related diseases, such as obesity,35,36 metabolic syndrome,37,38 diabetes,39 and cardiovascular disease.40 Several potential mechanisms were underlying the impact of fruit consumption on the risk of OSA. First, OSA was associated with oxidative stress.41 Fruits are abundant in antioxidants, such as vitamins C and E, Mg, K, folic acid, and phytochemicals. A higher intake of antioxidants can reduce reactive oxygen species and improve antioxidant status,19,20 which in turn can slow the development of systemic oxidative damage causing the overproduction of reactive oxygen species,21,22 and then have an important role in the prevention of OSA. Second, increased fruit consumption may raise the dietary fiber consumption and reduce fat intake, and this diet structure has been shown to be significantly associated with weight loss,42 and further to prevent fat deposition in the parapharyngeal fat pads and pharyngeal muscles. The stratified analysis by gender did get similar results, indicating the robustness of our results. However, the association of OSA risk with fruit intake was significant in males but not in females. Why the negative association is not significant for the female is not very clear. We guess this may be linked to gender differences. As we know, the male sex is a risk factor for OSA,43 possible explanations for the male predominance include hormonal effects on upper airway muscles and collapsibility, gender differences in body fat distribution, and differences in pharyngeal anatomy and function.43 Usually, female patients with OSA are older with less severe OSA and worse sleep quality than men, presenting more comorbidity, such as hypertension, diabetes mellitus, thyroid disease, and asthma,44 as well as higher symptoms of depression and insomnia.45 Thus, women may present different OSA phenotypes, which may explain the lower association between dietary patterns and OSA risk in females. Besides, this may also be related to the difference of OSA-related hormones between men and women.46 Progesterone in females can promote the ventilation function of the upper airway, especially when associated with estrogen.47 Moreover, upper airways in females are less collapsible and more stable during sleep than in males, through a variety of mechanisms that involve sex hormones but are not limited to them.46
For fried food, the process of frying modified the nutritional content of foods as well as the frying medium48 and led to an increase in trans fats and a decrease in unsaturated fats in foods.49 Our study found that fried food consumption more than once per week was associated with an increased risk of OSA. Stratified analysis by gender and age yielded consistent results. Several epidemiological studies also reported a positive association between fried food intake and overweight,50 obesity,51–53 waist circumference,54 or weight gain,55 all of which were risk factors for OSA. There are several possible explanations for the associations of fried foods with OSA, although the detailed mechanisms are not well understood. Frying could make food lose water and absorb fats,56 which in turn would increase the energy density of the food. Frying could also lead to excess energy intake by making food more aromatic and appealing in texture, thus improving food palatability.57 Additionally, frying deteriorates oils through the process of oxidation and hydrogenation, leading to a loss of unsaturated fatty acids such as linoleic acid and an increase in the corresponding trans-fatty acids such as trans-linoleic acid.58 Higher intakes of saturated and trans-fatty acids could increase the expression and secretion of inflammatory cytokines, such as IL-6 and CRP.59 Another possibility is the higher levels of dietary advanced glycation end products as a result of frying,23 which could have an important role in the development of OSA, mainly through induction of oxidative stress and inflammation.23
Using a single-food approach is limited by the multicollinearity of different dietary components and the inability to detect small effect;60 however, the cumulative effects of multiple dietary components included in a dietary pattern may be sufficiently large to be detectable.60 Our study used principal component analysis to define eating patterns and found that pattern III, which had higher factor loadings of animal innards, fried food, salted food, carbonated beverages, and non-carbonated beverages, was positively associated with OSA risk, no matter the pattern score was considered as a categorical variable or as a continuous variable. The stratified analysis also yielded similar results. Similar results can be seen in Cao’s research conducted in Changsha, China, which found that snack pattern (mainly intake of sugary beverages, coffee, and snacks) and oily pattern (mainly intake of meat, fried food, and pickled vegetables) increase the risk of sleep disorders.61 Fried food was one of the major components of pattern III, and the above analysis showed that fried food intake was positively associated risk of OSA. Apart from fried food, other components of pattern III including animal innards, salted food, carbonated beverages, and non-carbonated beverages were also labeled as unhealthy food in many other studies.61,62 Salted food was significantly associated with higher BMI and waist circumference.63 Meanwhile, salt intake was a potential risk factor for obesity independent of energy intake.64 Beverages, whatever carbonated, or non-carbonated, indicated a significant positive relationship with weight gain by the preponderance of epidemiological data from prospective cohort studies.65–67
In addition, current studies have found that underlying anatomical alterations and/or disturbances in upper airway neuromuscular control played key roles in the pathogenesis of OSA.1 A narrow upper airway, typically caused by fat deposition in the parapharyngeal fat pads and pharyngeal muscles increased the mechanical loads of airflow.1 This adipose tissue is also an abundant source of pro-inflammatory cytokines, including tumor necrosis factor (TNF)-α, IL-6, profibrogenic adipokine leptin, and others.68 Exposure of upper airway tissues to pro-inflammatory mediators, such as cytokines and reactive oxygen species, could alter tissue structure and function, and impair skeletal muscle contractility.41 Dietary factors can both inhibit and promote this undesirable change. Eating some food containing high levels of advanced glycation end products may prompt the development of OSA by inducing oxidative stress and inflammation, whereas the consumption of food rich in antioxidants and phytochemicals can help to reduce reactive oxygen production and improve antioxidant status,19,20 which in turn can slow the development of systemic oxidative damage,21,22 and then is beneficial to prevent OSA.
To our best knowledge, this is the first study to examine the association of OSA risk with both individual food groups and eating patterns among the Chinese adult population. The strengths of the present study are shown as follows. First, the subjects were selected by using the multistage sampling method, which can to some degree ensure the representativeness of samples and help to avoid selection bias. Moreover, a relatively large sample size and adjustment for a wide range of confounding factors also help to increase statistical power and minimize confounding bias. Second, dietary patterns extracted by the principal component analysis comprehensively reflected the overall effect of food groups on OSA risk and can help to overcome issues of the multicollinearity of food, nutrients, and dietary supplements. Third, the questionnaire survey is carried out face to face by highly trained investigators, which can to some degree to reduce the information bias.
However, there are some limitations. Firstly, information on eating habits over the past 12 months was collected through the food frequency questionnaire, which might lead to recall bias inevitably. Besides, the intake amount of each food group was not collected, so we cannot calculate the total energy intake. However, in this study, we took leisure-time physical activity as a confounder and further adjusted BMI when did sensitivity analysis, these can be taken as an indirect alternative approach. Secondly, multiple tests for the 22 food groups or supplements might lead to false associations, but the results for individual food groups prompted us to conduct dietary pattern analysis to overcome the defects of methods based on a single component. Thirdly, we used Berlin Questionnaire to assess OSA but not polysomnography; however, polysomnography is unsuitable for large-scale epidemiological investigation due to the high cost and inconvenience, and Berlin Questionnaire is widely used in a community-based epidemiological study. Last, this study was a cross-sectional study, which had great limitations on causal inference. Our further study with follow-up will address these limitations.
In conclusion, a higher frequency intake of fruits was associated with a reduced OSA risk, while a diet with higher-level consumption of animal innards, fried food, salted food, carbonated beverages, and non-carbonated beverages may increase the risk of OSA in adult Chinese. Results from this study indicate that preventive strategies for OSA should consider both single dietary components and complex dietary patterns.
Data Sharing Statement
The data used to support the findings of this study are available from the corresponding author upon request. A proposal with detailed description of study objectives and statistical analysis plan will be needed for evaluation of the reasonability of requests if someone requests data sharing.
Ethics Approval
Approval was obtained from the Medical Ethics Committee of Guangdong Provincial People’s Hospital and Ethical Review Committee for Biomedical Research, School of Public Health, Sun Yat-sen University. The procedures used in this study adhere to the tenets of the Declaration of Helsinki. The participants were required to sign a written informed consent form before joining in the study. The participants and/or the public were not involved in the design, or conduct, or reporting or disseminating plans of this research.
Consent to Publication
All co-authors provided comments and approved the final version.
Acknowledgments
The authors would like to thank epidemiologists, nurses, and doctors in Guangdong Provincial People’s Hospital, in Guangzhou Center for Disease Control and Prevention, and in community healthcare centers in data collection, and thank all study subjects for their participation.
Author Contributions
XDL and HD conceived and designed the study; XRD, MRZ, FW, DEL, LXL, HYL and ZXY collected the data, YD and XDL analyzed the data, YD, XRD and JH drafted the manuscript, WJZ, ZMR, HD and XDL reviewed and edited the manuscript. All authors contributed to data analysis, drafting or revising the article, have agreed on the journal to which the article will be submitted, gave final approval of the version to be published, and agree to be accountable for all aspects of the work.
Funding
This work was supported by the Guangdong Provincial Key R&D Program (No.2019B020230004), the National Key R&D Program of China (No. 2018YFC1312502, No. 2018YFE0208000), the Science and Technology Program of Guangzhou City (No.202102080404), and the Guangdong Basic and Applied Basic Research Foundation (No. 2019A1515011599). The founder had no role in the design, analysis or writing of this manuscript.
Disclosure
The authors state that they have no conflicts of interest.
References
1. Gottlieb DJ, Punjabi NM. Diagnosis and management of obstructive sleep apnea. JAMA. 2020;323(14):14. doi:10.1001/jama.2020.3514
2. Lyons MM, Bhatt NY, Pack AI, et al. Global burden of sleep-disordered breathing and its implications. Respirology. 2020;25(7):690–702. doi:10.1111/resp.13838
3. Benjafield AV, Ayas NT, Eastwood PR, et al. Estimation of the global prevalence and burden of obstructive sleep apnoea: a literature-based analysis. Lancet Resp Med. 2019;7(8):687–698. doi:10.1016/S2213-2600(19)30198-5
4. Senaratna CV, Perret JL, Lodge CJ, et al. Prevalence of obstructive sleep apnea in the general population: a systematic review. Sleep Med Rev. 2017;34:70–81. doi:10.1016/j.smrv.2016.07.002
5. Young T, Peppard PE, Gottlieb DJ. Epidemiology of obstructive sleep apnea: a population health perspective. Am J Respir Crit Care Med. 2002;165(9):1217–1239. doi:10.1164/rccm.2109080
6. Javaheri S, Barbe F, Campos-Rodriguez F, et al. Sleep apnea types, mechanisms, and clinical cardiovascular consequences. J Am Coll Cardiol. 2017;69(7):841–858. doi:10.1016/j.jacc.2016.11.069
7. Punjabi NM, Caffo BS, Goodwin JL, et al. Sleep-disordered breathing and mortality: a prospective cohort study. PLoS Med. 2009;6(8):e1000132. doi:10.1371/journal.pmed.1000132
8. Smith SS, Waight C, Doyle G, et al. Liking for high fat foods in patients with obstructive sleep apnoea. Appetite. 2014;78:185–192. doi:10.1016/j.appet.2014.03.019
9. Kechribari I, Kontogianni MD, Georgoulis M, et al. Associations between red meat intake and sleep parameters in patients with obstructive sleep apnea. J Acad Nutr Diet. 2020;120(6):1042–1053. doi:10.1016/j.j.2019.10.016
10. Dobrosielski DA, Papandreou C, Patil SP, et al. Diet and exercise in the management of obstructive sleep apnoea and cardiovascular disease risk. Eur Respir Rev. 2017;26(144):160110. doi:10.1183/16000617.0110-2016
11. Edwards BA, Bristow C, O’Driscoll DM, et al. Assessing the impact of diet, exercise and the combination of the two as a treatment for OSA: a systematic review and meta-analysis. Respirology. 2019;24(8):740–751. doi:10.1111/resp.13580
12. Fernandes JFR, Araujo LD, Kaiser SE, et al. The effects of moderate energy restriction on apnoea severity and CVD risk factors in obese patients with obstructive sleep apnoea. Br Med J. 2015;114(12):2022–2031. doi:10.1017/S0007114515004018
13. Johansson K, Neovius M, Lagerros YT, et al. Effect of a very low energy diet on moderate and severe obstructive sleep apnoea in obese men: a randomised controlled trial. Br Med J. 2009;339(10):b4609–b4609. doi:10.1136/bmj.b4609
14. Papandreou C, Schiza SE, Bouloukaki I, et al. Effect of Mediterranean diet versus prudent diet combined with physical activity on OSAS: a randomised trial. Eur Respir J. 2012;39(6):1398–1404. doi:10.1183/09031936.00103411
15. Tokuchi Y, Nakamura Y, Munekata Y, et al. Low carbohydrate diet-based intervention for obstructive sleep apnea and primary hypothyroidism in an obese Japanese man. Asia Pac Fam Med. 2016;15(1):4. doi:10.1186/s12930-016-0029-8
16. Jeznach-Steinhagen A, Okreglicka K, Nitsch-Osuch A, et al. Nutritional status and dietary patterns in adults with severe obstructive sleep apnea. Adv Exp Med Biol. 2020;1279:71–79. doi:10.1007/5584_2020_507
17. Reid M, Maras JE, Shea S, et al. Association between diet quality and sleep apnea in the multi-ethnic study of atherosclerosis. Sleep. 2019;42(1):zsy194. doi:10.1093/sleep/zsy194
18. Chaput JP, St-Onge MP. Increased food intake by insufficient sleep in humans: are we jumping the gun on the hormonal explanation? Front Endocrinol. 2014;5:116. doi:10.3389/fendo.2014.00116
19. Bokov A, Chaudhuri A, Richardson A. The role of oxidative damage and stress in aging. Mech Ageing Dev. 2004;125(10–11):811–826. doi:10.1016/j.mad.2004.07.009
20. Qiao Q; Group DS. Comparison of different definitions of the metabolic syndrome in relation to cardiovascular mortality in European men and women. Diabetologia. 2006;49(12):2837–2846. doi:10.1007/s00125-006-0438-6
21. Grundy SM. Metabolic syndrome: a multiplex cardiovascular risk factor. J Clin Endocrinol Metab. 2007;92(2):399–404. doi:10.1210/jc.2006-0513
22. Palmieri VO, Grattagliano I, Portincasa P, et al. Systemic oxidative alterations are associated with visceral adiposity and liver steatosis in patients with metabolic syndrome. J Nutr. 2006;136(12):3022–3026. doi:10.1093/jn/136.12.3022
23. Sun YB, Liu BY, Snetselaar LG, et al. Association of fried food consumption with all cause, cardiovascular, and cancer mortality: prospective cohort study. Br Med J. 2019;364. doi:10.1136/bmj.k5420
24. Deng H, Guo P, Zheng M, et al. Epidemiological characteristics of atrial fibrillation in Southern China: results from the Guangzhou heart study. Sci Rep. 2018;8(1):17829. doi:10.1038/s41598-018-35928-w
25. Duan X, Zheng M, He S, et al. Association between physical activity and risk of obstructive sleep apnea. Sleep Breath. 2021:1. doi:10.1007/s11325-021-02318-y
26. Ha SC, Lee DL, Abdullah VJ, et al. Evaluation and validation of four translated Chinese questionnaires for obstructive sleep apnea patients in Hong Kong. Sleep Breath. 2014;18(4):715–721. doi:10.1007/s11325-013-0889-1
27. Tan A, Yin JSDC, Tan LDWL, et al. Using the Berlin questionnaire to predict obstructive sleep apnea in the general population. J Clin Sleep Med. 2017;13(3):427–432. doi:10.5664/jcsm.6496
28. Netzer NC, Stoohs RA, Netzer CM, et al. Using the Berlin questionnaire to identify patients at risk for the sleep apnea syndrome. Ann Intern Med. 1999;131(7):485. doi:10.7326/0003-4819-131-7-199910050-00002
29. Duan XR, Zheng MR, He SF, et al. Association between physical activity and risk of obstructive sleep apnea. Sleep Breath. 2021:1 doi:10.1007/s11325-021-02318-y
30. Smith AD, Emmett PM, Newby PK, et al. Dietary patterns obtained through principal components analysis: the effect of input variable quantification. Br J Nutr. 2013;109(10):1881–1891. doi:10.1017/s0007114512003868
31. Rösler F, Manzey D. Principal components and varimax-rotated components in event-related potential research: some remarks on their interpretation. Biol Psychol. 1981;13:3–26. doi:10.1016/0301-0511(81)90024-7
32. Willett W. Nutritional Epidemiology.
33. Zhao J, Li Z, Gao Q, et al. A review of statistical methods for dietary pattern analysis. Nutr J. 2021;20(1):37. doi:10.1186/s12937-021-00692-7
34. Dilbeck EK. Factor Analysis: Varimax Rotation. In: Allen M, The SAGE Encyclopedia of Communication Research Methods. Thousand Oaks, CA: SAGE Publications, Inc; 2017.
35. Schwingshackl L, Hoffmann G, Kalle-Uhlmann T, et al. Fruit and vegetable consumption and changes in anthropometric variables in adult populations: a systematic review and meta-analysis of prospective cohort studies. PLoS One. 2015;10(10):e0140846. doi:10.1371/journal.pone.0140846
36. Yuan S, Yu HJ, Liu MW, et al. The association of fruit and vegetable consumption with changes in weight and body mass index in Chinese adults: a cohort study. Public Health. 2018;157:121–126. doi:10.1016/j.puhe.2018.01.027
37. Lee M, Lim M, Kim J. Fruit and vegetable consumption and the metabolic syndrome: a systematic review and dose-response meta-analysis. Br Med J. 2019;122(7):723–733. doi:10.1017/S000711451900165x
38. Tian Y, Su LJ, Wang JT, et al. Fruit and vegetable consumption and risk of the metabolic syndrome: a meta-analysis. Public Health Nutr. 2018;21(4):756–765. doi:10.1017/S136898001700310x
39. Basiak-Rasala A, Rozanska D, Zatonska K. Food groups in dietary prevention of type 2 diabetes. Rocz Panstw Zakl Hig. 2019;70(4):347–357. doi:10.32394/rpzh.2019.0086
40. D’Alessandro A, De Pergola G. The Mediterranean diet: its definition and evaluation of a priori dietary indexes in primary cardiovascular prevention. Int J Food Sci Nutr. 2018;69(6):647–659. doi:10.1080/09637486.2017.1417978
41. Kimoff RJ, Hamid Q, Divangahi M, et al. Increased upper airway cytokines and oxidative stress in severe obstructive sleep apnoea. Eur Respir J. 2011;38(1):89–97. doi:10.1183/09031936.00048610
42. Bertoia ML, Mukamal KJ, Cahill LE, et al. Changes in intake of fruits and vegetables and weight change in United States men and women followed for up to 24 years: analysis from three prospective cohort studies. PLoS Med. 2015;12(9):e1001878. doi:10.1371/journal.pmed.1001878
43. Franklin KA, Lindberg E. Obstructive sleep apnea is a common disorder in the population-A review on the epidemiology of sleep apnea. J Thorac Dis. 2015;7(8):1311–1322. doi:10.3978/j.issn.2072-1439.2015.06.11
44. Basoglu OK, Tasbakan MS. Gender differences in clinical and polysomnographic features of obstructive sleep apnea: a clinical study of 2827 patients. Sleep Breath. 2018;22(1):241–249. doi:10.1007/s11325-017-1482-9
45. Shepertycky MR, Banno K, Kryger MH. Differences between men and women in the clinical presentation of patients diagnosed with obstructive sleep apnea syndrome. Sleep. 2005;28(3):309–314.
46. Bonsignore MR, Saaresranta T, Riha RL. Sex differences in obstructive sleep apnoea. Eur Respir Rev. 2019;28(154). doi:10.1183/16000617.0030-2019
47. Bixler EO, Vgontzas AN, Lin HM, et al. Prevalence of sleep-disordered breathing in women - Effects of gender. Am J Respir Crit Care Med. 2001;163(3):608–613. doi:10.1164/ajrccm.163.3.9911064
48. Fillion L, Henry CJ. Nutrient losses and gains during frying: a review. Int J Food Sci Nutr. 1998;49(2):157–168. doi:10.3109/09637489809089395
49. Leitzmann MF, Kurth T. Fried foods and the risk of coronary heart disease Frying itself may not be bad as long as the type of oil used for frying is good. Br Med J. 2012;344. doi:10.1136/bmj.d8274.
50. Tiwari R, Srivastava D, Gour N. a cross-sectional study to determine prevalence of obesity in high income group colonies of Gwalior city. Indian J Community Med. 2009;34(3):218–222. doi:10.4103/0970-0218.55287
51. Qi QB, Chu AY, Kang JH, et al. Fried food consumption, genetic risk, and body mass index: gene-diet interaction analysis in three US cohort studies. Br Med J. 2014;348. doi:10.1136/bmj.g1610
52. Sayon-Orea C, Bes-Rastrollo M, Basterra-Gortari FJ, et al. Consumption of fried foods and weight gain in a Mediterranean cohort: the SUN project. Nutr Metab Cardiovas. 2013;23(2):144–150. doi:10.1016/j.numecd.2011.03.014
53. Taveras EM, Berkey CS, Rifas-Shiman SL, et al. Association of consumption of fried food away from home with body mass index and diet quality in older children and adolescents. Pediatrics. 2005;116(4):E518–E24. doi:10.1542/peds.2004-2732
54. Krachler B, Eliasson M, Stenlund H, et al. Reported food intake and distribution of body fat: a repeated cross-sectional study. Nutr J. 2006;5(1):34. doi:10.1186/1475-2891-5-34
55. Stuebe AM, Oken E, Gillman MW. Associations of diet and physical activity during pregnancy with risk for excessive gestational weight gain. Am J Obstet Gynecol. 2009;201(1):58e1–8. doi:10.1016/j.ajog.2009.02.025
56. Pokorn J, Panek J, Trojakova L. Effect of food component changes during frying on the nutrition value of fried food. Forum Nutr. 2003;56:348–350.
57. de Souza RJ, Mente A, Maroleanu A, et al. Intake of saturated and trans unsaturated fatty acids and risk of all cause mortality, cardiovascular disease, and type 2 diabetes: systematic review and meta-analysis of observational studies. Br Med J. 2015;351. doi:10.1136/bmj.h3978
58. Guallar-Castillon P, Rodriguez-Artalejo F, Lopez-Garcia E, et al. Consumption of fried foods and risk of coronary heart disease: Spanish cohort of the European prospective investigation into cancer and nutrition study. Br Med J. 2012;344(1):e363–e363. doi:10.1136/bmj.e363
59. Asghari G, Yuzbashian E, Mirmiran P, et al. Fast food intake increases the incidence of metabolic syndrome in children and adolescents: Tehran lipid and glucose study. PLoS One. 2015;10(10):e0139641. doi:10.1371/journal.pone.0139641
60. Agnoli C, Pounis G, Krogh V. Dietary Pattern Analysis. In: Pounis G, editor. Analysis in Nutrition Research. Academic Press; 2019:75–101.
61. Cao X, Zhou S, Yang B, et al. Relationship between dietary patterns and sleep disorders among health screening population in Changsha. Zhong Nan Da Xue Xue Bao Yi Xue Ban. 2020;45(10):1204–1214. doi:10.11817/j.issn.1672-7347.2020.190318
62. Zahedi H, Kelishadi R, Heshmat R, et al. Association between junk food consumption and mental health in a national sample of Iranian children and adolescents: the CASPIAN-IV study. Nutrition. 2014;30(11–12):1391–1397. doi:10.1016/j.nut.2014.04.014
63. Moosavian SP, Haghighatdoost F, Surkan PJ, et al. Salt and obesity: a systematic review and meta-analysis of observational studies. Int J Food Sci Nutr. 2017;68(3):265–277. doi:10.1080/09637486.2016.1239700
64. Ma Y, He FJ, MacGregor GA. High salt intake: independent risk factor for obesity? Hypertension. 2015;66(4):843–849. doi:10.1161/HYPERTENSIONAHA.115.05948
65. Hu FB. Resolved: there is sufficient scientific evidence that decreasing sugar-sweetened beverage consumption will reduce the prevalence of obesity and obesity-related diseases. Obes Rev. 2013;14(8):606–619. doi:10.1111/obr.12040
66. Malik VS, Popkin BM, Bray GA, et al. Sugar-sweetened beverages, obesity, type 2 diabetes mellitus, and cardiovascular disease risk. Circulation. 2010;121(11):1356–1364. doi:10.1161/circulationaha.109.876185
67. Vartanian LR, Schwartz MB, Brownell KD. Effects of soft drink consumption on nutrition and health: a systematic review and meta-analysis. Am J Public Health. 2007;97(4):667–675. doi:10.2105/ajph.2005.083782
68. Schwartz AR, Patil SP, Laffan AM, et al. Obesity and obstructive sleep apnea: pathogenic mechanisms and therapeutic approaches. Proc Am Thorac Soc. 2008;5(2):185–192. doi:10.1513/pats.200708-137MG
 © 2021 The Author(s). This work is published and licensed by Dove Medical Press Limited. The full terms of this license are available at https://www.dovepress.com/terms.php and incorporate the Creative Commons Attribution - Non Commercial (unported, v3.0) License.
By accessing the work you hereby accept the Terms. Non-commercial uses of the work are permitted without any further permission from Dove Medical Press Limited, provided the work is properly attributed. For permission for commercial use of this work, please see paragraphs 4.2 and 5 of our Terms.
© 2021 The Author(s). This work is published and licensed by Dove Medical Press Limited. The full terms of this license are available at https://www.dovepress.com/terms.php and incorporate the Creative Commons Attribution - Non Commercial (unported, v3.0) License.
By accessing the work you hereby accept the Terms. Non-commercial uses of the work are permitted without any further permission from Dove Medical Press Limited, provided the work is properly attributed. For permission for commercial use of this work, please see paragraphs 4.2 and 5 of our Terms.