")
Back to Journals » Diabetes, Metabolic Syndrome and Obesity » Volume 14
Association Between Aspartate Aminotransferase to Alanine Aminotransferase Ratio and Incidence of Type 2 Diabetes Mellitus in the Japanese Population: A Secondary Analysis of a Retrospective Cohort Study
Authors Chen L, Zhang K , Li X, Wu Y, Liu Q, Xu L, Li L, Hu H
Received 2 September 2021
Accepted for publication 20 October 2021
Published 9 November 2021 Volume 2021:14 Pages 4483—4495
DOI https://doi.org/10.2147/DMSO.S337416
Checked for plagiarism Yes
Review by Single anonymous peer review
Peer reviewer comments 2
Editor who approved publication: Professor Ming-Hui Zou
Lidan Chen,1,* Kebao Zhang,2,* Xue Li,2 Yang Wu,3 Qingwen Liu,4 Liting Xu,1 Liuyan Li,4 Haofei Hu5
1Shenzhen Nanshan Medical Group Headquarter, Shenzhen, Guangdong Province, 518000, People’s Republic of China; 2Department of Emergency, The Eighth Affiliated Hospital, Sun Yat-sen University, Shenzhen, 518000, Guangdong Province, People’s Republic of China; 3Department of Endocrinology, Shenzhen Second People’s Hospital, Shenzhen, 518000, Guangdong Province, People’s Republic of China; 4Shenzhen Second People’s Hospital, Shenzhen, 518000, Guangdong Province, People’s Republic of China; 5Department of Nephrology, Shenzhen Second People’s Hospital, Shenzhen, 518000, Guangdong Province, People’s Republic of China
*These authors contributed equally to this work
Correspondence: Haofei Hu
Department of Nephrology, Shenzhen Second People’s Hospital, No. 3002 Sungang Road, Futian District, Shenzhen, 518000, Guangdong Province, People’s Republic of China
Tel +86-755-83366388
Email [email protected]
Background: The study on the association between aspartate aminotransferase to alanine aminotransferase (AST/ALT) ratio and the risk of type 2 diabetes mellitus (T2DM) was limited. Therefore, we conducted a secondary analysis based on online data to explore whether there was an association between the AST/ALT ratio and incident T2DM among a large number of Japanese people.
Methods: The study was a retrospective cohort study. We downloaded the NAGALA (NAfld in Gifu area) data from DATADRYAD website between 2004 and 2015. This present study included 15,291 participants. Cox proportional-hazards regression, generalized additive models and subgroup analyses were used to find out the association between the AST/ALT ratio and T2DM events.
Results: The negative relationship was shown between AST/ALT ratio and incident T2DM (HR = 0.617, 95% CI: 0.405– 0.938) in our study. A non-linear relationship and saturation effect were found between them, and the inflection point was 0.882. It indicated that the AST/ALT ratio was negatively correlated with incident T2DM when the AST/ALT ratio was less than the inflection point (HR = 0.287, 95% CI: 0.126– 0.655, p = 0.0030). We found that exercise modified their relationship (P for interaction = 0.0024), and people who did not exercise associated strongly (HR = 0.464 95% CI: 0.290– 0.741).
Conclusion: AST/ALT ratio was negatively associated with T2DM risk, and their relationship was non-linear and had a saturation effect. When the AST/ALT ratio was less than 0.882, they showed a significant negative correlation.
Keywords: alanine aminotransferase, aspartate aminotransferase, type 2 diabetes mellitus, nonlinearity
Background
With changes in lifestyle and the increasing incidence of obesity, the global incidence and prevalence of T2DM have increased in the past few decades.1 More younger patients develop T2DM than before, which carries an enormous healthcare burden.2 A valuable and cost-effective way to evaluate T2DM or prediabetes is necessary. Prolonged insulin resistance (IR) is the hallmark for developing T2DM. For instance, the gold standard for detecting IR is the hyperglycemic-euglycemic glucose clamp technique, which requires expense and time. One of the alternative ways to assess IR is the Homeostatic Model Assessment of insulin resistance (HOMA-IR), which is calculated from fasting plasma glucose (FPG) and immunoreactive insulin (IRI).3 However, measurement of insulin is not a routine test, and screening for patients of prediabetes state is arduous. So, it is necessary to develop another feasible way to screen younger adults for prediabetes and initiate early prevention programs for high-risk populations.
The liver is one of the most critical targets for insulin action.4 It is reported that patients who have non-alcoholic fatty liver disease (NAFLD) are associated with a twofold increase risk for developing T2DM than the normal population.5 There are over 50% of patients with T2DM develop NAFLD.6 The interrelationship between NAFLD and T2DM is a hot topic.
Several mechanisms have been proposed to explain the association between NAFLD and T2DM. Non-esterified fatty acid (NEFA) travel to the liver induces IR.7 Besides, NEFA can induce JNK1 signaling to promote hepatic inflammation as well as IR.7,8
A number of studies have demonstrated that the levels of liver enzymes such as aspartate transaminase (AST), alanine aminotransferase (ALT), and gamma-glutamyltransferase (GGT) level could predict the occurrence of T2DM.9–12 AST/ALT ratio was regarded as one of the best surrogate indicators for NAFLD.9,13 Zou et al14 have reported that ALT/AST ratio was considered an independent predictive factor for new NAFLD events in non-obese Chinese (HR: 2.10, 95% CI: 1.88–2.36). In a study conducted by Simental-Media et al15 showed when AST/ALT ratio was <1, it was associated with IR. Nevertheless, there was limited evidence to show a quantitative relationship between the AST/ALT ratio and the incidence of T2DM. The present study analyzed data obtained online to elucidate the exact association between the AST/ALT ratio and the incidence of T2DM.
Method
Data Source
Our data came from the NAGALA (NAfld in the Gifu Area, Longitudinal Analysis) database of Dryad Digital Repository (https://datadryad.org/), which users were allowed to download the raw data for free. In the present study, we cited the Dryad data package,16 (which was from: “Ectopic fat obesity presents the greatest risk for incident T2DM: a population-based longitudinal study,” Dryad, Dataset, https://doi.org/10.5061/dryad.8q0p192), according to Dryad Terms of Service. The variables contained in the database file are as follows: gender, age, waist circumference (WC), body mass index (BMI), smoking status, ethanol consumption, total cholesterol (TC), hemoglobin A1C (HbA1C), triglyceride (TG), fasting plasma glucose (FPG), gamma-glutamyltransferase (GGT), alanine aminotransferase (ALT), high-density lipoprotein cholesterol (HDL-C), diastolic blood pressure (DBP), aspartate aminotransferase (AST), fatty liver, systolic blood pressure (SBP), exercise, year of follow-up and T2DM events during the follow-up. Without violating the author’s rights, these data could be used for secondary analysis because the author of the raw study has given up all copyrights and related ownership of these data.
Study Design and Participants
The database from a medical population-based cohort study at Murakami Memorial Hospital (Gifu, Japan), whose purpose was to improve public health by examining chronic diseases and judging their dangerous causes. Murakami Memorial Hospital in Japan collected the data from 2004 to 2015. More details were described in the previous article.16 In short, they recruited 20,944 participants who finished a second exam in the medical examination program from 2004 to 2015. Participants included men who drank more than 60 g/day and women who drank more than 40 g/day (n = 739), as well as alcoholic fatty liver, viral hepatitis (defined by hepatitis C antibody and hepatitis B antigen at the measurement) (n = 416), besides anyone who took medicine at baseline (n = 2321) and T2DM at baseline (n = 323), were excluded. Moreover, the participants whose data of covariates were missing and whose fasting plasma glucose ≥6.1 mmol/L (n = 808)17 were also excluded. Then, the raw study included 15,464 participants for the final analysis. AST/ALT ratio was calculated as AST divided by ALT. We excluded abnormal values of AST/ALT (out of range mean minus and plus three standard deviations (SD) n = 173).18 Finally, 15,291 participants (8383 for males and 6908 for females) were included in our study. According to the original study, the Ethics Committee of Murakami Memorial Hospital approved the research ethics and obtained informed consent from all subjects.16
Data Collection and Measurements
The baseline data included physical examination measurements (such as waist circumference, weight, and blood pressure), blood tests, and a standardized self-administered questionnaire on the lifestyle characteristics and medical history (including smoking and alcohol habits, physical activity). They have used fasting blood specimens to analyze GGT, AST, ALT, TC, HDL, TG, hemoglobin A1c (HbA1c) and fasting blood glucose. As mentioned before,16 they assessed alcohol consumption by asking the participants about the amount and type of alcohol consumption each week in the last month and then estimating the average weekly alcohol intake. Smoking status was divided into three categories: current, ever, and never. Body mass index (BMI) was calculated as body weights (kg) divided by the square of the participants’ heights (m). Well-trained technicians performed an ultrasound examination of the abdomen. According to the images, fatty liver was diagnosed by gastroenterologists without referring to other participants’ personal data. In the end, according to the American Diabetes Association criteria of T2DM,19,20 the incidence of T2DM was defined as HbA1c ≥6.5%, fasting plasma glucose ≥7 mmol/L, or self-reported. The target-independent variable was the AST/ALT ratio obtained at baseline. The study endpoint was defined as the occurrence of T2DM during the follow-up. Since this is a retrospective cohort study, selection and observation bias were eliminated.
Statistical Analysis
For baseline characteristics analysis according to the AST/ALT ratio quartiles. Normally distributed continuous variables were represented by the mean, standard deviation (SD), and non-normally distributed continuous variables were replaced by the median of the interquartile range (IQR). Categorical variables were expressed as frequencies and percentages. Used Kruskal Wallis H (skew distribution) test, one-way ANOVA (normal distribution), and chi-square test (categorical variable) to determine any significant differences between AST/ALT ratio group means and proportions. Hazard ratios (HRs) and 95% confidence intervals (CIs) were calculated for the incidence of T2DM with AST/ALT ratio using Cox proportional hazards regression models. The results of unadjusted, minimum adjusted, and fully adjusted analysis were showed simultaneously. When the covariance was added to the model, the matching hazard ratio changes by at least 10%, the covariance should be adjusted.21 We conducted a sensitivity analysis to increase the robustness of data analysis. We converted the AST/ALT ratio into categorical variables and then calculated the trend of P. A generalized additive model (GAM) was used to identify non-linear relationships because the AST/ALT ratio was a continuous variable. And if their relationship was non-linear, the effect of the AST/ALT ratio threshold on the diabetes event was calculated by a two-segment linear regression model based on a smoothed graph. When the relationship between the incidence of T2DM and the AST/ALT ratio was obvious on the smooth curve, the software would automatically use a recursive method to calculate the inflection point after adjusting the potential confounding factors. In addition, we also applied the Cox proportional hazard model to conduct a subgroup analysis (sex, WC, age, exercise, BMI, ethanol consumption, fatty liver, smoking status, DBP, SBP, GGT, and FPG). For continuous variables, we first convert them into categorical variables based on clinical cut points or binary. Except for the stratification factor itself, each stratification was adjusted for all factors. The likelihood ratio test checked the modification and interaction of subgroups. Using the time to the first event for each endpoint, the Kaplan–Meier method was used to compare survival estimates and cumulative event rates. All results were reported according to the STROBE statement.21
All the analyses in our study were performed with the statistical software package R (http://www.R-project.org, The R Foundation) and Empower-Stats (http://www.empowerstats.com, X&Y Solutions, Inc., Boston, MA). P values less than 0.05 (two-sided) were considered statistically significant.
Results
A total of 15,291 participants were included in our study (54.82% men and 45.18%women) (Figure 1). The average age of the population was 43.7 ± 8.9 years. The average follow-up year was 6.06 years, and 371 participants (2.43%) had T2DM during the follow-up period. The average AST/ALT ratio was 1.04 ± 0.34, and the average FPG was 5.16 ± 0.41 mmol/l.
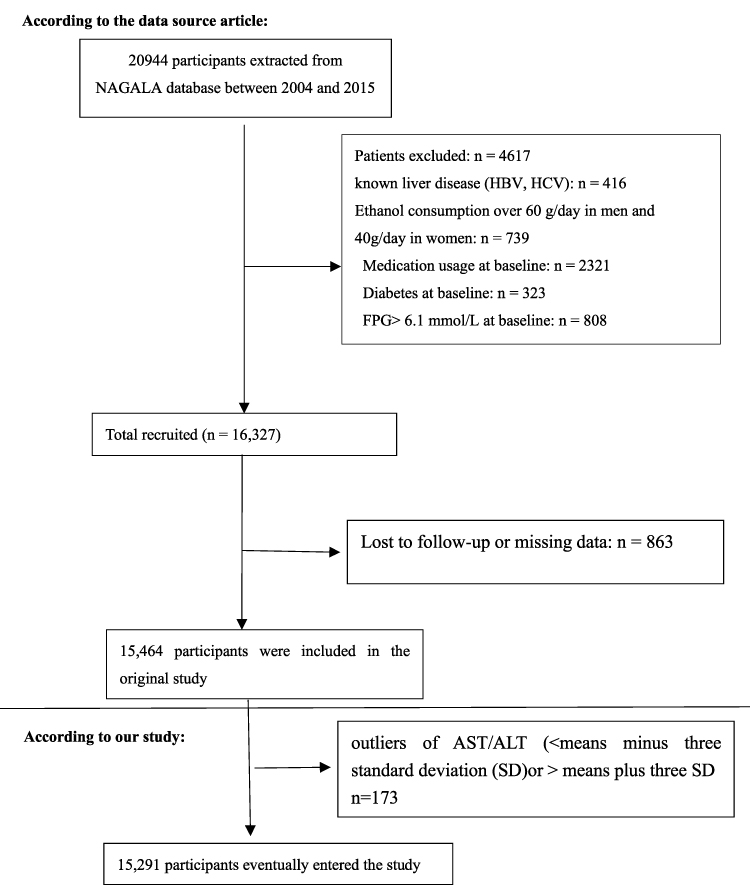 |
Figure 1 Flowchart of study participants. |
Baseline Characteristics of the Study Participants
Table 1 describes the total participants’ baseline characteristics based on the quartiles of the AST/ALT ratio (≤0.78, 0.78–0.98, 0.98–1.24, >1.24). We found that in the lowest AST/ALT ratio group, participants usually were the youngest people, with the lowest concentration of HDL and had higher ethanol consumption, BMI, WC, ALT, GGT, TC, TG, FPG, HbA1c, blood pressure levels (including both diastolic blood pressures and systolic blood pressures) and a higher ratio of the current smoker. And compared with other groups, more people had fatty liver in this lowest AST/ALT ratio group. We also found that men took a large percentage in this group. Besides, most participants of this group had no habit of exercise. However, we found that the concentration of AST was nearly the same between the four groups.
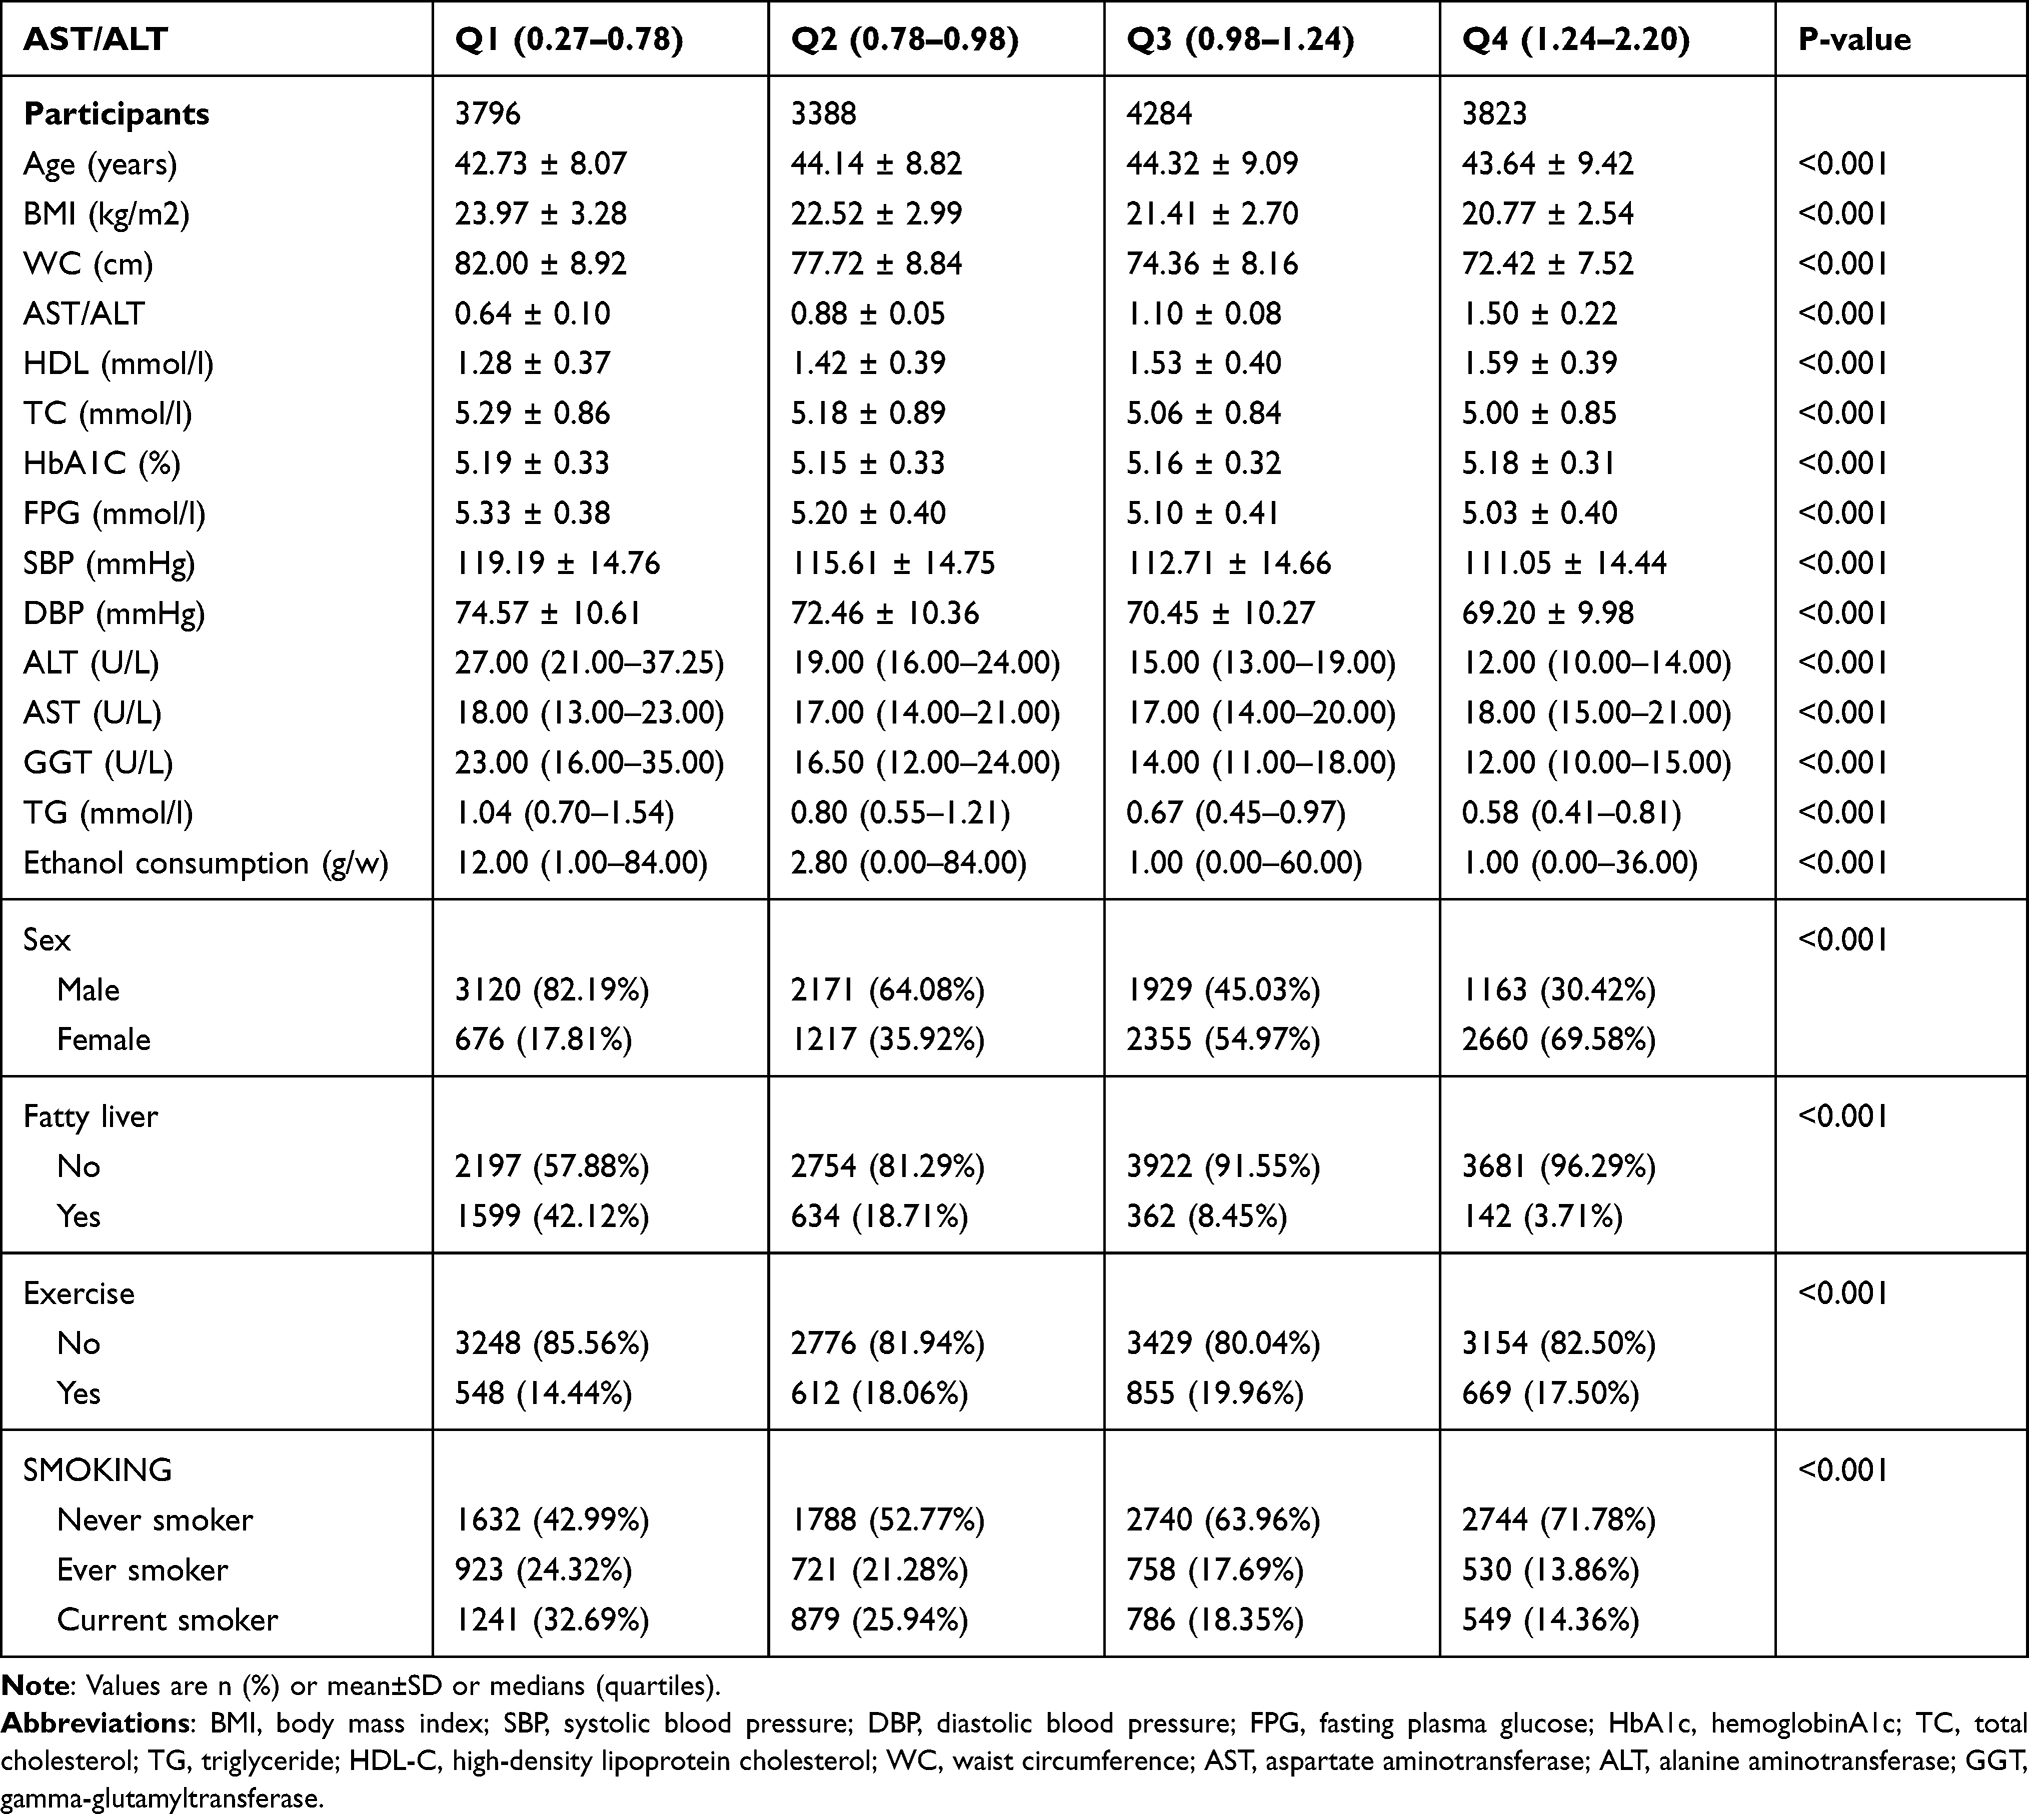 |
Table 1 The Baseline Characteristics of Participants |
Univariate Analysis
Table 2 shows the results of the univariate analysis. It demonstrated that BMI, age, WC, fatty liver, smoking status, ethanol consumption, DBP, SBP, GGT, AST, ALT, FPG, TG, TC, and HbA1C were positively correlated with incident T2DM. However, AST/ALT ratio and HDL were negatively associated with T2DM. We also found that men have a higher risk of developing T2DM than women.
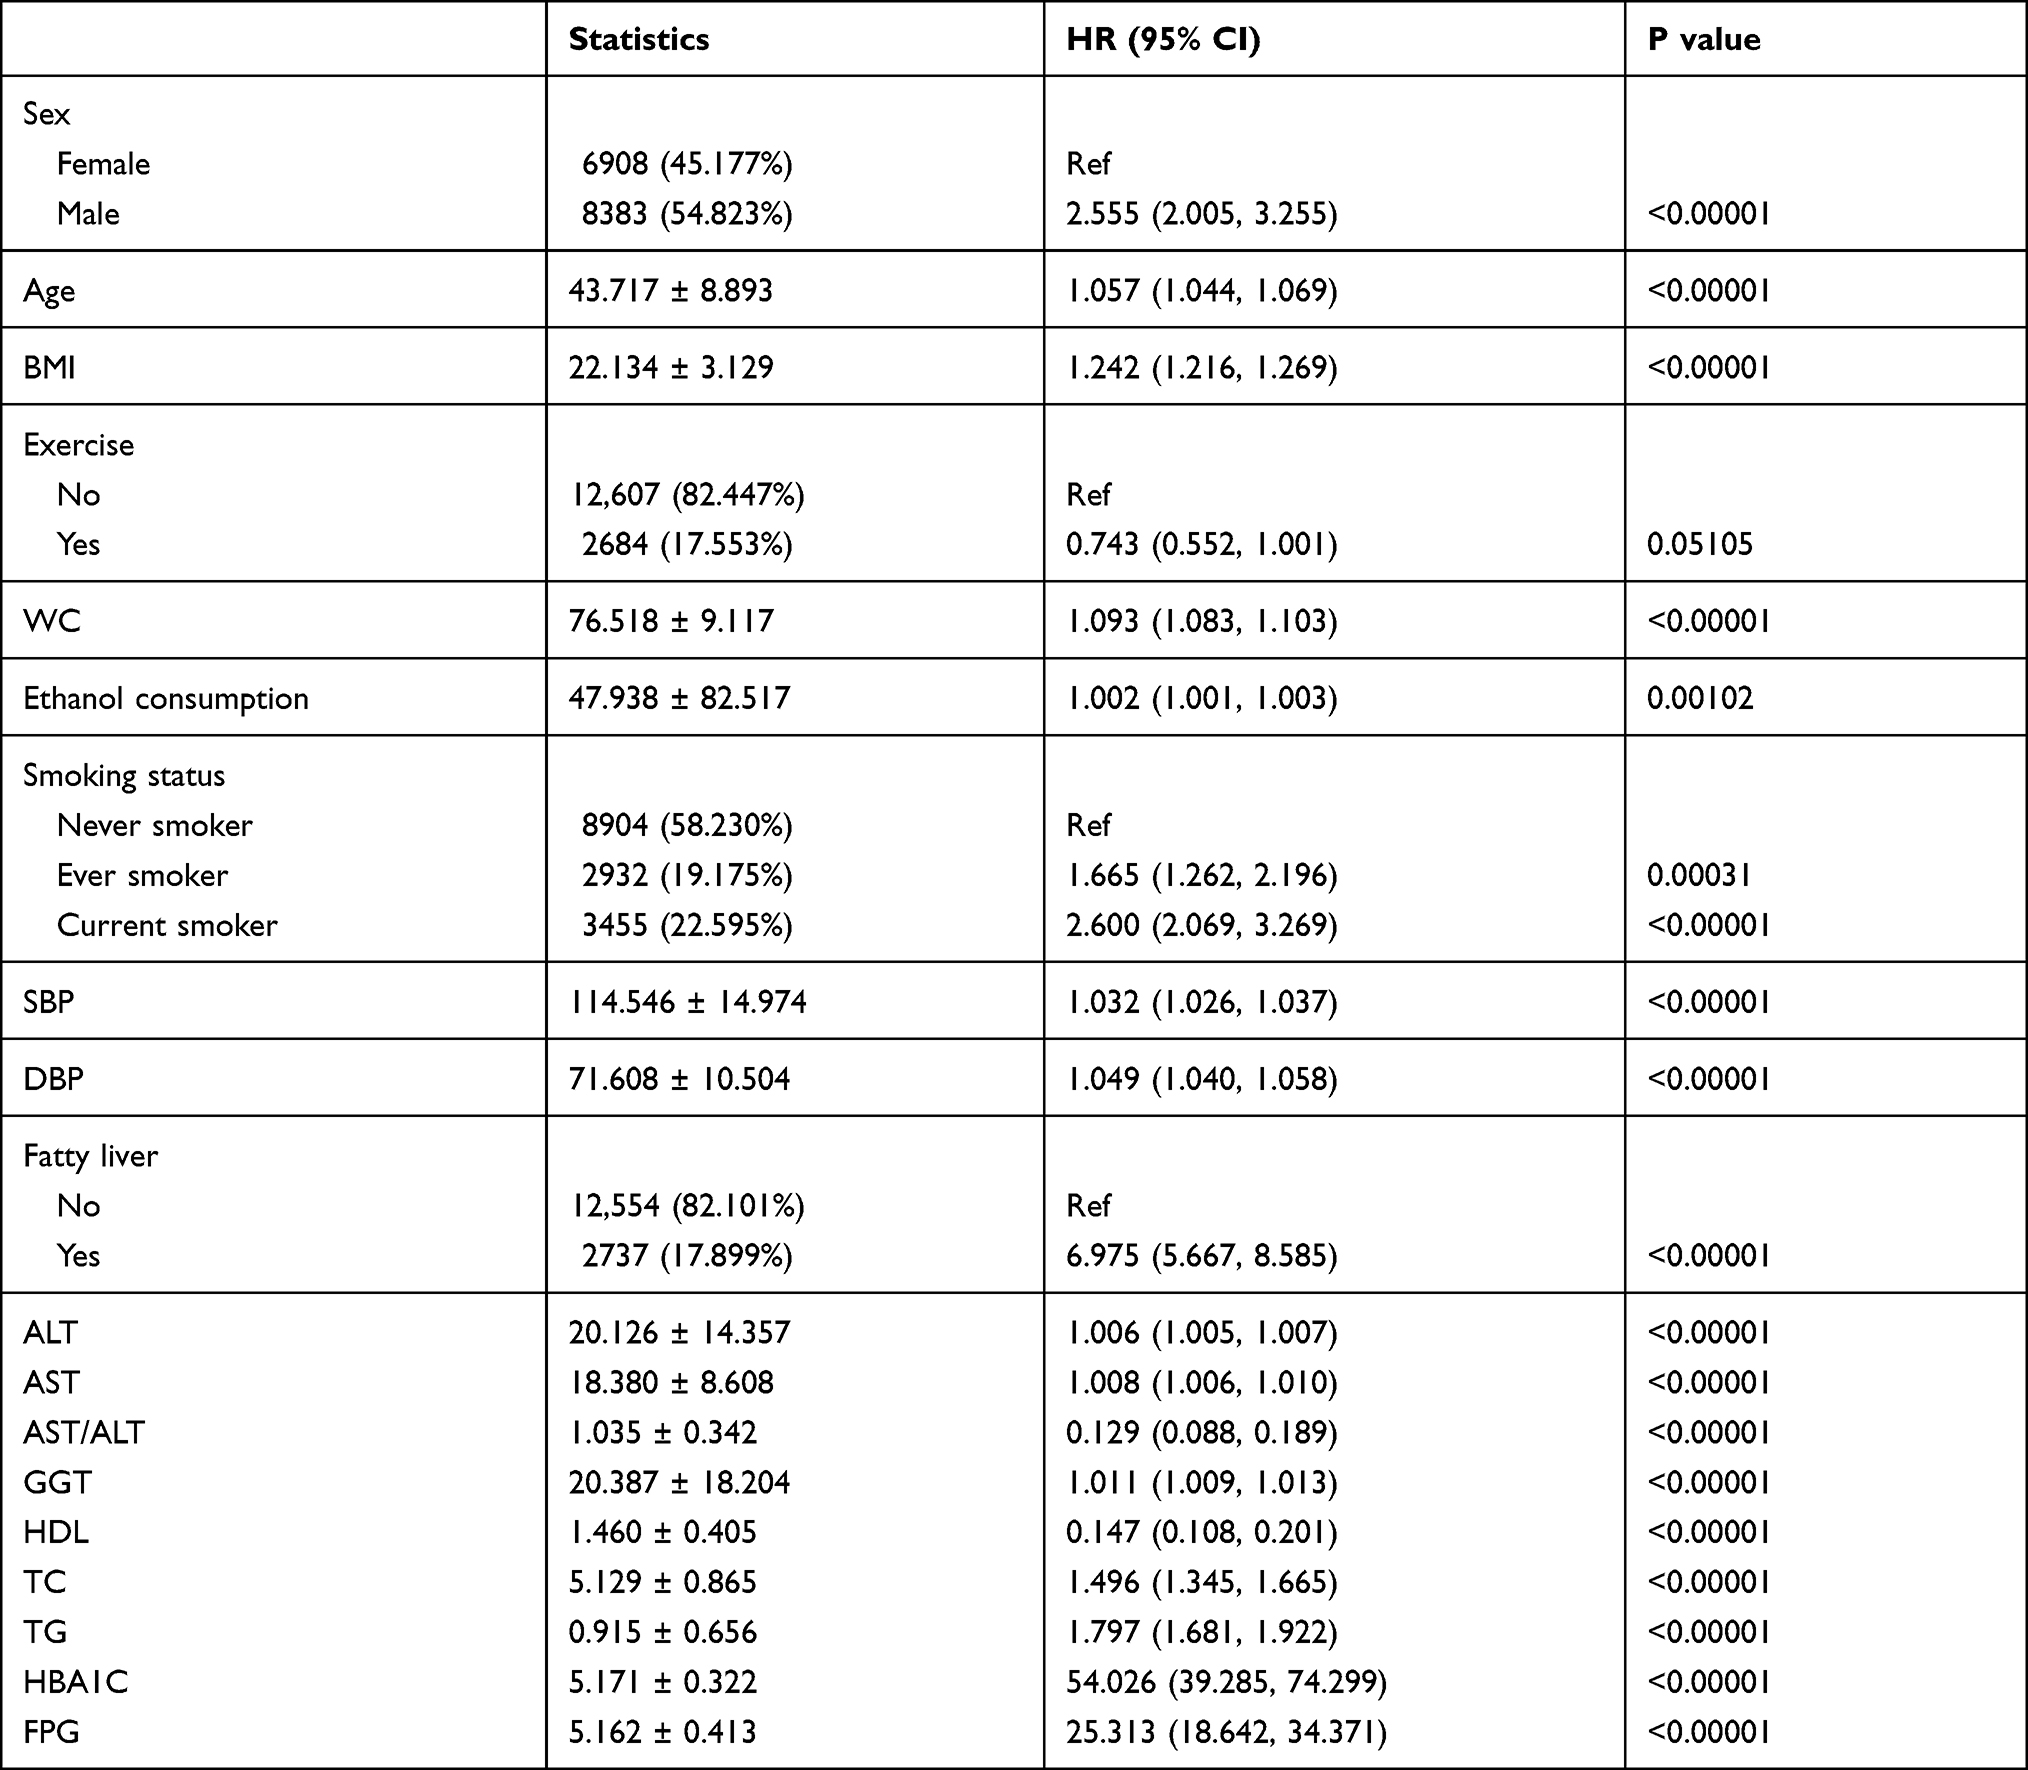 |
Table 2 Univariate Analysis Between Variables and Incidence of T2DM |
Figure 2 We used the Kaplan–Meier curve to show the effect of the AST/ALT ratio on the cumulative harm of T2DM event risk. The risk of T2DM events was significantly different between the four AST/ALT groups (Log rank test, p < 0.0001). The cumulative risk of T2DM events gradually decreased as AST/ALT increased.
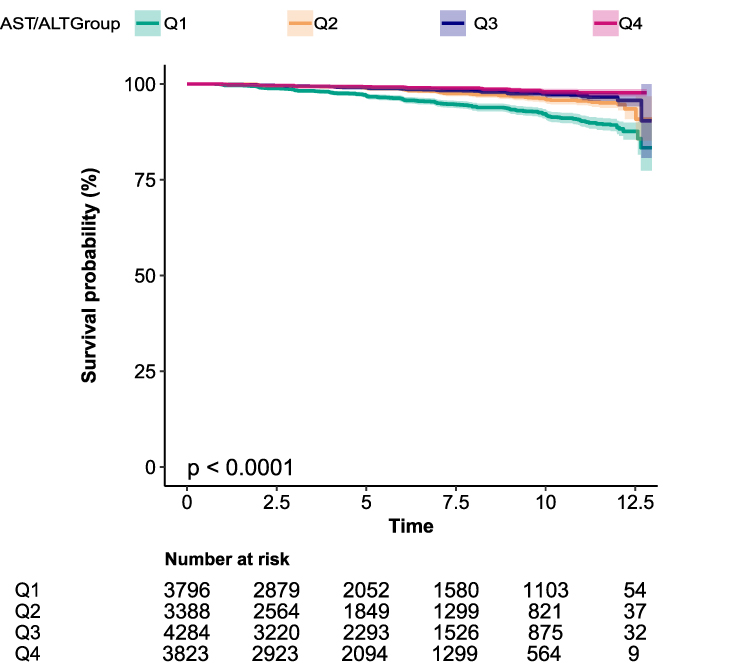 |
Figure 2 Kaplan–Meier event-free survival curve based on AST/ALT ratio quartiles and the incidence of T2DM. Notes: Kaplan–Meier event-free survival curve. Kaplan–Meier analysis of diabetes incident based on AST/ALT quartiles (log-rank, P < 0.0001). |
Multivariate Analysis Between AST/ALT Ratio and the Incidence of T2DM
As AST/ALT ratio met the proportional hazards assumption, the association between the AST/ALT ratio and the incidence of T2DM was evaluated by the Cox proportional hazards regression model (Figure S1). We found that the determination coefficient of AST/ALT ratio was 0.9%. At the same time, the non-adjusted and adjusted models are shown in Table 3. Crude model demonstrated that AST/ALT ratio was negatively correlated with incident T2DM (HR = 0.179, 95% confidence interval (CI): 0.118, 0.272, P < 0.00001). In the minimally adjusted model (adjusted age, WC, BMI, ethanol consumption, smoking status, DBP, SBP, exercise), the trend was nearly the same (HR=0.349,95% CI: 0.226–0.540, P < 0.00001). And in the full adjusted model (adjusted WC, age, DBP, BMI, SBP, exercise, smoking status, ethanol consumption, FPG, TC, TG, HDL), the AST/ALT ratio could be used to predict the incidence of T2DM independently (HR = 0.617, 95% CI: 0.405 to 0.938, P = 0.0239). We also treated the AST/ALT ratio as a categorical variable (quartile) for sensitivity analysis. In the non-adjusted model, there was a decreasing risk for developing T2DM as the quartile of AST/ALT ratio increased (P for trend <0.00001). In the highest quartile of AST/ALT ratio, participants had a 70.0% decreased risk in the development of T2DM than the lowest quartile [HR0.300 (95% CI (0.206, 0.437))]. After adjustment for age, WC, BMI, DBP, SBP, exercise, smoking status, ethanol consumption, FPG, TC, TG and HDL, the hazard ratios were 0.720 (0.545, 0.953), 0.810 (0.596, 1.102) and 0.730 (0.496, 1.074) for AST/ALT quartile 2–4, respectively (P for trend = 0.006). Then we stratified the adjusted model by gender, for every unit increased in AST/ALT ratio, the incidence of diabetes decreased by 36.6% in male (HR = 0.634; 95% CI: 0.381–1.055) and 40.3% in female (HR = 0.597; 95% CI: 0.280–1.277).
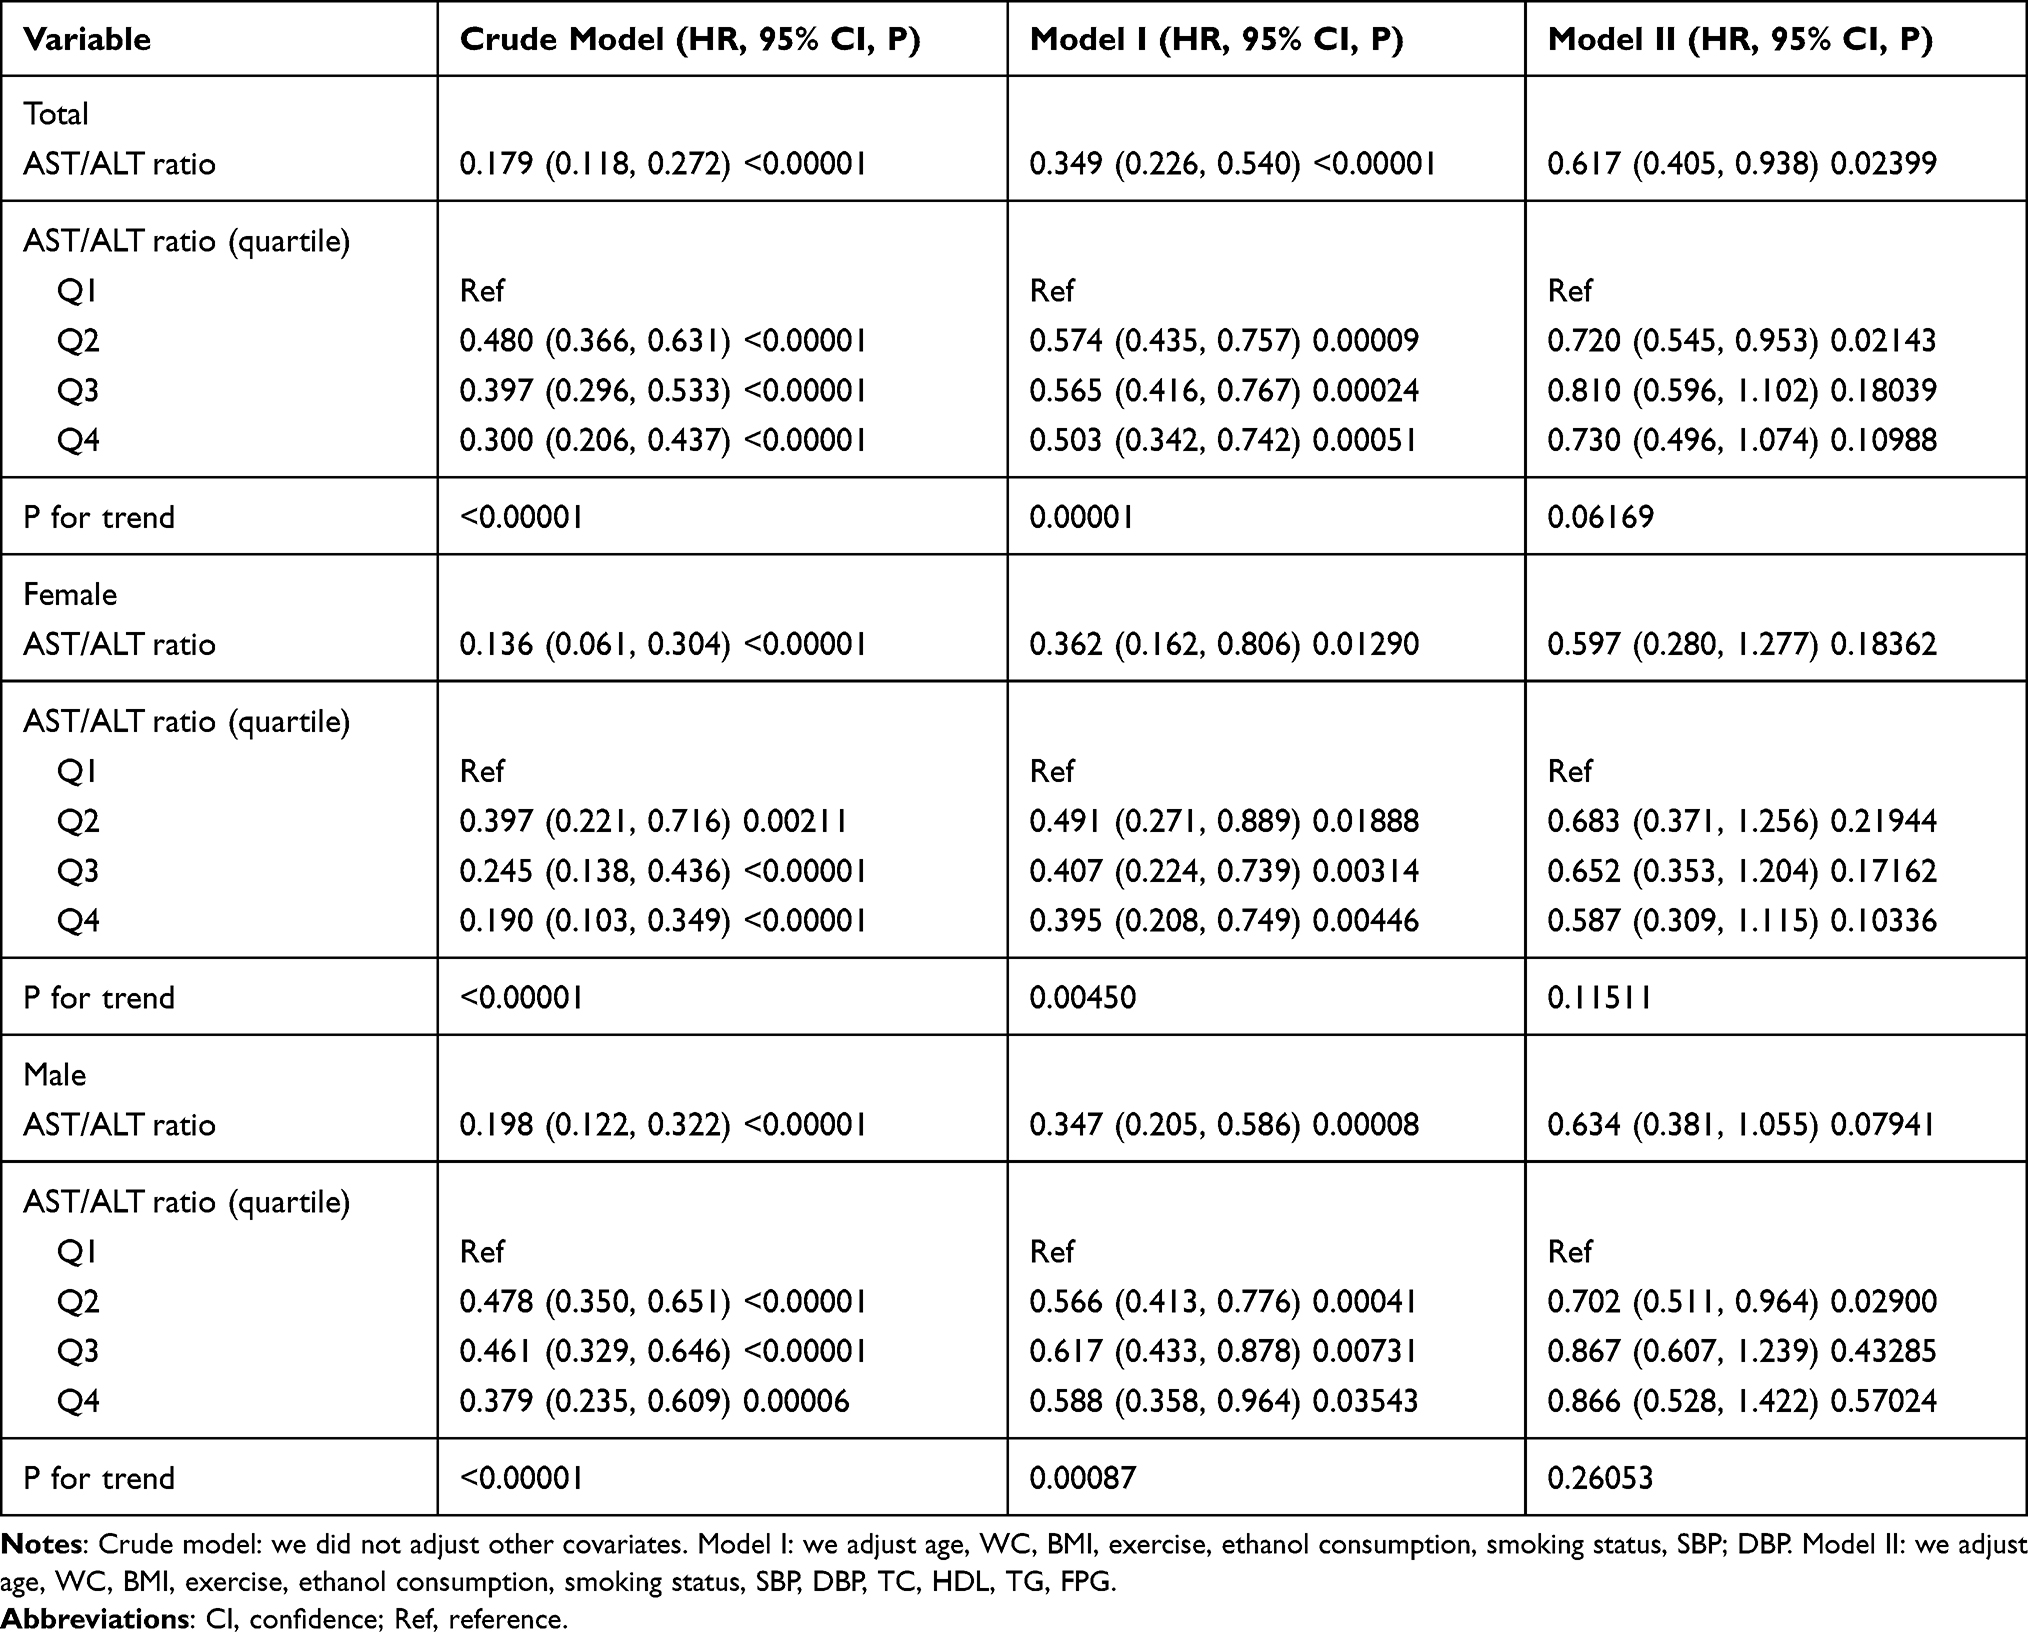 |
Table 3 Association Between AST/ALT Ratio and the Incidence of T2DM in Different Models |
The Analyses of the Non-Linear Relationship
In the present study, we analyzed the non-linear relationship between the AST/ALT ratio and the incidence of T2DM because AST/ALT ratio was a continuous variable (Figure 3). We discovered that the association between AST/ALT ratio and the incidence of T2DM was also non-linear (after adjusting WC, age, exercise, DBP, SBP, BMI, smoking status, ethanol consumption, FPG, TC, TG, HDL) (Figure 3). And we used the two piecewise linear regression model to calculate the inflection point of the AST/ALT ratio to predict the incidence of T2DM is 0.882 (data are shown in Table 4, Log-likelihood ratio test P = 0.037). On the left of the inflection point, a negative relationship was established on the AST/ALT ratio and the incidence of T2DM (HR = 0.287, 95% CI: 0.126–0.655, P = 0.003). However, the relationship was getting saturated on the right side of the inflection point (HR = 1.036, 95% CI: 0.561–1.913, P = 0.9105). After stratified by gender, the curve-fitting relationship of male was similar to the general population (inflection point = 0.9, log-likelihood ratio test P = 0.011). On the left side of the inflection point, the relationship between the AST/ALT ratio was negatively associated with the incidence of T2DM (HR = 0.251; 95% CI: 0.105–0.598; P = 0.0018). On the right side of the inflection point, the relationship between AST/ALT ratio and incidence of T2DM was saturated (HR = 1.571; 95% CI: 0.708–3.488; P = 0.2666). We also found an inflection point in female (inflection point = 1.368), but the relationship between the AST/ALT ratio and the incidence of T2DM in female did not conform to the curve relationship (log-likelihood ratio test P = 0.410).
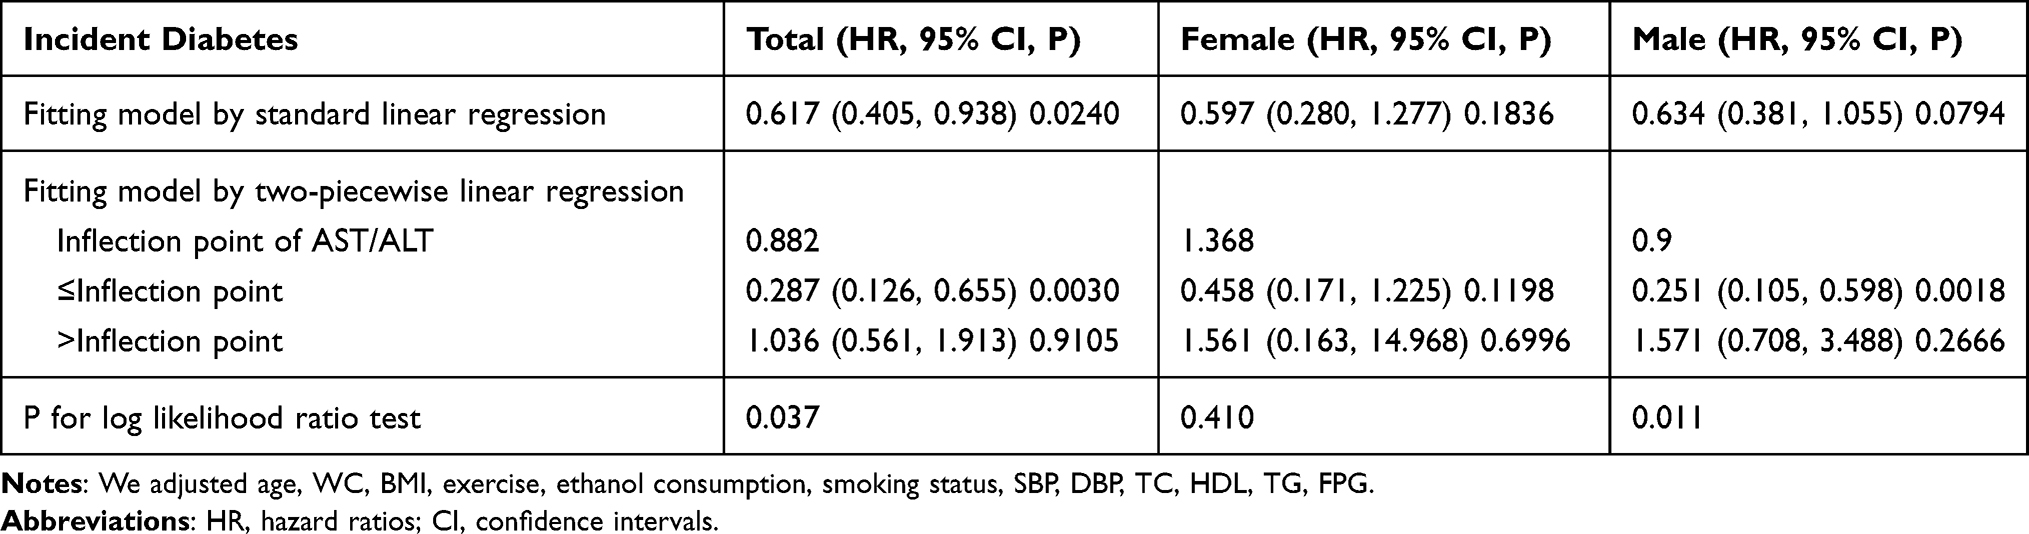 |
Table 4 The Result of the Two-Piecewise Linear Regression Model |
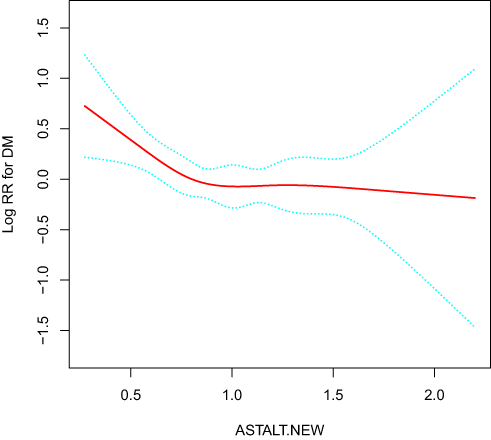 |
Figure 3 The non-linear relationship between AST/ALT and the incidence of diabetes. Notes: The non-linear relationship between AST/ALT and the incidence of diabetes. A non-linear relationship between them was detected after adjusting for sex, age, WC, BMI, exercise, ethanol consumption, smoking status, SBP, DBP, TC, HDL, TG, FPG. |
The Results of Subgroup Analyses
Furthermore, in order to see if the relationship between AST/ALT ratio and T2DM events was stable in different subgroups, we did a hierarchical analysis and interactive analyses. We took age, sex, BMI, WC group, exercise, smoking status, ethanol consumption, fatty liver, SBP, DBP, GGT, and FPG as the stratified variables to determine the trend of effect sizes in these variables (Table 5). The result showed that exercise played an interactive role in the association between the AST/ALT ratio and the incidence of T2DM (P for interaction = 0.0024). In contrast, the other stratified variables did not affect the association between the AST/ALT ratio and the incidence of T2DM. A stronger association between AST/ALT ratio and incident diabetes was detected in the population with no exercise habits (HR = 0.464, 95% CI: 0.290–0.741). In comparison, the weaker association was seen in the people with exercise habits (HR=2.361,95% CI: 0.962, 5.792).
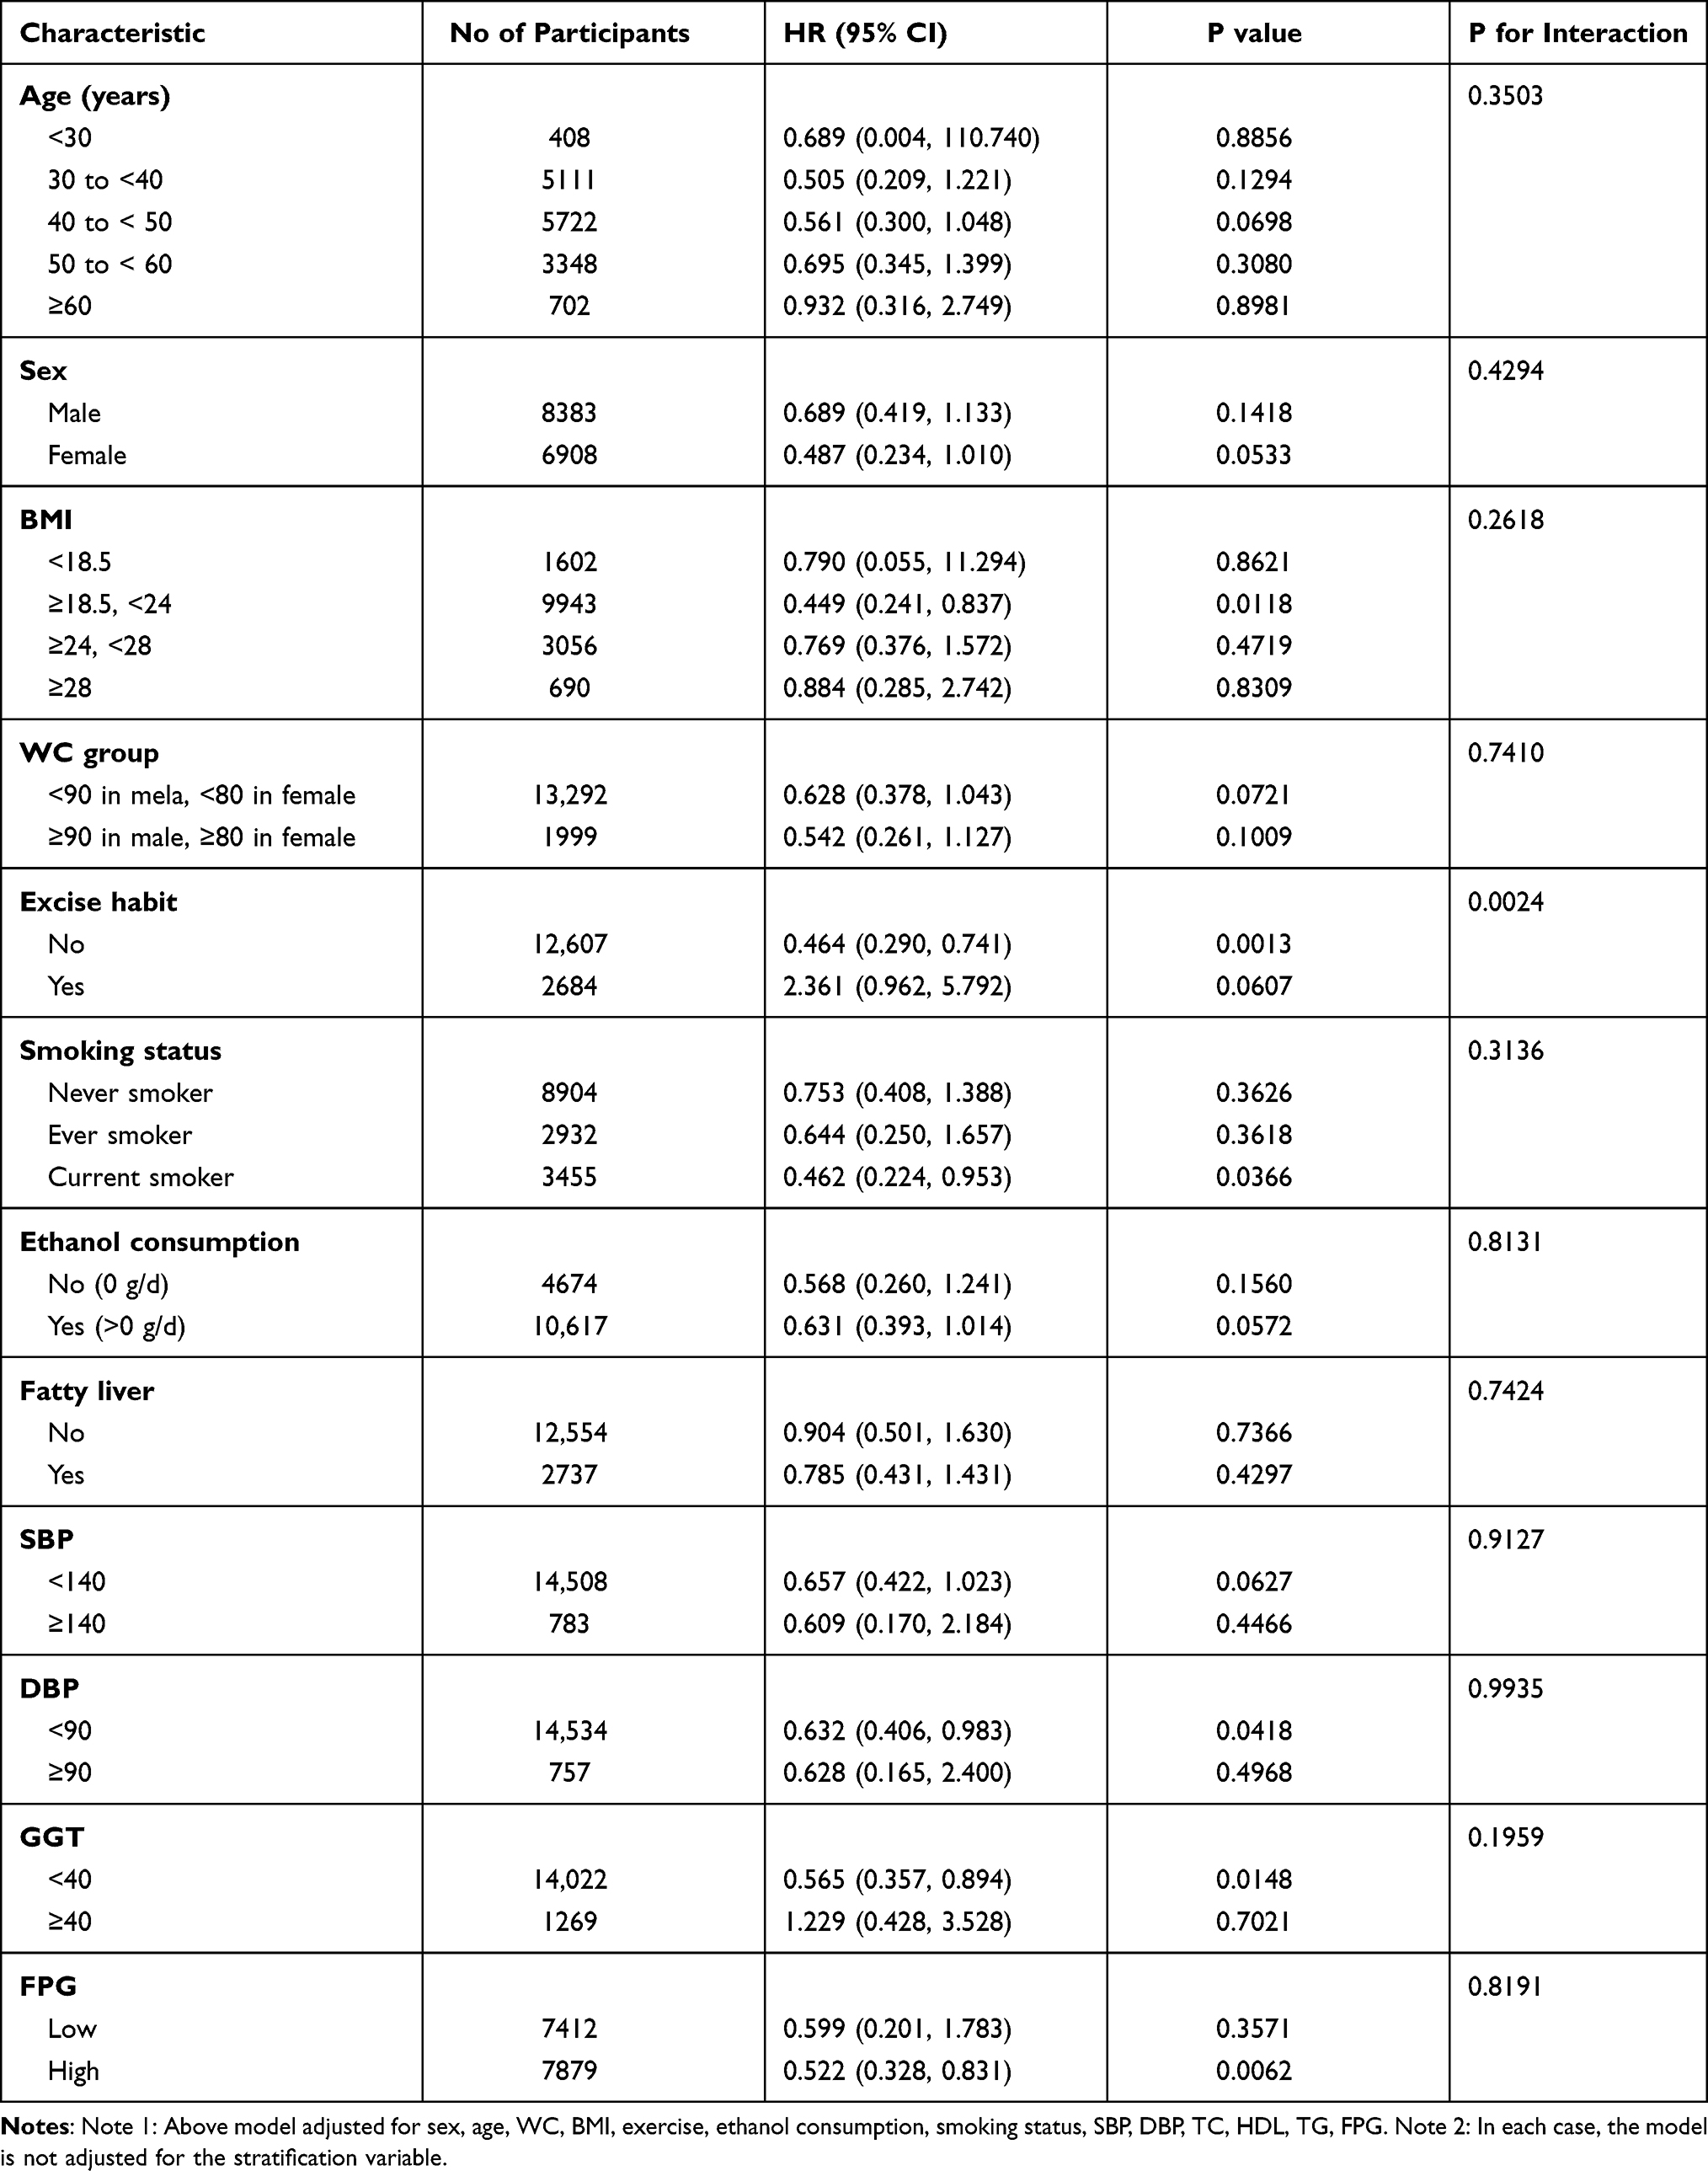 |
Table 5 Effect Size of AST/ALT on Diabetes in Prespecified and Exploratory Subgroups |
Discussion
Our findings discovered that there was a negative association between AST/ALT ratio and incident diabetes mellitus after adjusting other covariates. Besides, a non-linear relationship between the AST/ALT ratio and incident T2DM was discovered in our study. We also found that the effect on the left and right sides of the inflection point was different [left (HR: 0.287, 95% CI: 0.126–0.655, p = 0.003); right (HR: 1.036, 95% CI: 0.561–1.913, P = 0.9105)]. A saturation effect between the AST/ALT ratio and the incidence of diabetes also was showed in our study. Furthermore, subgroup analysis showed a stronger association in the population who did not exercise (HR = 0.464, 95% CI: 0.290–0.741).
Several risk factors have been proven to be associated with the incidence of T2DM, typically insulin resistance (IR), metabolic syndrome and NAFLD.5,6,22–24 A prospective study conducted by Lillioja et al24 revealed that IR is the best predictor for T2DM prognosis. It was reported by Wu et al25 that every 1 unit increase in HOMA-IR per year increases the risk of T2DM by threefold. Metabolic syndrome was characterized by hyperglycemia, dyslipidemia, visceral obesity, and hypertension. It was believed that IR played an important role in the pathogenesis of metabolic syndrome.23 A nationwide cohort study conducted in Korea showed that metabolic syndrome was an independent risk factor for incident diabetes after multivariable adjustment (HR: 1.86).22 The relationship between NAFLD and T2DM was bidirectional. Patients with NAFLD had an increased risk for T2DM and vice versa.6 According to the PSM analysis, a retrospective cohort study based on 14,280 Japanese participants showed that among participants with NAFLD, the risk of developing diabetes increased by 98% (HR = 1.98, 95% CI: 1.41–2.80).26 In a global epidemiology meta-analysis, the prevalence of NAFLD in T2DM patients was estimated to be 55.48%.6 In a study conducted by Ballestri et al5 found that NAFLD was associated with an increased risk of incident metabolic syndrome (RR: 1.80, 95% CI: 1.72–1.89) and incident T2DM (RR: 1.97, 95% CI: 1.80–2.15). The mutual relationship between NAFLD, metabolic syndrome, and T2DM was through IR, forming a vicious circle.27 Molecular pathways that link NAFLD and IR together were the JNK1 and PKCε pathway.7,8,28
Liver enzymes were also associated with metabolic syndrome, IR, and NAFLD. Aspartate transaminase (AST), alanine transaminase (ALT), and their conversion value were widely studied in liver diseases and metabolic diseases. A cross-sectional study included 1444 elder participants aged 60 or older Chinese participants reported by Liu et al.29 ALT (OR: 1.78, 95% CI: 1.21–2.61) was positively correlated with the prevalence of metabolic syndrome but not AST. Zhang et al30 conducted a large-scale case-control study in China, which showed that both ALT (OR: 8.03, p < 0.001) and AST (OR: 3.06, p < 0.001) contributed to the risk of metabolic syndrome. The relationship between liver enzymes and IR was also well studied.9,11,14,31 A study includes 808 Korean adolescents conducted by Lee and Yang31 showed that ALT was positively associated with the prevalence of metabolic syndrome, while AST/ALT ratio was negatively related to the prevalence of metabolic syndrome and IR. It was believed that the AST/ALT ratio could help distinguish NAFLD from the alcoholic cause of liver disease, and the AST/ALT ratio was one of the best indicators to quantify liver fat infiltration.15,31–33 What’s more, the AST/ALT ratio was one of the best predictors for IR in the Asian population, which was a prominent marker for metabolic syndrome and T2DM.9,11,14,33,34
Liver enzyme markers, especially ALT and AST/ALT ratio, were the surrogate marker for incidence of T2DM and impaired fasting glucose (IFG) tolerance.11,12,35,36 A cross-sectional study includes 8863 Korean participants conducted by Ko et al12 showed that AST/ALT was negatively associated with the incidence of T2DM, which showed the same conclusion with our present cohort study. An inflection point was expected in the third quartile of AST/ALT (p for trend <0.05). However, the exact value was not known. In contrast, a study conducted by Jing Xu showed that the association between AST/ALT ratio was positively correlated with the incidence of diabetic nephropathy.37 The possible reasons for these inconsistent findings were as follows: (1) The study population was different from us; the participants in our study excluded diabetic patients and someone who took any medicine at baseline when they were enrolled. The participants in the above study were diabetic patients, and the drugs they took and their basic hyperglycemia status could make changes in transaminase.27,38–40 and as the article above said, it was difficult to determine which drugs might affect liver transaminase due to drug interactions. (2) The dependent variable in this study was different from us. Our study aimed to find out the relationship between AST/ALT ratio and the incidence of T2DM, and the study above was to discover whether AST/ALT ratio was associated with diabetic nephropathy in patients with type 2 diabetes mellitus. (3) The confounding factors adjustments of the two research were different, our study adjusted for age, WC, BMI, exercise, ethanol consumption, smoking status, SBP, DBP, TC, HDL, TG, FPG, and they did not adjust for TC, HDL. Previous study has shown that blood lipids were linked to the incidence of diabetes.20 (4) Our study took curve fitting model to make sure the AST/ALT ratio was negatively associated with the incidence of T2DM when the AST/ALT ratio was less than 0.882, when the AST/ALT ratio was greater than 0.882, their relationship got saturated, but the study above did not prove whether there was a curvilinear relationship between AST/ALT ratio and diabetic nephropathy. (5) The sample size varied greatly between different studies. And our research strongly supports the results of existing studies that AST/ALT ratio was negatively correlated with incident T2DM when the AST/ALT ratio was less than the inflection point.
Taken together, AST/ALT ratio was representative of fatty infiltrate in NAFLD and was a strong predictor for the occurrence of T2DM. IR played a central role in the pathogenesis of T2DM in NAFLD.4,34,38 In the process of developing hepatic IR, non-esterified fatty acid (NEFA) and its metabolites (diacylglycerols, DAGs) played an essential role through the activation of JNK1 and DAG-PKCε pathways.8,28
The smooth curve analysis in our research showed a non-linear correlation between the AST/ALT ratio and the incidence of T2DM. It was reported that AST/ALT ratio was <1 in NAFLD or insulin-resistant patients.15,39 To our knowledge, the present study was the first to elucidate the inflection point for the association between the AST/ALT ratio and the incidence of T2DM. We used the curve fitting method to find the inflection point for the risk of T2DM. When AST/ALT <0.882, the incidence of T2DM decreased with AST/ALT increased (HR = 0.287, 95% CI: 0.126–0.655, p = 0.0030). While AST/ALT >0.882, the relationship between AST/ALT ratio and incidence of T2DM is insignificant. It showed that when AST/ALT ratio was below 0.882, the risk of developing diabetes decreased significantly with AST/ALT ratio levels increasing. These people should take measures to prevent the development of diabetes. The findings of this study might be helpful for the establishment of diagnostic or predictive models of the risk of diabetes, which was more convenient to guide clinical work.
There are several strengths in our study. First, the sample size in our study is relatively large, more representative of the Japanese population. Second, we used a generalized additive model (GAM) and a smooth fitting curve analysis to find the inflection point between AST/ALT ratio and the incidence of T2DM, which may guide the clinical practice; Third, we adjusted the potential confounders strictly, which could make the results more reliable. Fourth, we convert AST/ALT ratio to a categorical variable to make a sensitivity analysis of the results to ensure the stability of the results. Furthermore, we also conducted a subgroup analysis to determine whether other risk factors may influence the association between AST/ALT and the incidence of T2DM.
Some limitations in our study should be mentioned. First, data was collected by Okamura16 in the Gifu area in Japan and could represent the characteristics of the Japanese population. Due to this limitation, we cannot conclude that this finding was also applicable to other races and other special populations, such as pregnant women, the elderly, and children. However, the large sample size and similarity of the Asian population made the research results representative of the Asian population. Secondly, this study was a secondary analysis of published data, we could not measure confounding factors that were not included in the data, and according to our inclusion and exclusion criteria, we excluded heavy drinking, viral hepatitis, and also excluded the patients who have used drugs before base measurement. So, it was impossible to derive the influence of these factors on the incidence of diabetes. However, we could re-develop the research and collect the influence factors obtained as much as possible. Thirdly, the incidence of diabetes might be underestimated due to the lack of oral glucose tolerance testing. However, due to practical reasons and logistical issues, performing oral glucose tolerance tests on all participants was not feasible.
Conclusion
The relationship between AST/ALT ratio and T2DM risk was non-linear, and the inflection point was 0.882. AST/ALT ratio was negatively associated with incident type 2 diabetes while AST/ALT ratio <0.882. A stronger association can also be found in the population who did not exercise.
Abbreviations
BMI, Body mass index; WC, Waist circumference; SBP, Systolic blood pressure; DBP, Diastolic blood pressure; FPG, Fasting plasma glucose; HbA1c, Hemoglobin A1c; TC, Total cholesterol; TG, Triglyceride; HDL-C, high-density lipoprotein cholesterol; ALT, Alanine aminotransferase; AST, Aspartate aminotransferase; AST/ALT, Aspartate aminotransferase/Alanine aminotransferase ratio; GGT, gamma-glutamyl transferase; NAFLD, Non-alcoholic fatty liver disease; NEFA, Non-esterified fatty acid; IR, Insulin resistance; HOMA-IR, Homeostatic Model Assessment of insulin resistance; IFG, impaired fasting glucose; T2DM, Type 2 diabetes mellitus; DAGs, diacylglycerols; GAM, Generalized additive models; HR, hazard ratios; OR, Odds ratio; CI, Confidence intervals; Ref, Reference; SD, standard deviation.
Data Sharing Statement
Data can be downloaded from the NAGALA (NAfld in the Gifu Area, Longitudinal Analysis) database (https://doi.org/10.5061/dryad.8q0p192).
Ethics Approval and Consent to Participate
The study was conducted in accordance with the Declaration of Helsinki. The hospital institutional review board of Shenzhen Second People ‘s Hospital agreed and approved the implementation of the study. The author of the raw study has given up all copyrights and related ownership of these data, and users were allowed to download the raw data for free.
Author Contributions
All authors made significant contributions to the work reported, whether in terms of concept, research design, execution, data acquisition, analysis and interpretation, or in all these areas. Participated in drafting, revising or critically reviewing the article; have agreed on the journal to which the article will be submitted. All authors reviewed and agreed to all versions of the article before submitting, during revision, accepting the final version for publication, and any major changes introduced during the proofreading phase. And they all agree to be responsible for the content of the article.
Funding
This study was supported by the Discipline Construction Ability Enhancement Project of the Shenzhen Municipal Health Commission (SZXJ2017031).
Disclosure
The authors report no conflicts of interest in this work.
References
1. Zhou B, Lu Y, Hajifathalian K, Bentham J, Di Cesare M, Danaei G. Worldwide trends in diabetes since 1980: a pooled analysis of 751 population-based studies with 4.4 million participants. NCD Risk Factor Collaboration (NCD-RisC). Lancet. 2016;387:1513–1530. doi:10.1016/S0140-6736(16)00618-8
2. Bommer C, Heesemann E, Sagalova V, et al. The global economic burden of diabetes in adults aged 20–79 years: a cost-of-illness study. Lancet Diabetes Endocrinol. 2017;5(6):423–430. doi:10.1016/s2213-8587(17)30097-9
3. Diniz M, Beleigoli AMR, Schmidt MI, et al. Homeostasis model assessment of insulin resistance (HOMA-IR) and metabolic syndrome at baseline of a multicentric Brazilian cohort: ELSA-Brasil study. Cad Saude Publica. 2020;36(8):e00072120. doi:10.1590/0102-311X00072120
4. Petersen MC, Shulman GI. Mechanisms of insulin action and insulin resistance. Physiol Rev. 2018;98(4):2133–2223. doi:10.1152/physrev.00063.2017
5. Ballestri S, Zona S, Targher G, et al. Nonalcoholic fatty liver disease is associated with an almost twofold increased risk of incident type 2 diabetes and metabolic syndrome. Evidence from a systematic review and meta-analysis. J Gastroenterol Hepatol. 2016;31(5):936–944. doi:10.1111/jgh.13264
6. Younossi ZM, Golabi P, de Avila L, et al. The global epidemiology of NAFLD and NASH in patients with type 2 diabetes: a systematic review and meta-analysis. J Hepatol. 2019;71(4):793–801. doi:10.1016/j.jhep.2019.06.021
7. Samuel VT, Liu ZX, Qu X, et al. Mechanism of hepatic insulin resistance in non-alcoholic fatty liver disease. J Biol Chem. 2004;279(31):32345–32353. doi:10.1074/jbc.M313478200
8. Seki E, Brenner DA, Karin M. A liver full of JNK: signaling in regulation of cell function and disease pathogenesis, and clinical approaches. Gastroenterology. 2012;143(2):307–320. doi:10.1053/j.gastro.2012.06.004
9. Kawamoto R, Kohara K, Kusunoki T, Tabara Y, Abe M, Alanine MT. Alanine aminotransferase/aspartate aminotransferase ratio is the best surrogate marker for insulin resistance in non-obese Japanese adults. Cardiovasc Diabetol. 2012;11(1):117. doi:10.1186/1475-2840-11-117
10. Gao F, Huang XL, Jiang XP, et al. Independent effect of alanine transaminase on the incidence of type 2 diabetes mellitus, stratified by age and gender: a secondary analysis based on a large cohort study in China. Clin Chim Acta. 2019;495:54–59. doi:10.1016/j.cca.2019.03.1636
11. Kwon SS, Lee SG, High Alanine A. Aminotransferase/aspartate aminotransferase ratio determines insulin resistance and metabolically healthy/unhealthy obesity in a general adult population in Korea: the Korean National Health and Nutritional Examination Survey 2007–2010. Exp Clin Endocrinol Diabetes. 2019;127(10):677–684. doi:10.1055/a-0752-0217
12. Ko SH, Baeg MK, Han KD, Ko SH, Ahn YB. Increased liver markers are associated with higher risk of type 2 diabetes. World J Gastroenterol. 2015;21(24):7478–7487. doi:10.3748/wjg.v21.i24.7478
13. Nanji AA, French SW, Freeman JB. Serum alanine aminotransferase to aspartate aminotransferase ratio and degree of fatty liver in morbidly obese patients. Enzyme. 1986;36(4):266–269. doi:10.1159/000469304
14. Zhao L, Cheng J, Chen Y, et al. Serum alanine aminotransferase/aspartate aminotransferase ratio is one of the best markers of insulin resistance in the Chinese population. Nutr Metab (Lond). 2017;14:64. doi:10.1186/s12986-017-0219-x
15. Simental-Mendia LE, Rodriguez-Moran M, Gomez-Diaz R, Wacher NH, Rodriguez-Hernandez H, Guerrero-Romero F. Insulin resistance is associated with elevated transaminases and low aspartate aminotransferase/alanine aminotransferase ratio in young adults with normal weight. Eur J Gastroenterol Hepatol. 2017;29(4):435–440. doi:10.1097/MEG.0000000000000811
16. Okamura T, Hashimoto Y, Hamaguchi M, Obora A, Kojima T, Fukui M. Ectopic fat obesity presents the greatest risk for incident type 2 diabetes: a population-based longitudinal study. Int J Obes. 2019;43(1):139–148. doi:10.1038/s41366-018-0076-3
17. Genuth S, Alberti KG, Bennett P, Buse J. Follow-up report on the diagnosis of diabetes mellitus. Diabetes Care. 2003;26(11):3160–3167. doi:10.2337/diacare.26.11.3160
18. Zhang N, Hu X, Zhang Q, et al. Non-high-density lipoprotein cholesterol high-density lipoprotein cholesterol ratio is an independent risk factor for diabetes mellitus. Results from a population-based cohort study. J Diabetes. 2018;10(9):708–714. doi:10.1111/jdb.12650
19. American Diabetes A. Diagnosis and classification of diabetes mellitus. Diabetes Care. 2013;36(Suppl 1):S67–74. doi:10.2337/dc13-S067
20. Chen Z, Hu H, Chen M, et al. Association of Triglyceride to high-density lipoprotein cholesterol ratio and incident of diabetes mellitus: a secondary retrospective analysis based on a Chinese cohort study. Lipids Health Dis. 2020;19(1):33. doi:10.1186/s12944-020-01213-x
21. Vandenbroucke JP, von Elm E, Altman DG, Gøtzsche PC, Mulrow CD, Pocock SJ. Strengthening the Reporting of Observational Studies in Epidemiology (STROBE): explanation and elaboration. PLoS Med. 2007;4(10):e297. doi:10.1371/journal.pmed
22. Lee MK, Han K, Kim MK, et al. Combinations of metabolic syndrome components and the risk of type 2 diabetes mellitus: a nationwide cohort study. Diabetes Res Clin Pract. 2020;165:108237. doi:10.1016/j.diabres.2020.108237
23. Li C, Hsieh MC, Chang SJ. Metabolic syndrome, diabetes, and hyperuricemia. Curr Opin Rheumatol. 2013;25(2):210–216. doi:10.1097/BOR.0b013e32835d951e
24. Lillioja S, Mott DM, Spraul M, et al. Insulin resistance and insulin secretory dysfunction as precursors of non-insulin-dependent diabetes mellitus. Prospective studies of Pima Indians. N Engl J Med. 1993;329(27):1988–1992. doi:10.1056/nejm199312303292703
25. Wu WC, Wei JN, Chen SC, et al. Progression of insulin resistance: a link between risk factors and the incidence of diabetes. Diabetes Res Clin Pract. 2020;161:108050. doi:10.1016/j.diabres.2020.108050
26. Zheng X, Cao C, He Y, Wang X, Wu J, Hu H. Association between nonalcoholic fatty liver disease and incident diabetes mellitus among Japanese: a retrospective cohort study using propensity score matching. Lipids Health Dis. 2021;20(1):59. doi:10.1186/s12944-021-01485-x
27. Loria P, Lonardo A, Anania F. Liver and diabetes. A vicious circle. Hepatol Res. 2013;43(1):51–64. doi:10.1111/j.1872-034X.2012.01031.x
28. Birkenfeld AL, Shulman GI. Nonalcoholic fatty liver disease, hepatic insulin resistance, and type 2 diabetes. Hepatology. 2014;59(2):713–723. doi:10.1002/hep.26672
29. Liu CF, Zhou WN, Lu Z, Wang XT, Qiu ZH. The associations between liver enzymes and the risk of metabolic syndrome in the elderly. Exp Gerontol. 2018;106:132–136. doi:10.1016/j.exger.2018.02.026
30. Zhang L, Ma X, Jiang Z, et al. Liver enzymes and metabolic syndrome: a large-scale case-control study. Oncotarget. 2015;6(29):26782–26788. doi:10.18632/oncotarget.5792
31. Lee K, Yang JH. Which liver enzymes are better indicators of metabolic syndrome in adolescents: the Fifth Korea National Health and Nutrition Examination Survey, 2010. Metab Syndr Relat Disord. 2013;11(4):229–235. doi:10.1089/met.2012.0153
32. Bril F, Barb D, Portillo-Sanchez P, et al. Metabolic and histological implications of intrahepatic triglyceride content in nonalcoholic fatty liver disease. Hepatology. 2017;65(4):1132–1144. doi:10.1002/hep.28985
33. Zou Y, Zhong L, Hu C, Sheng G. Association between the alanine aminotransferase/aspartate aminotransferase ratio and new-onset non-alcoholic fatty liver disease in a nonobese Chinese population: a population-based longitudinal study. Lipids Health Dis. 2020;19(1):245. doi:10.1186/s12944-020-01419-z
34. Kim CH, Kim HK, Kim EH, Bae SJ, Park JY. Relative contributions of insulin resistance and beta-cell dysfunction to the development of Type 2 diabetes in Koreans. Diabet Med. 2013;30(9):1075–1079. doi:10.1111/dme.12201
35. Qian K, Zhong S, Xie K, Yu D, Yang R, Gong DW. Hepatic ALT isoenzymes are elevated in gluconeogenic conditions including diabetes and suppressed by insulin at the protein level. Diabetes Metab Res Rev. 2015;31(6):562–571. doi:10.1002/dmrr.2655
36. Pinnaduwage L, Ye C, Hanley AJ, et al. Changes over time in hepatic markers predict changes in insulin sensitivity, beta-cell function, and glycemia. J Clin Endocrinol Metab. 2018;103(7):2651–2659. doi:10.1210/jc.2018-00306
37. Derakhshan A, Tohidi M, Arshi B, Khalili D, Azizi F, Hadaegh F. Relationship of hyperinsulinaemia, insulin resistance and beta-cell dysfunction with incident diabetes and pre-diabetes: the Tehran Lipid and Glucose Study. Diabet Med. 2015;32(1):24–32. doi:10.1111/dme.12560
38. Menon PD, Singh T, Hubbard H, Hackman S, Sharkey FE. Cholangiolytic changes in statin-induced liver injury. Case Rep Pathol. 2020;2020:9650619. doi:10.1155/2020/9650619
39. Bjornsson E, Jacobsen EI, Kalaitzakis E. Hepatotoxicity associated with statins: reports of idiosyncratic liver injury post-marketing. J Hepatol. 2012;56(2):374–380. doi:10.1016/j.jhep.2011.07.023
40. Meurer L, Cohen SM. Drug-induced liver injury from statins. Clin Liver Dis. 2020;24(1):107–119. doi:10.1016/j.cld.2019.09.007
 © 2021 The Author(s). This work is published and licensed by Dove Medical Press Limited. The full terms of this license are available at https://www.dovepress.com/terms.php and incorporate the Creative Commons Attribution - Non Commercial (unported, v3.0) License.
By accessing the work you hereby accept the Terms. Non-commercial uses of the work are permitted without any further permission from Dove Medical Press Limited, provided the work is properly attributed. For permission for commercial use of this work, please see paragraphs 4.2 and 5 of our Terms.
© 2021 The Author(s). This work is published and licensed by Dove Medical Press Limited. The full terms of this license are available at https://www.dovepress.com/terms.php and incorporate the Creative Commons Attribution - Non Commercial (unported, v3.0) License.
By accessing the work you hereby accept the Terms. Non-commercial uses of the work are permitted without any further permission from Dove Medical Press Limited, provided the work is properly attributed. For permission for commercial use of this work, please see paragraphs 4.2 and 5 of our Terms.