")
Back to Journals » International Journal of Chronic Obstructive Pulmonary Disease » Volume 17
Association Between Anthropometric Indices and Skeletal-Muscle Atrophy in Chinese Patients with Stable Chronic Obstructive Pulmonary Disease: A Cross-Sectional Study
Authors Han Y , Wu Z, Zhao Q, Jiang B, Miao X, Lu X, Qian H, Niu M
Received 20 May 2022
Accepted for publication 24 September 2022
Published 11 October 2022 Volume 2022:17 Pages 2529—2539
DOI https://doi.org/10.2147/COPD.S373880
Checked for plagiarism Yes
Review by Single anonymous peer review
Peer reviewer comments 2
Editor who approved publication: Professor Min Zhang
Yanxia Han,1,* Zhenyun Wu,1,* Qian Zhao,1 Bo Jiang,2 Xiaolang Miao,2 Xiangmin Lu,2 Hongying Qian,1 Meie Niu1
1Department of Respiratory Medicine, The First Affiliated Hospital of Soochow University, Suzhou, People’s Republic of China; 2School of Nursing, Soochow University, Suzhou, People’s Republic of China
*These authors contributed equally to this work
Correspondence: Meie Niu, Department of Respiratory Medicine, The First Affiliated Hospital of Soochow University, 188th, Shizi Street, Suzhou, 215006, People’s Republic of China, Tel +86 13812671786, Email [email protected]
Purpose: Anthropometric indices are simple indicators of patient nutritional status. However, the association between these indices and skeletal-muscle atrophy in patients with stable chronic obstructive pulmonary disease (COPD) has not been fully investigated. In this study, we evaluated this association.
Patients and Methods: We recruited 123 outpatients with stable COPD from a general hospital in China from 2020 to 2021. We recorded their demographic characteristics, including age, sex, course of illness, dyspnea score, body mass index (BMI), force expiratory volume in 1 second (FEV1), forced vital capacity (FVC), smoking status, and severity grading. In addition, patients’ anthropometric indices, including fat-free mass index (FFMI) and appendicular skeletal-muscle mass index (ASMI), were measured using a body composition analyzer, and measurements were taken of the triceps skinfold (TSF), midarm circumference (MAC), and calf circumference (CC). We drew and analyzed a receiver operating characteristic (ROC) curve to identify the best intercept point value for the assessment of skeletal-muscle atrophy.
Results: The TSF, MAC, CC, FFMI, and ASMI of COPD patients were 1.08 ± 0.44 cm, 26.39 ± 2.92 cm, 34.5 ± 3.06 cm, 17.49 ± 1.86 kg/m2, and 8.17 ± 0.90 kg/m2, respectively. These anthropometric indices had a significant positive correlation with skeletal-muscle mass (correlation values, 0.481– 0.820). CC was strongly correlated with both FFMI and ASMI. The ROC curve showed an area-under-the-curve (AUC) value of 0.873– 0.959.
Conclusion: Anthropometric indices were correlated with skeletal-muscle mass. CC showed the best diagnostic value in COPD patients, suggesting its effectiveness as a simple method for assessing skeletal-muscle atrophy and identifying patients with a noticeable reduction in muscle mass. Such patients require early, multidisciplinary intervention.
Keywords: fat-free mass, skeletal-muscle mass, chronic obstructive pulmonary disease, anthropometric index, muscle atrophy
Introduction
Chronic obstructive pulmonary disease (COPD) is a chronic lung disease characterized by progressive airflow limitation and respiratory symptoms such as worsening dyspnea, chronic cough, and sputum.1 In addition to the respiratory symptoms, COPD patients develop skeletal-muscle atrophy, osteoporosis, and pulmonary heart disease. Skeletal-muscle atrophy, also known as skeletal-muscle wasting, results in loss of muscle cells and decline in muscle mass. Skeletal-muscle atrophy is associated with inflammation, chronic hypoxia, oxidative-stress (OS) reaction, protein synthesis, and/or decomposition imbalance.
Muscle strength and endurance are the main physiological manifestations of skeletal-muscle function, and their roles are closely related to muscle volume and muscle fiber type. Altered muscle fiber type is the basis of skeletal-muscle dysfunction. Patients with COPD have chronic airway inflammation, and inflammatory-factor infiltration induces a change in muscle fiber type, mainly from type I to II. This increases the proportion of type II fibers, which mainly have anaerobic metabolism and are more prone to fatigue, affecting skeletal-muscle function. Muscle fiber type shifting in the vastus lateralis of COPD patients is associated with disease severity.2 Muscle fiber atrophy was also found to be aggravated due to airway inflammation, which accelerated apoptosis in muscle cells.3,4 The prevalence of skeletal-muscle atrophy in COPD patients is 15–50%. Skeletal-muscle atrophy limits daily activities,3 impairs quality of life, and increases the risk of death. Pulmonary rehabilitation in COPD has proven to be very successful in improving skeletal-muscle dysfunction5,6 and quality of life. Therefore, a skeletal-muscle assessment and early interventions, such as pulmonary rehabilitation, are crucial in treating COPD patients.
Skeletal-muscle assessment techniques include dual energy X-ray absorptiometry (DEXA), bioelectrical-impedance analysis (BIA), computed tomography (CT), and magnetic resonance imaging (MRI). Scholars reported that fat-free mass (FFM) and appendicular skeletal-muscle mass (ASM) as measured by BIA effectively measure skeletal-muscle mass and nutritional status,5 which are significantly associated with respiratory-muscle function and mobility in COPD patients. However, these techniques are not widely performed due to certain limitations, such as high equipment cost and complexity of use. Therefore, simple techniques to evaluate skeletal-muscle atrophy must be developed.
Anthropometric indices are simple indicators of patient nutritional status and associated with protein energy wasting and prognosis in chronic diseases. Previous studies have shown that lower skeletal-muscle mass can predict adverse disease outcomes.7–10 However, the data on the association between these indices and skeletal-muscle mass in COPD are insufficient. In China, studies on anthropometric indices have mainly focused on nutritional assessment and metabolic disorders; the relationships between these indices and skeletal-muscle atrophy have yet to be explored.
Accordingly, the aim of this study was to investigate whether anthropometric indices were associated with skeletal-muscle atrophy in patients with stable COPD. We hypothesized that the higher the values of these indices, the less skeletal-muscle mass, and that therefore the indices could be used as a simple method for assessing skeletal-muscle atrophy and identifying patients with a noticeable reduction in muscle mass.
Materials and Methods
Study Population
This study included COPD patients visiting the outpatient clinic at the First Affiliated Hospital of Soochow University, Suzhou, China, between September 2020 and September 2021. Patients were included if they were >40 years old, had a diagnosis of stable COPD (evaluated by spirometry with a post-bronchodilator force expiratory volume in 1 second [FEV1] of less than 70% of forced vital capacity, as defined by the Global Initiative for Chronic Obstructive Lung Disease [GOLD]), had experienced no exacerbations in the past 30 days, and were able to complete the related questionnaires and tests. The study excluded patients with congestive heart failure, arrhythmias, cardiomyopathy, rheumatic disease, and neuromuscular disorders, which could affect respiratory symptoms or performance of physical activity. Patients were excluded if they had metal implants such as pacemakers or fixing nails. A total of 123 patients were included. The study protocol was approved by the Ethics Committee of the First Affiliated Hospital of Soochow University, and all patients provided written informed consent. This observational study protocols were performed in accordance with the principles outlined in the Declaration of Helsinki of the World Medical Association.
Measurements
A multi-frequency BIA (BCA-2A; Tsinghua Tongfang, Beijing, China) was used to measure skeletal-muscle mass. We measured FFM and ASM; their corresponding indices (ASMI, FFMI) are expressed as ASM/height2 and FFM/height2, respectively. The following cutoff values were used to identify skeletal-muscle atrophy: 7.0 kg/m2 and 16 kg/m2 for ASMI and FFMI in males, respectively; and 5.7 kg/m2 and 15 kg/m2 for ASMI and FFMI in females, respectively. Patients were asked to avoid eating a meal 2 h before the test. They wore lightweight clothing, removed their shoes, and stood on a platform. We took measurements while participants held the handgrips straight out and kept them open at a 15° angle. Measurements were taken by well-trained staff and completed within 2 min.
TSF was measured using a skinfold caliper (YuanYan, Zhengjiang, China). The pointer in the disk was adjusted to the “0” position on the dial scale, and relevant corrections were made before use. Patients stood in a relaxed, natural posture with the dominant arm fully exposed for measurement. The examiner located the acromion and olecranon in the bony protrusion of the elbow and marked the midpoint of these two points using a marker. The skin on the midpoint was pinched and lifted with the left thumb, index finger, and middle finger. The open sebometer was used to clampe 1 cm from the pinched point, and the instrument handle was released using the right finger. The position of the pointer was immediately noted to determine the value. We took each measurement three times and recorded the average value for data analysis.
An inelastic meter ruler (Deli, Suzhou, China) was used to encircle the arms around the midpoint of the line connecting the acromion and olecranon. After achieving appropriate tightness, we measured midarm circumference (MAC) three times and recorded the average value for data analysis. Participants were seated with the trouser leg of the dominant leg rolled up and the shoe and sock removed from that foot, with the knees bent at 90°. We used the inelastic meter ruler to measure the widest part of the calf. Each measurement was taken three times, and the average calf circumference (CC) was used for data analysis. We estimated midarm muscle circumference (MAMC) and midarm muscle area (MAMA) using MAC and TSF according to the following formulae:11


Statistical Analyses
Data were analyzed using SPSS version 17.0 (IBM Corp., Armonk, NY, USA). We assessed normality using the Kolmogorov–Smirnov test. Mean ± standard deviation (SD) or frequency and percentage were used to describe demographic data. We used independent-sample t-tests and one-way analysis for comparative analysis. We used Pearson’s or Spearman correlation coefficient to determine the relationships between anthropometric indices and skeletal-muscle mass. Statistical significance was set at P < 0.05. In addition, we performed a multiple linear-regression analysis with FFMI and ASMI as the dependent variables that included all significant independent predictors. Variables in the final model were tested for collinearity. Receiver operating characteristic (ROC) curves were constructed to determine optimal cutoff values of anthropometric data for skeletal-muscle atrophy in COPD patients. We used FFMI and ASMI as classification variables. The cutoff values for skeletal-muscle atrophy were as follows: for males, 7.0 kg/m2 and 16 kg/m2 for ASMI and FFMI, respectively; for females, 5.7 kg/m2 and 15 kg/m2 for ASMI and FFMI, respectively.12,13 We constructed the ROC curve and took the maximum value of the Youden index (YI) as the best cutoff point.
Results
Baseline Characteristics
Table 1 shows the demographic characteristics of 123 patients. The average patient age was 66.74 ± 7.32 years, and 94.31% were male. Patients had a mean BMI of 22.49 ± 3.69 kg/m2, mean smoking index of 694.42 ± 5.91, mean FFM of 48.57 ± 6.79 kg, mean ASM of 22.70 ± 3.25 kg, mean FFMI of 17.49 ± 1.86 kg/m2, and mean ASMI of 8.17 ± 0.90 kg/m2. The prevalence of skeletal-muscle atrophy was 7.3%. The average TSF, MAC, MAMC, MAMA, and CC were 1.08 ± 0.44 cm, 26.39 ± 2.92 cm, 23.01 ± 2.15 cm, 42.51 ± 7.98 cm2, and 34.53 ± 3.06 cm, respectively.
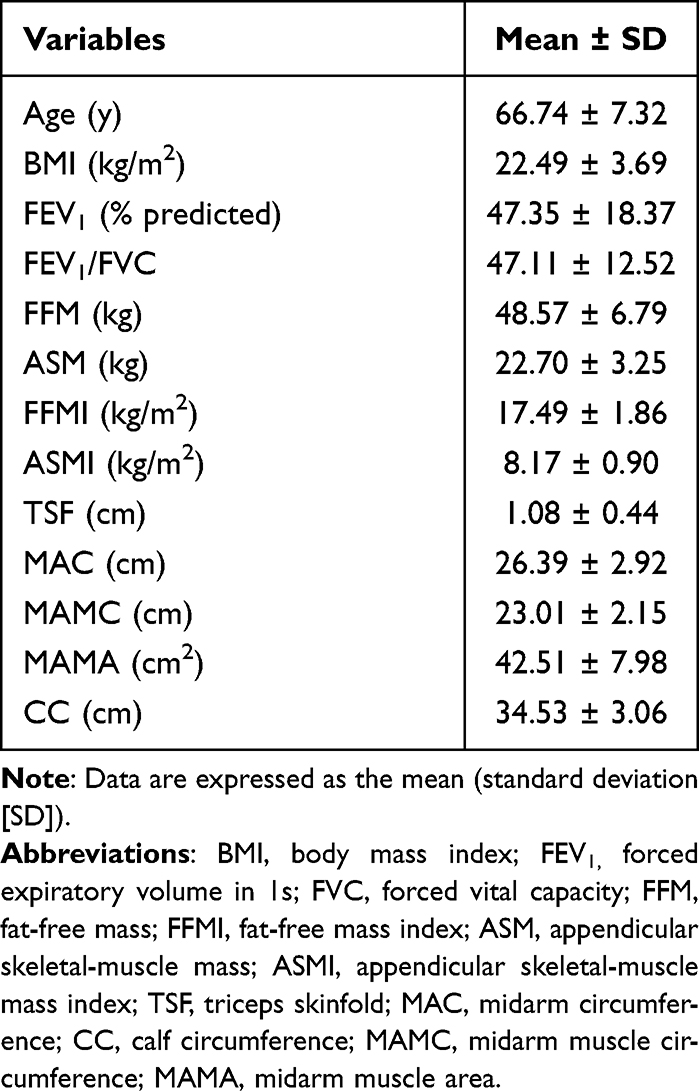 |
Table 1 Patient Characteristics (n = 123) |
Skeletal-Muscle Mass Levels According to Baseline Characteristics
We classified patients into different groups to assess skeletal-muscle mass according to each objective variable (Table 2). There were no statistically significant differences among the groups in terms of proportion of smokers or COPD duration or severity. However, older patients, female patients, and patients with low BMIs had lower FFMI and ASMI.
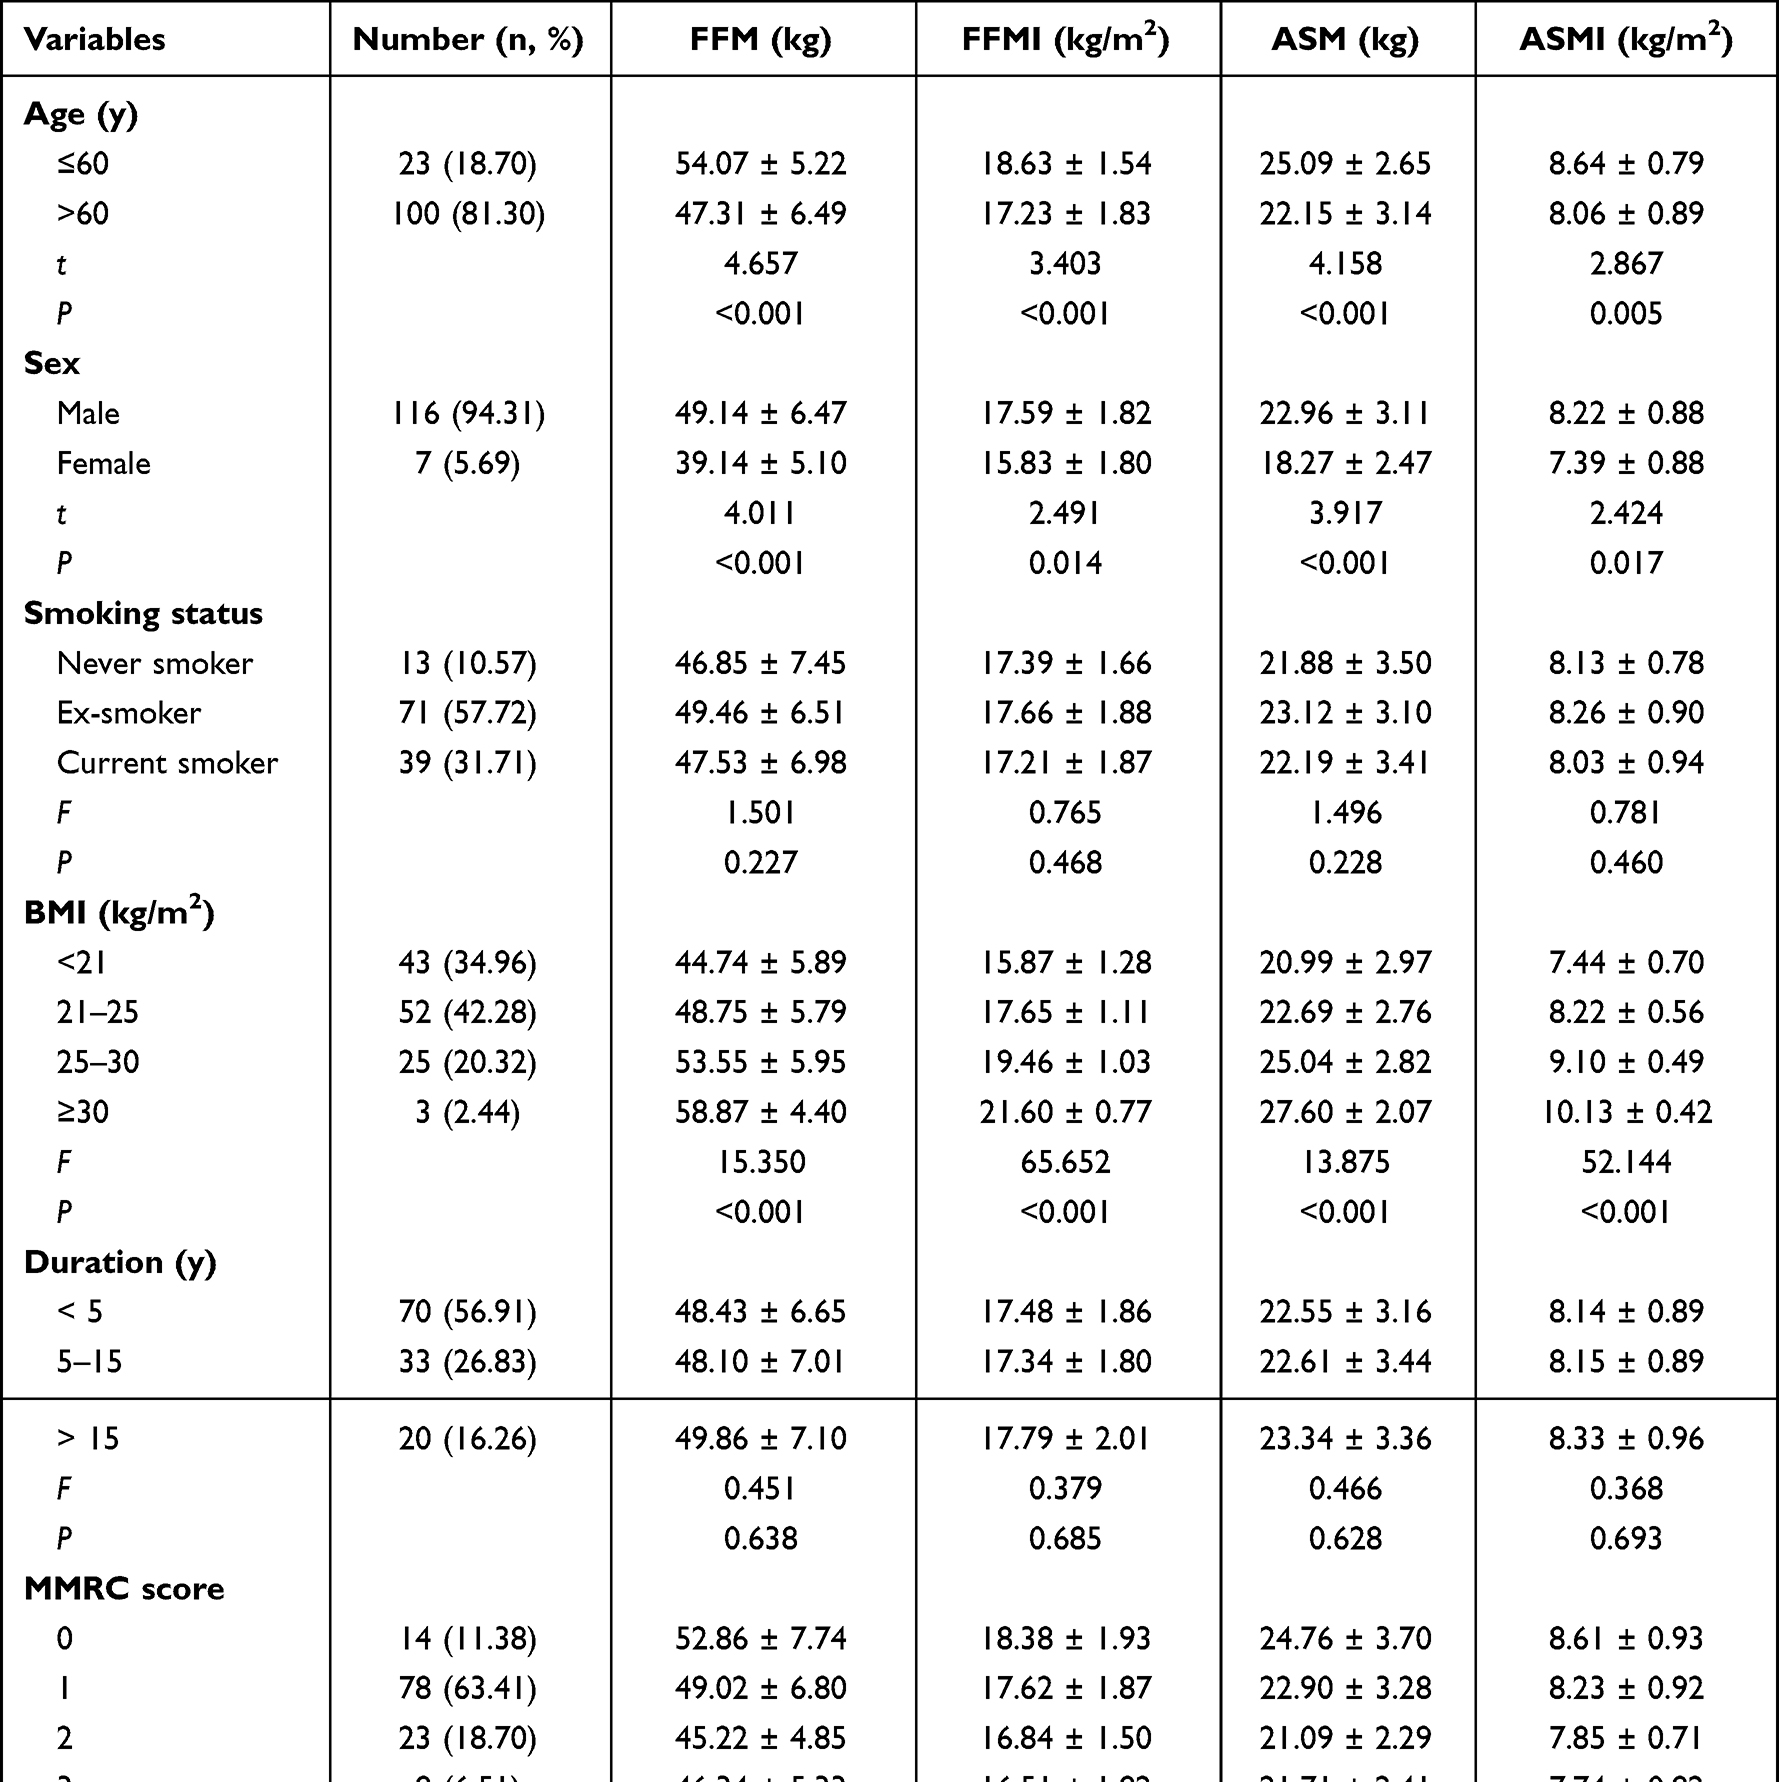 |
Table 2 Comparison of Skeletal-Muscle Mass with Baseline Characteristics |
Association Between Anthropometric Indices and FFMI or ASMI
The associations between FFMI and ASMI on the one hand and anthropometric indices on the other are shown in Table 3. All indices were significantly positively correlated with FFMI or ASMI, with correlation coefficients of 0.481–0.820 that were highest between CC and FFMI (r = 0.820) and between CC and ASMI (r= 0.800; Table 3).
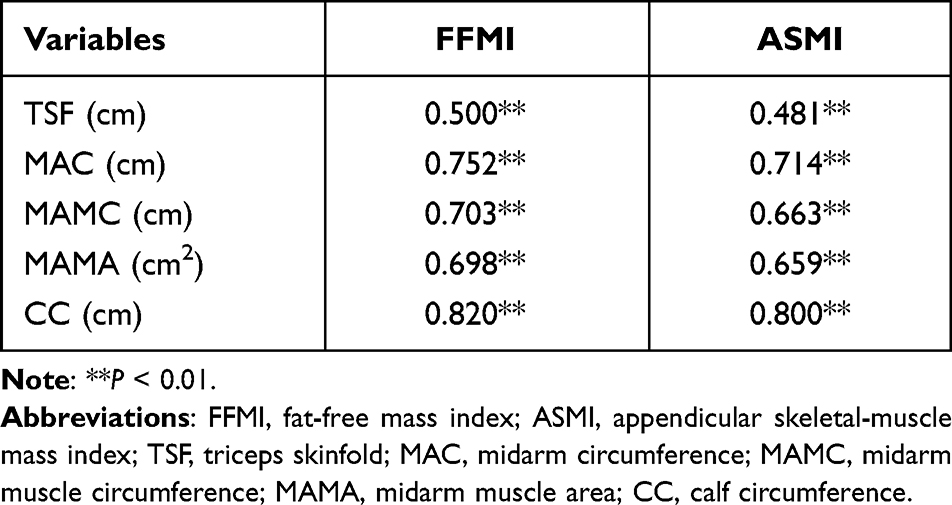 |
Table 3 Correlations Between Anthropometric Data and Skeletal-Muscle Mass |
Multiple Linear-Regression Analysis of FFMI or ASMI
Table 4 shows the results of multiple stepwise linear-regression analysis, delineating the relationship between FFMI and ASMI on the one hand and COPD parameters on the other. CC, BMI, and MAC showed significant positive correlations with FFMI and ASMI (P < 0.001), whereas TSF showed significant negative correlations with FFMI and ASMI (P = 0.001 and P = 0.013, respectively).
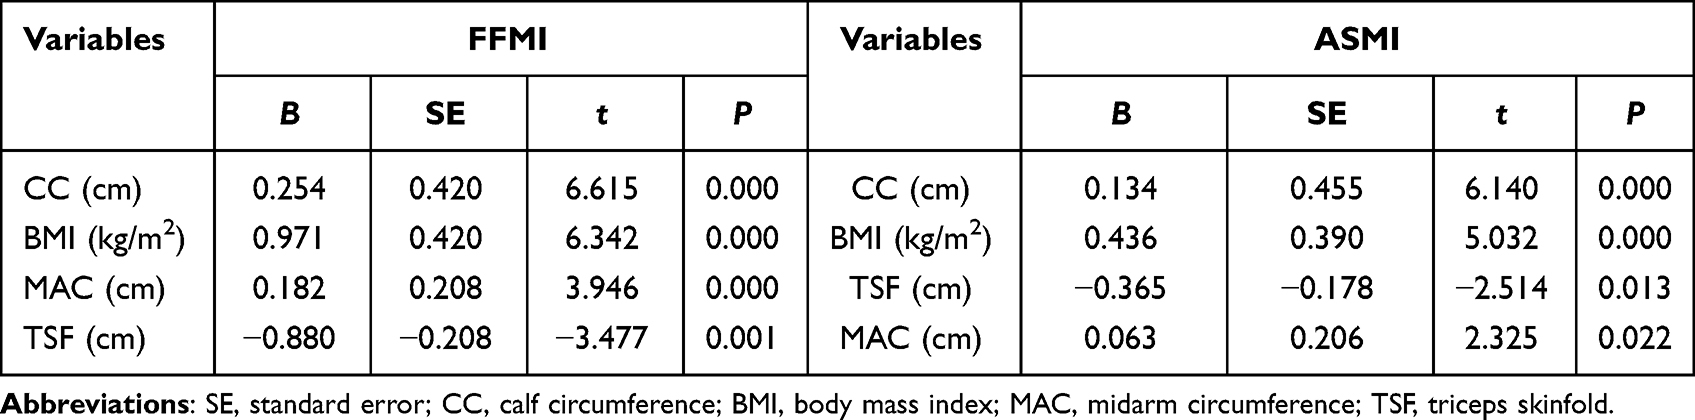 |
Table 4 Multiple-Regression Analysis of Factors Associated with FFMI or ASMI |
ROC Curve of Anthropometric Data for Evaluating Skeletal-Muscle Atrophy
FFMI and ASMI are categorical variables. We plotted ROC curves for four anthropometric indicators (MAC, MAMC, MAMA, and CC) of skeletal-muscle atrophy in COPD patients (Figures 1 and 2). Table 5 shows that the area under the curve (AUC) values of these four indicators ranged from 0.873 to 0.959, especially MAC and CC, with ideal diagnostic value. However, the difference between the AUC values of MAMC and MAMA curves was not statistically significant, and the graphs of the two curves almost overlapped. The cutoff values of anthropometric indicators under the ROC curve was lower for ASMI than for FFMI.
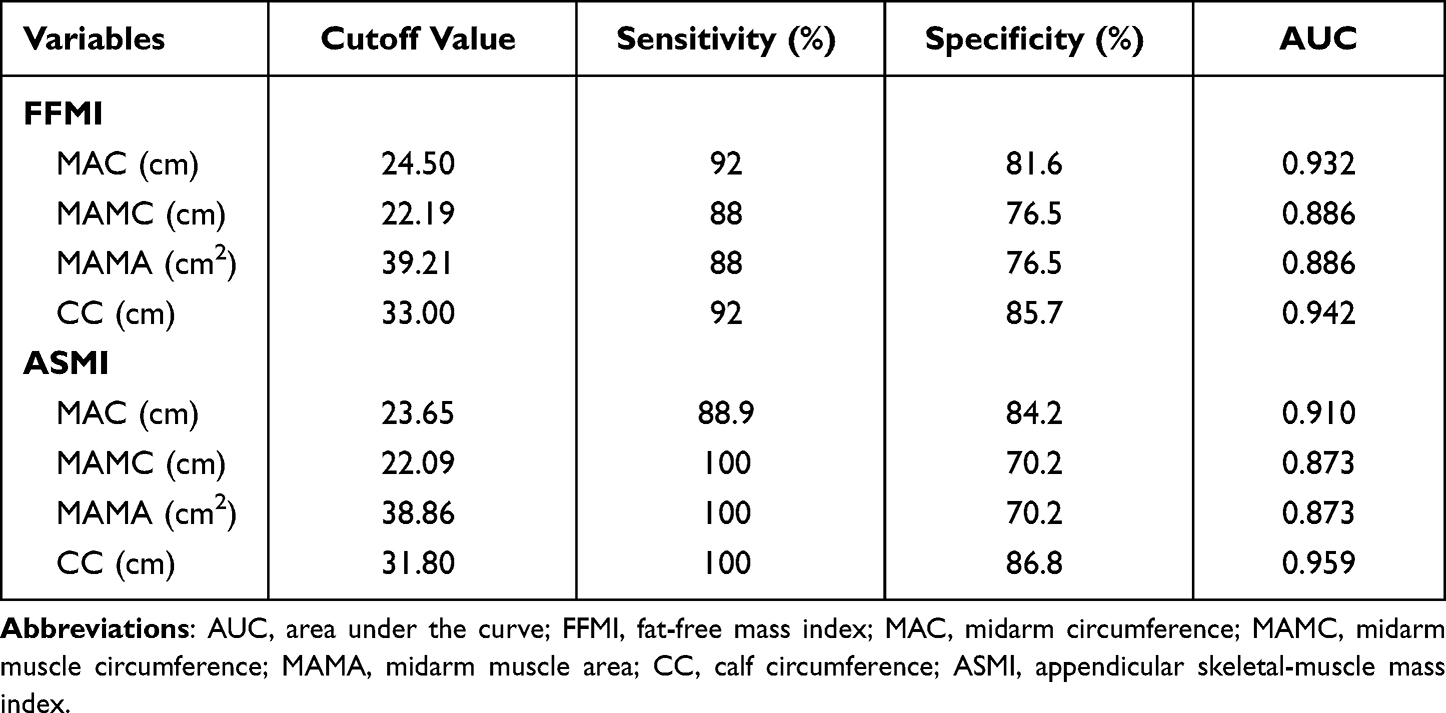 |
Table 5 Anthropometric Data for Evaluating Skeletal-Muscle Atrophy in Stable COPD Patients |
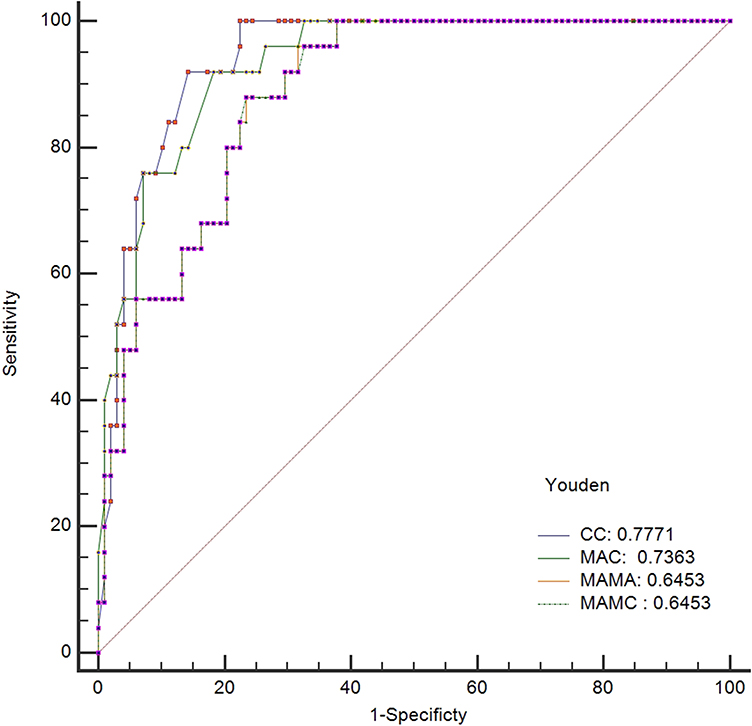 |
Figure 1 Receiver operating characteristic curve of anthropometric data for evaluating skeletal-muscle atrophy (fat-free mass index [FFMI]). |
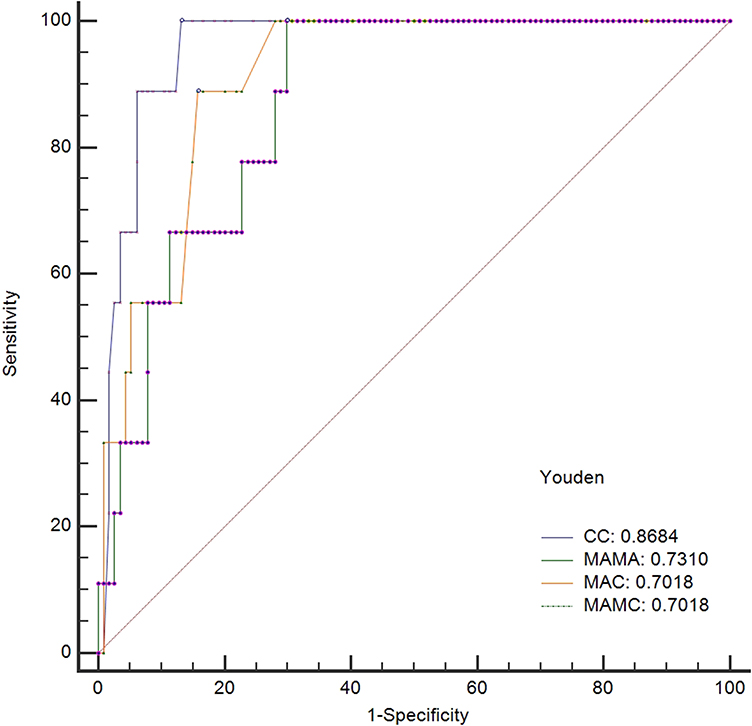 |
Figure 2 Receiver operating characteristic curve of anthropometric data for evaluating skeletal-muscle atrophy (appendicular skeletal-muscle mass index [ASMI]). |
Discussion
The prevalence of skeletal muscle atrophy was 7.3% (9 out of 123 patients), similar to that reported by Liu et al14–16 Our findings suggested that age, sex, BMI, dyspnea, and GOLD score were factors affecting FFMI or ASMI. Skeletal-muscle mass was significantly lower among patients aged >60 years than those aged ≤60 years (P < 0.05). Studies have reported that skeletal muscle is significantly depleted after the age of 50.17 With age, the patient’s mobility declines18 and de-adaptive responses worsen, in turn worsening skeletal-muscle atrophy. Sex is an independent risk factor for skeletal-muscle depletion in COPD patients:19 women have higher fat and lower skeletal-muscle content than men, and changes in body composition, including skeletal-muscle atrophy, are more significantly affected by age in women than in men. Notably, patients with a BMI < 21 kg/m2 had significantly lower skeletal-muscle mass than other patients. Several studies have shown that 20–30% of COPD patients have normal BMI, although a lower ASMI score was also observed.20,21 Due to airflow restriction and inflammatory mediator stimulation,20 patients experience worsening dyspnea, decreased cross-sectional area and number of muscle fibers, altered fiber structure, and lactate accumulation in the muscles,22 resulting in increased skeletal muscle depletion and decreased muscle strength and endurance,23,24 ultimately affecting their quality of life.
We used a multi-frequency BIA to measure skeletal-muscle mass. However, this method is not widely performed due to certain limitations such as high equipment cost and complexity of use. Therefore, simple techniques to evaluate skeletal-muscle atrophy must be developed. Anthropometric indices such as TSF and MAC indirectly reflect patient nutritional status, which is an indicator of disease severity and risk of death. More-severe disease is associated with a higher risk of malnutrition. Mean values of TSF and MAC were 1.08 ± 0.44 cm and 26.39 ± 2.92 cm, respectively, which were 33.2% and 22.7% lower than the normal range. TSF can be used to evaluate body fat stores, while MAC determines skeletal-muscle or lean-tissue mass. In this study, we further explored the correlations between anthropometric indicators and skeletal-muscle mass in stable COPD patients. Table 3 shows that anthropometric indicators were significantly positively correlated with FFMI and ASMI, with r values of 0.481–0.820. In addition, Table 4 also reflects that CC, BMI, MAC, and TSF were associated with skeletal-muscle mass in multiple-regression analysis. These results suggested that these indices could indirectly reflect patient skeletal-muscle mass. However, the usefulness of simple anthropometric indices to assess the quality of skeletal muscle in patients still needs to be explored.
The AUC values, which reflects diagnostic or screening value, were 0.5–1.0; larger values correlated with higher predictive diagnostic value. In particular, when AUC > 0.7, the diagnostic value was high. Table 5 shows that AUC values of anthropometric indices were 0.873–0.959, especially for MAC and CC. However, the difference between the AUC values of the MAC and MAMA curves was not statistically significant; the graphs of the two curves almost overlapped, possibly because they were highly correlated, and subtle variations are difficult to observe. Table 3 and Figures 1 and 2 and show that ROC curve cutoff values of indices with ASMI as the classification variable were lower than those with FFMI as the variable. FFM includes skeletal muscle, minerals, and water components. Therefore, in addition to skeletal-muscle atrophy, FFM is also influenced by abnormalities of the other components. In contrast, ASMI measures the skeletal-muscle mass of the limbs, which is useful for maintaining the body’s daily activities.25
The lower-extremity muscles are the main weight-bearing muscles, and the rate of skeletal-muscle depletion in COPD patients is much greater in the lower than in the upper limbs26,27 due to long-term sedentary lifestyles and poor mobility.28 Therefore, it is crucial to assess lower-extremity function. We found the diagnostic value of CC in skeletal-muscle depletion to be much higher than that of upper-extremity–related circumference markers, which was in line with the findings of Bonnefoyd et al.29 Lower-extremity muscles account for about half of total body muscle mass. Significant changes in muscle consumption in the lower extremities directly affects CC and leads to a decrease in the patient’s physical ability.30
CC is an anthropometric index for assessing nutritional status in the elderly, and studies have shown that it predicts risk of death in the elderly and is closely related to ASM.31–33 In this study, CC was closely related to skeletal-muscle atrophy (r = 0.820 and 0.800). The optimal cutoff point of CC in the diagnosis of skeletal-muscle atrophy was set to 33 cm (sensitivity = 0.92, specificity = 0.857) with FFMI as the categorical variable and 31.8 cm (sensitivity = 1, specificity = 0.868) with ASMI as the categorical variable. As weight-bearing muscles, the lower-limb muscle groups are responsible for functions such as walking and daily activities, and minor changes in CC affect self-care ability and quality of life. When the patient has dyspnea or acute exacerbation of disease, mobility is reduced in order to lessen wheezing and shortness of breath, and this accelerates lower-limb muscle wasting, atrophy, loss of muscle volume, and reduction in CC. CC is a simple indicator of skeletal-muscle consumption in stable COPD patients. In our study, we measured the widest part of the calf using an inelastic meter ruler and took the CC for data analysis. However, due to the limited accuracy of CC measurement, how to correctly measure this index and then accurately identify patients at high risk of skeletal-muscle consumption, as well as timely intervention to improve patient prognosis, are still the focus of future research.
In this study, we not only investigated skeletal-muscle atrophy in patients with stable COPD but also analyzed factors influencing skeletal-muscle mass. In addition, we explored the correlation between COPD anthropometric indicators and skeletal-muscle atrophy, validating the reliability of the former in predicting the latter. Our study will provide a simple, convenient method for screening skeletal-muscle atrophy in COPD patients, and we will apply this method clinically in the future to predict and take measures to delay skeletal-muscle atrophy at an early stage.
Limitations
The present study had some limitations. First, it included only a small number of patients treated at our hospital, which might reduce the generalizability of our findings to other populations. Second, only seven COPD patients were female, since skeletal-muscle atrophy is more likely to occur in female than in male patients. Third, factors associated with anthropometric indices and skeletal-muscle atrophy might be influenced by COPD severity. Future studies should reasonably match patients with acute exacerbations to other patients and identify optimal cutoff values of anthropometric indicators in patients of both sexes and with different COPD severities.
Conclusions
In conclusion, our results showed that anthropometric indices correlated closely with skeletal-muscle mass. Calf circumference, body mass index, midarm circumference, and triceps skinfold significantly affected fat-free mass index and appendicular skeletal-mass index. The diagnostic value of CC in skeletal-muscle atrophy was found to be much higher than that of upper-extremity–related circumference markers. CC might be a simple method for assessing skeletal-muscle atrophy in clinical practice. Stable COPD patients with noticeable reductions in FFM or ASM should be identified for early, multidisciplinary intervention.
Abbreviations
COPD, chronic obstructive pulmonary disease; BMI, body mass index; FEV1, forced expiratory volume in 1s; FVC, forced vital capacity; FFM, fat-free mass; FFMI, fat-free mass index; ASM, appendicular skeletal-muscle mass; ASMI, appendicular skeletal-muscle mass index; TSF, triceps skinfold; MAC, midarm circumference; CC, calf circumference; MAMC, midarm muscle circumference; MAMA, midarm muscle area; MMRC, modified Medical Research Council scale; GOLD, Global Initiative for Chronic Obstructive Lung Disease; ROC, receiver operating characteristic; AUC, area under the curve.
Data-Sharing Statement
Researchers may make reasonable requests of the corresponding author for datasets used in this study.
Ethical Approval
The study protocol was approved by the Ethics Committee of the First Affiliated Hospital of Soochow University, Suzhou, China. All patients provided written informed consent.
Consent to Publication
All authors agree to the publication of this study.
Acknowledgments
We thank LetPub for its linguistic assistance during the preparation of this manuscript.
Funding
This study was supported by the Suzhou Livelihood Science and Technology Project Fund (No. SYS 2020110), Natural Science Foundation of the First Affiliated Hospital of Soochow University (No. BXQN202116), National Natural Science Foundation of China (No.72204182) and the Nursing Society Talents “Seedling” Project Fund (No. SHQM202101).
Disclosure
The authors report no conflicts of interest in this work.
References
1. Vogelmeier CF, Criner GJ, Martinez FJ, et al. Global strategy for the diagnosis, management, and prevention of chronic obstructive lung disease 2017 report. GOLD executive summary. Am J Respir Crit Care Med. 2017;195(5):557–582. doi:10.1164/rccm.201701-0218PP
2. Gosker HR, Zeegers MP, Wouters EFM, Schols AMWJ. Muscle fibre type shifting in the vastus lateralis of patients with COPD is associated with disease severity: a systematic review and meta-analysis. Thorax. 2007;62(11):944–949. doi:10.1136/thx.2007.078980
3. Plataki M, Tzortzaki E, Rytila P, et al. Apoptotic mechanisms in the pathogenesis of COPD. Int J Chron Obstruct Pulmon Dis. 2006;1(2):161–171. doi:10.2147/copd.2006.1.2.161
4. Barker BL, McKenna S, Mistry V, et al. Systemic and pulmonary inflammation is independent of skeletal muscle changes in patients with chronic obstructive pulmonary disease. Int J Chron Obstruct Pulmon Dis. 2014;9:975–981. doi:10.2147/COPD.S63568
5. Schols AM, Broekhuizen R, Weling-Scheepers CA, et al. Body composition and mortality in chronic obstructive pulmonary disease. Am J Clin Nutr. 2005;82(1):53–59. doi:10.1093/ajcn.82.1.53
6. Vogiatzis I, Terzis G, Stratakos G. Effect of pulmonary rehabilitation on peripheral muscle fiber remodeling in patients with COPD in GOLD stages II to IV. Chest. 2011;140(3):744–752. doi:10.1378/chest.10-3058
7. Fouque D, Vennegoor M, Ter WP, et al. EBPG guideline on nutrition. Nephrol Dial Transplant. 2007;22(Suppl 2):ii45–ii87. doi:10.1093/ndt/gfm020
8. K/DOQI, National Kidney Foundation. Clinical practice guidelines for nutrition in chronic renal failure. Am J Kidney Dis. 2000;35(6Suppl 2):S17–S104. doi:10.1053/ajkd.2000.v35.aajkd03517
9. Tran D, D’Ambrosio P, Verrall CE, et al. Body composition in young adults living with a Fontan circulation: the myopenic profile. J Am Heart Assoc. 2020;9(8):e015639. doi:10.1161/JAHA.119.015639
10. Carrero JJ, Wanner C. Clinical monitoring of protein energy wasting in chronic kidney disease: moving from body size to body composition. J Ren Nutr. 2016;26(2):63–64. doi:10.1053/j.jrn.2016.01.014
11. Matkovic Z, Cvetko D, Rahelic D, et al. Nutritional status of patients with chronic obstructive pulmonary disease in relation to their physical performance. COPD. 2017;14(6):626–634. doi:10.1080/15412555.2017.1386643
12. Schols AM, Soeters PB, Dingemans AM, et al. Prevalence and characteristics of nutritional depletion in patients with stable COPD eligible for pulmonary rehabilitation. Am Rev Respir Dis. 1993;147(5):1151–1156. doi:10.1164/ajrccm/147.5.1151
13. Chen LK, Liu LK, Woo J, et al. Sarcopenia in Asia: consensus report of the Asian Working Group for Sarcopenia. J Am Med Dir Assoc. 2014;15(2):95–101. doi:10.1016/j.jamda.2013.11.025
14. Byun MK, Cho EN, Chang J, et al. Sarcopenia correlates with systemic inflammation in COPD. Int J Chron Obstruct Pulmon Dis. 2017;12:669–675. doi:10.2147/COPD.S130790
15. Travassos A, Rodrigues A, Furlanetto KC, et al. Fat-free mass depletion in patients with COPD in Brazil: development of a new cutoff point and its relation with mortality and extrapulmonary manifestations. Eur J Clin Nutr. 2017;71(11):1285–1290. doi:10.1038/ejcn.2017.105
16. Liu LK, Lee WJ, Liu CL, et al. Age-related skeletal muscle mass loss and physical performance in Taiwan: implications to diagnostic strategy of sarcopenia in Asia. Geriatr Gerontol Int. 2013;13(4):964–971. doi:10.1111/ggi.12040
17. Dennison EM, Sayer AA, Cooper C. Epidemiology of sarcopenia and insight into possible therapeutic targets. Nat Rev Rheumatol. 2017;13(6):340–347. doi:10.1038/nrrheum.2017.60
18. Buford TW, Cooke MB, Manini TM, et al. Effects of age and sedentary lifestyle on skeletal muscle NF-kappaB signaling in men. J Gerontol a Biol Sci Med Sci. 2010;65(5):532–537. doi:10.1093/gerona/glp196
19. Caram LM, Ferrari R, Bertani AL, et al. Smoking and early COPD as independent predictors of body composition, exercise capacity, and health status. PLoS One. 2016;11(10):e0164290. doi:10.1371/journal.pone.0164290
20. Patel MS, Lee J, Baz M, et al. Growth differentiation factor-15 is associated with muscle mass in chronic obstructive pulmonary disease and promotes muscle wasting in vivo. J Cachexia Sarcopenia Muscle. 2016;7(4):436–448. doi:10.1002/jcsm.12096
21. Ou YC, Chuang HH, Li WC, et al. Gender difference in the association between lower muscle mass and metabolic syndrome independent of insulin resistance in a middle-aged and elderly Taiwanese population. Arch Gerontol Geriatr. 2017;72:12–18. doi:10.1016/j.archger.2017.04.006
22. Budui SL, Rossi AP, Zamboni M. The pathogenetic bases of sarcopenia. Clin Cases Miner Bone Metab. 2015;12(1):22–26. doi:10.11138/ccmbm/2015.12.1.022
23. Awotidebe TO, Awopeju OF, Bisiriyu LA, et al. Relationships between respiratory parameters, exercise capacity and psychosocial factors in people with chronic obstructive pulmonary disease. Ann Phys Rehabil Med. 2017;60(6):387–392. doi:10.1016/j.rehab.2017.06.005
24. Strandkvist VJ, Backman H, Roding J, et al. Hand grip strength is associated with forced expiratory volume in 1 second among subjects with COPD: report from a population-based cohort study. Int J Chron Obstruct Pulmon Dis. 2016;11(1):2527–2534. doi:10.2147/COPD.S114154
25. Gosselink R, Troosters T, Decramer M. Peripheral muscle weakness contributes to exercise limitation in COPD. Am J Respir Crit Care Med. 1996;153(3):976–980. doi:10.1164/ajrccm.153.3.8630582
26. Maltais F, Decramer M, Casaburi R, et al. An official American Thoracic Society/European Respiratory Society statement: update on limb muscle dysfunction in chronic obstructive pulmonary disease. Am J Respir Crit Care Med. 2014;189(9):e15–e62. doi:10.1164/rccm.201402-0373ST
27. Shah S, Nahar P, Vaidya S, et al. Upper limb muscle strength & endurance in chronic obstructive pulmonary disease. Indian J Med Res. 2013;138(4):492–496.
28. Nyberg A, Tornberg A, Wadell K. Correlation between limb muscle endurance, strength, and functional capacity in people with chronic obstructive pulmonary disease. Physiother Can. 2016;68(1):46–53. doi:10.3138/ptc.2014-93
29. Bonnefoy M, Jauffret M, Kostka T, et al. Usefulness of calf circumference measurement in assessing the nutritional state of hospitalized elderly people. Gerontology. 2002;48(3):162–169. doi:10.1159/000052836
30. Izawa S, Enoki H, Hirakawa Y, et al. The longitudinal change in anthropometric measurements and the association with physical function decline in Japanese community-dwelling frail elderly. Br J Nutr. 2010;103(2):289–294. doi:10.1017/S0007114509991723
31. Kawakami R, Murakami H, Sanada K. Calf circumference as a surrogate marker of muscle mass for diagnosing sarcopenia in Japanese men and women. Geriatr Gerontol Int. 2015;15(8):969–976. doi:10.1111/ggi.12377
32. Real GG, Frühauf IR, Sedrez JHK, Dall’Aqua EJF, Gonzalez MC. Calf circumference: a marker of muscle mass as a predictor of hospital readmission. J Parenter Enteral Nutr. 2018;42(8):1272–1279. doi:10.1002/jpen.1170
33. Pagotto V, Santos KFD, Malaquias SG, Bachion MM, Silveira EA. Calf circumference: clinical validation for evaluation of muscle mass in the elderly. Rev Bras Enferm. 2018;71:322–328. doi:10.1590/0034-7167-2017-0121
 © 2022 The Author(s). This work is published and licensed by Dove Medical Press Limited. The full terms of this license are available at https://www.dovepress.com/terms.php and incorporate the Creative Commons Attribution - Non Commercial (unported, v3.0) License.
By accessing the work you hereby accept the Terms. Non-commercial uses of the work are permitted without any further permission from Dove Medical Press Limited, provided the work is properly attributed. For permission for commercial use of this work, please see paragraphs 4.2 and 5 of our Terms.
© 2022 The Author(s). This work is published and licensed by Dove Medical Press Limited. The full terms of this license are available at https://www.dovepress.com/terms.php and incorporate the Creative Commons Attribution - Non Commercial (unported, v3.0) License.
By accessing the work you hereby accept the Terms. Non-commercial uses of the work are permitted without any further permission from Dove Medical Press Limited, provided the work is properly attributed. For permission for commercial use of this work, please see paragraphs 4.2 and 5 of our Terms.