")
Back to Journals » Neuropsychiatric Disease and Treatment » Volume 16
Assessments of Amino Acids, Ammonia and Oxidative Stress Among Cohort of Egyptian Autistic Children: Correlations with Electroencephalogram and Disease Severity
Authors Saleem TH , Shehata GA, Toghan R, Sakhr HM , Bakri AH , Desoky T, Hamdan FRA , Mohamed NF, Hassan MH
Received 25 October 2019
Accepted for publication 19 December 2019
Published 6 January 2020 Volume 2020:16 Pages 11—24
DOI https://doi.org/10.2147/NDT.S233105
Checked for plagiarism Yes
Review by Single anonymous peer review
Peer reviewer comments 2
Editor who approved publication: Dr Roger Pinder
Tahia H Saleem, 1 Ghaydaa Ahmed Shehata, 2 Rana Toghan, 3 Hala M Sakhr, 4 Ali Helmi Bakri, 4 Tarek Desoky, 5 Fatma Rabea A Hamdan, 3 Nesma Foaud Mohamed, 6 Mohammed H Hassan 6
1Department of Medical Biochemistry, Faculty of Medicine, Assiut University, Assiut, Egypt; 2Department of Neuropsychiatry, Faculty of Medicine, Assiut University, Assiut, Egypt; 3Department of Medical Physiology, Faculty of Medicine, South Valley University, Qena, Egypt; 4Department of Pediatrics, Faculty of Medicine, South Valley University, Qena, Egypt; 5Department of Neuropsychiatry, Faculty of Medicine, South Valley University, Qena, Egypt; 6Department of Medical Biochemistry, Faculty of Medicine, South Valley University, Qena, Egypt
Correspondence: Mohammed H Hassan
Department of Medical Biochemistry, Faculty of Medicine, South Valley University, Qena, Egypt
Tel +201098473605
Email [email protected]
Objective: The current study aimed to assess the profiles of plasma amino acids, serum ammonia and oxidative stress status among autistic children in terms of electroencephalogram findings and clinical severity among the cohort of autistic Egyptian children.
Patients and methods: The present study included 118 Egyptian children categorized into 54 children with autism who were comparable with 64 healthy controls. Clinical assessments of cases were performed using CARS in addition to EEG records. Plasma amino acids were measured using high-performance liquid chromatography (HPLC), while, serum ammonia and oxidative stress markers were measured using colorimetric methods for all included children.
Results: The overall results revealed that 37.04% of cases had abnormal EEG findings. Amino acid profile in autistic children showed statistically significant lower levels of aspartic acid, glycine, β-alanine, tryptophan, lysine and proline amino acids with significantly higher asparagine amino acid derivative levels among autistic patients versus the control group (p˂0.05). There were significantly higher serum ammonia levels with significantly higher total oxidant status (TOS) and oxidative stress index (OSI) values among the included autistic children vs controls (p˂0.05). There were significantly negative correlations between CARS with aspartic acid (r=− 0.269, P=0.049), arginine (r= - 0.286, p= 0.036), and TAS (r= − 0.341, p= 0.012), and significantly positive correlations between CARS with TOS (r=0.360, p= 0.007) and OSI (r= 0.338, p= 0.013).
Conclusion: Dysregulated amino acid metabolism, high ammonia and oxidative stress were prevalent among autistic children and should be considered in autism management. Still EEG records were inconclusive among autistic children, although may be helpful in assessment autism severity.
Keywords: amino acid profiles, ammonia, oxidative stress, electroencephalogram, autism, CARS, Egyptian children
Corrigendum for this paper has been published
Introduction
Autism is a complex neurobiological disability, which is characterized by impairments in communication, defect in social interaction, repetitive behaviors, and sensory abnormalities,1–3 it affects more than 1% of children worldwide.4 Early diagnosis and behavioral intervention can effectively ameliorate the symptoms.5 Although its etiology is still unclear, some evidence suggesting genetic susceptibility and environmental factors in addition to oxidative stress, inflammation and immune dysregulation were implicated in autism pathogenesis.6
People with autistic disorders show abnormalities in the profile of some plasma amino acids,7,8 with some evidence suggesting that changes in the neuroactive amino acids were associated with the central brain functions may have a role in the pathogenesis and/or pharmacotherapy of several psychiatric disorders that have symptoms, such as cognitive impairment and problems with social interactions, in common with ASD.9,10
Ammonia (NH3) has long been known for its poisoning effect on the human central nervous system and may cause psychological disturbances and behavioral disorders, it exerts its neurotoxic effects by inducing astrocyte swelling and triggering a reaction cascade,11 which may result in irreversible brain damage.12 It is suggested that in patients with autism, the diseased intestines generate more ammonia than their impaired liver can clear at first pass, which enters the brain.13 Exposure to a high level of NH3 can alter multiple amino acid pathways and neurotransmitter systems, cerebral energy metabolism, nitric oxide synthesis, oxidative stress, and signal transduction pathways in the brain.14
Oxidative damage in humans is thought to contribute to some neurological15 and mental disorders15,16 and suggested that oxidative stress may have a role in the pathophysiology underlying the behaviors that define autism.17
Despite the widely extensive research and using several neuroimaging and neurophysiological techniques to understand the correlation between brain functionality and autistic behavior,18 still, there is much conflict and debates about the morphological, functional, and neuropsychological characteristics of the autistic brain, with the neural basis of altered behaviors in ASD remains largely unclear.19 Electroencephalography (EEG) is a powerful method for studying the complex neuropsychiatric disorders,20 it identifies epileptiform and abnormal paroxysmal activity by detecting focal spikes, which occur with increased frequency with autism.21,22 In view of metabolic abnormalities being prevalent in autism and paucity of substantial studies from Egypt, the current study aimed to investigate the blood ammonia and oxidative stress markers among autistic children with the possible identification of autism-specific amino acid profile and compare these biochemical parameters with the observed EEG findings in such children which provide a better understanding of the metabolic basis for autism and may be helpful if targeted in autism management.
Patients and Methods
Participants and Study Design
A cross-sectional cohort, a hospital-based study has been conducted on 54 children who were newly diagnosed having autism, during the study period from June 2018 to July 2019. They were recruited from the Pediatrics and Psychiatry Departments of Qena University Hospitals, Egypt. In addition to 64 unrelated healthy, age, sex and body mass index-matched children, were selected from attendants to the Pediatric clinics for routine care and serve as a control group. Informed written consent was taken from the caregivers to carry out this research. The study has been approved by the Ethics Committee of Faculty of Medicine, South Valley University, Egypt, and was conducted in accordance with The Code of Ethics of The World Medical Association (Declaration of Helsinki) for experiments in humans. Children suffering from inflammatory, endocrine, neurological, or any significant chronic disease or receiving chronic medications especially drugs with known or potentially interact with the plasma amino acids or chromosomal anomalies or phenylketonuria or any other classical aminoacidopathies,23 all were excluded from the study.
Data Collections
Clinical Evaluation of the Included Patients
All patients were subjected to a thorough clinical history, including developmental history and a detailed history of the presenting symptoms. Individual interviews with every included child and his/her parents were conducted to clinically assess the severity of their autistic symptomatology using the Childhood Autism Rating Scale (CARS) as described in previously published works24,25 with total scores of 30 or above strongly suggest autism diagnosis, 30–36 have mild to moderate autism, 37–60 suggest severe autism.26 The questionnaires were administrated by two well-trained and experienced clinical psychologists.
Electroencephalogram Recording
EEG recording was done under an eyes-opened resting condition for 10 mins with the children seated on a comfortable chair. A Nihon Kohden 8-channel conventional EEG machine (NIHON KOHDEN – MEB-9400) was used by the use of a 10–-20 international electrode placement system for 20–30 mins and unipolar and bipolar montages. Electrode gel was applied on the site of each electrode. Electrode–skin impedance was kept below 5 kΩ. All measurements were taken referentially with linked ears. After completion of the testing, all of the EEG data were analyzed to reject artifacts such as blinks, eye movements, or muscle activity. A minimum of 75 s of artifact-free EEG was available for analysis. After the elimination and removal of artifacts, the record was divided into 4-s epochs, which were subjected to Fourier power spectral analysis, to determine the magnitude of each frequency band in microvolt.
Blood Samples and Biochemical Analyses
The blood samples were obtained immediately after the initial diagnosis, thus ensure that the included autistic children were not on any special diet during the analysis time. Additionally, fasting blood samples were collected to minimize the dietary influence on the analysis. Six milliliters of antecubital venous blood samples were collected from the included children and divided into two parts. Three milliliters of blood were withdrawn in a heparinized tube, mixed and centrifuged at 3000 rpm for 15 mins.
The separated plasma from each tube was separated immediately, using 1 mL cryotubes and stored at −80°C for later analyses of plasma amino acids. The remaining 3 mL was evacuated into a serum separator gel tube and allowed to clot for 30 mins at 37°C before centrifugation and the sera separated by centrifugation were aliquoted into 1-mL cryotubes and stored at −80°C until the biochemical analyses of oxidative stress markers and ammonia.
The assays were performed by using an automatic amino acid analyzer S433 (Sykam GmbH, Germany, Catalog No. 1120001). This analyzer combines the classical method of ion exchange separation (with derivatization using ninhydrin) with the modern technique of high liquid chromatography.27 The ready-to-use ninhydrin reagent (catalog no. S000025) and citrate buffers in various pH (8.0, 4.2, 2.9) were used. The samples which used for assays of the amino acids were prepared by acidic precipitation of proteins where 200 μL of 10% sulfosalicylic acid solution was mixed with 800 μL plasma then mixed and left for 30 min and was centrifuged at 14,000 rpm for 10 min. The separated supernatant was diluted using equal volume from ready to use sample dilution buffer (catalog no. S000015). From every prepared sample and from a ready to use amino acid physiological standard (catalog no. 6006005), 100μL was injected into the chromatography. A cation separation column was used (LCAK06/Na, catalog no. 5112007, size 150 mm × 4.6 mm, pressure 40–75 bar). The chromatogram of every sample was compared with the standard assays to obtain the concentrations of various plasma amino acids that were multiplied by 2.5 (dilution factor).
These assays were performed by spectrophotometric methods (Chem-7, Erba Diagnostics Mannheim GmbH, Germany) using commercially available colorimetric assay kits and according to the manufacturer’s instructions. Serum ammonia, total antioxidant status (TAS) (both supplied by Biodiagnostics, Egypt), and total oxidant status (TOS) (supplied by ABC diagnostics, Egypt). Calculation of the oxidative stress index was done by dividing TAS by TOS.24,28
Statistical Analysis
Data were analyzed using IBM SPSS Statistics for Windows version 20.0 (Armonk, NY: IBM Corp) and the data were tested for normality using Kolmogorov–Smirnov and Shapiro–Wilk tests. Qualitative data were presented as a number, percentage. Quantitative data were expressed as mean and standard deviation (if were parametric data), median and inter-quartile range (for non-parametric data). Chi-square test (χ2) was used to study comparison and association between two qualitative variables. The student’s t-test was used for comparison between two groups having quantitative variables with a normal distribution (parametric data). Mann–Whitney U-test was used for comparison between two groups having abnormally distributed quantitative variables (none-parametric data). Kruskal–Wallis test (nonparametric test) was used for comparison between three or more groups not normally distributed having quantitative variables. ANOVA (f) test was used for comparison between three or more groups having quantitative variables that normally distributed. Spearman correlation was done to measure the correlation between quantitative variables in the case of non-parametric data. A two-tailed test was considered significant when P was ˂ 0.05.
Results
Demographic and Clinical Data of the Included Children with Autism
The current study included 54 children with autism with their mean age 5.74years ± 2.63SD; 46 males (85.2%) and 8 females (14.8%) with male to female ratio 5.75:1, they were compared to 64 healthy age- and sex-matched children as a control group with their mean age was 5.42years ± 1.737 SD; 49 males (76.6%) and 15 females (23.4%). There was no significant difference between the two groups as regard age and sex (p˃0.05), indicating age and sex matching. Additionally, patients were divided into two subgroups according to the severity assessment; group-I included 18 patients with severe ASD (autism spectrum disorder) and 36 patients with mild to moderate ASD (group-II). There were no significant differences between the two subgroups as regard age, sex, age of presentation, and history of parental consanguinity (Table 1). There was a significantly higher frequency percentage of abnormal behavior, a deficit in social interaction, and developmental delay among severe autistic children in comparison to those having mild to moderate degrees of autism (p˂0.05) (Table 2).
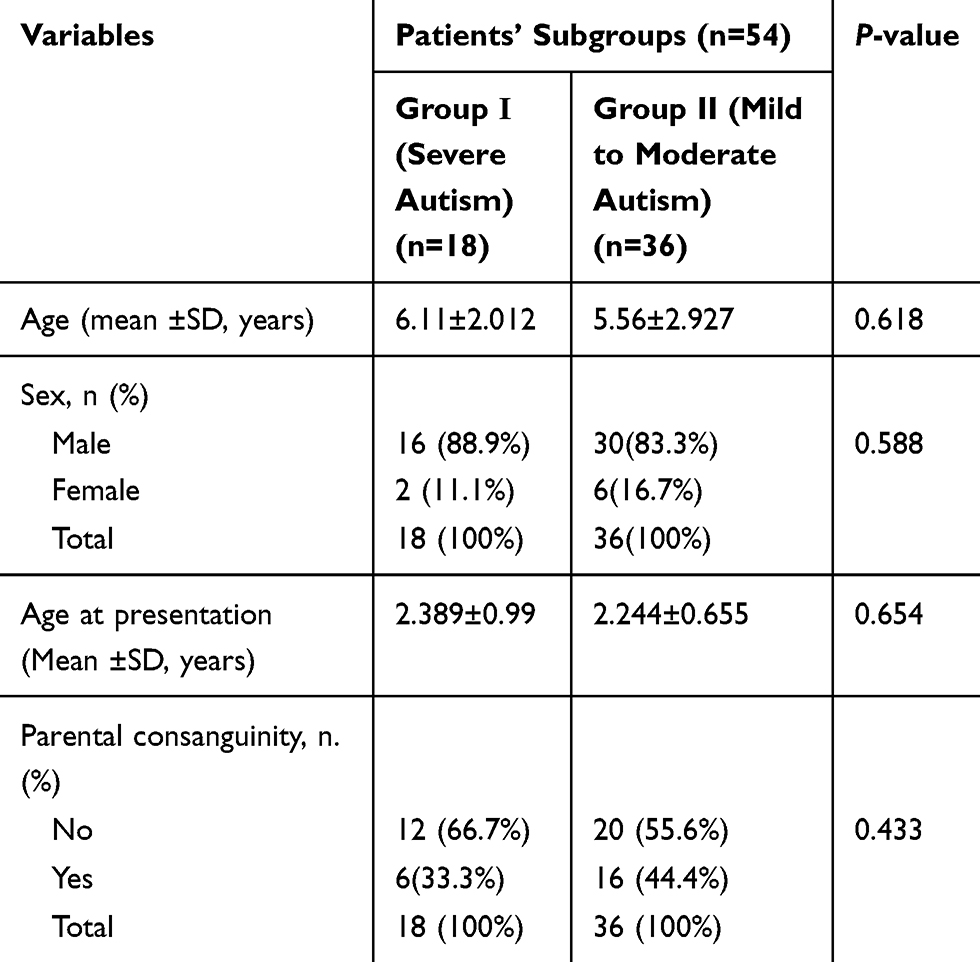 |
Table 1 Demographic Data of the Patients’ Subgroups According to Autism Severity |
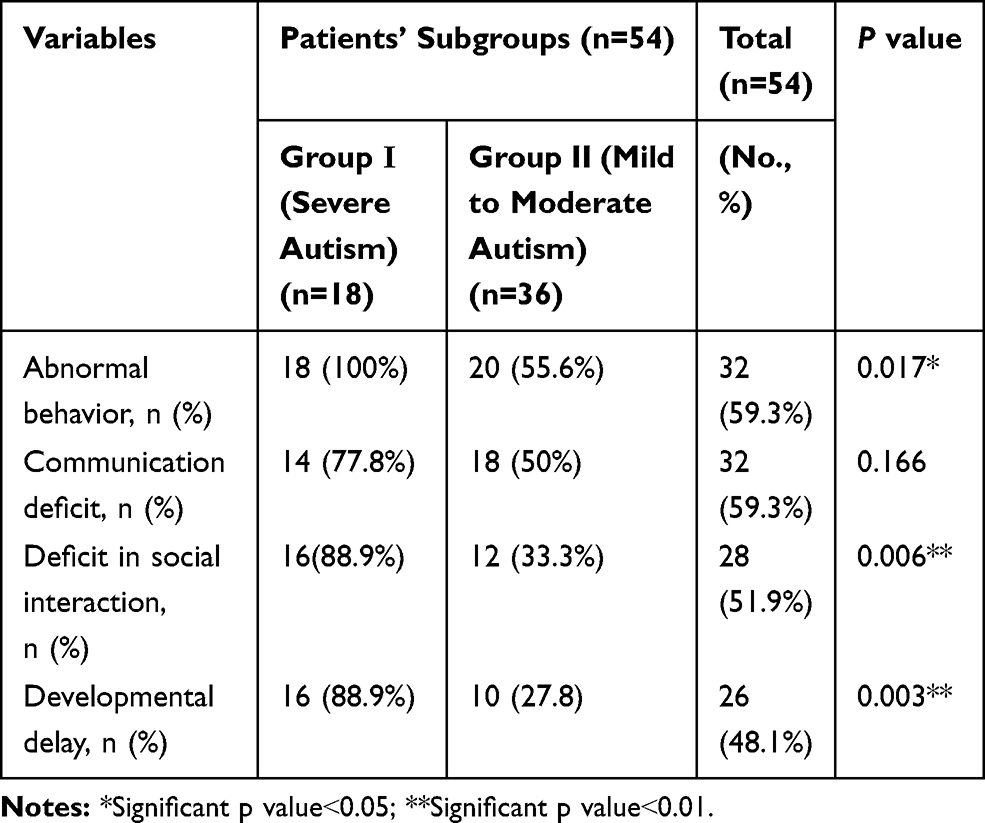 |
Table 2 Clinical Data of the Included Autistic Children in Terms of Autism Severity |
Patterns of EEG Findings Among Autistic Children
Records of EEG of autistic children showed that 34 patients (62.96%) had normal EEG and 20 patients (37.04%) had abnormal EEG findings. About two-thirds of cases with abnormal EEG were mild to moderate in severity and they represented (25.93%) of total ASD children. On the other hand, the remaining one-third of the cases with abnormal EEG was severing in the severity of ASD and they represented (11.1%) of total ASD children. All control cases had normal EEG. Regarding EEG discharge in autistic children (62.96%) had normal discharge (25.93%) had generalized epileptic discharge (7.4%) had multifocal discharge and (3.7%) had focal discharge severity. The majority of cases with generalized Epileptic Discharge were mild to moderate in severity. There was a significant difference in background activity between mild and moderate cases (slow-wave in 8 cases, 14.8%) versus sever cases (slow-wave in 12 cases, 22.2%) (p˂0.05). According to background organization, 92.6% of cases had organized background and just (7.4%) of autistic children had a disorganized background, who were mild to moderate in the severity of ASD (Table 3).
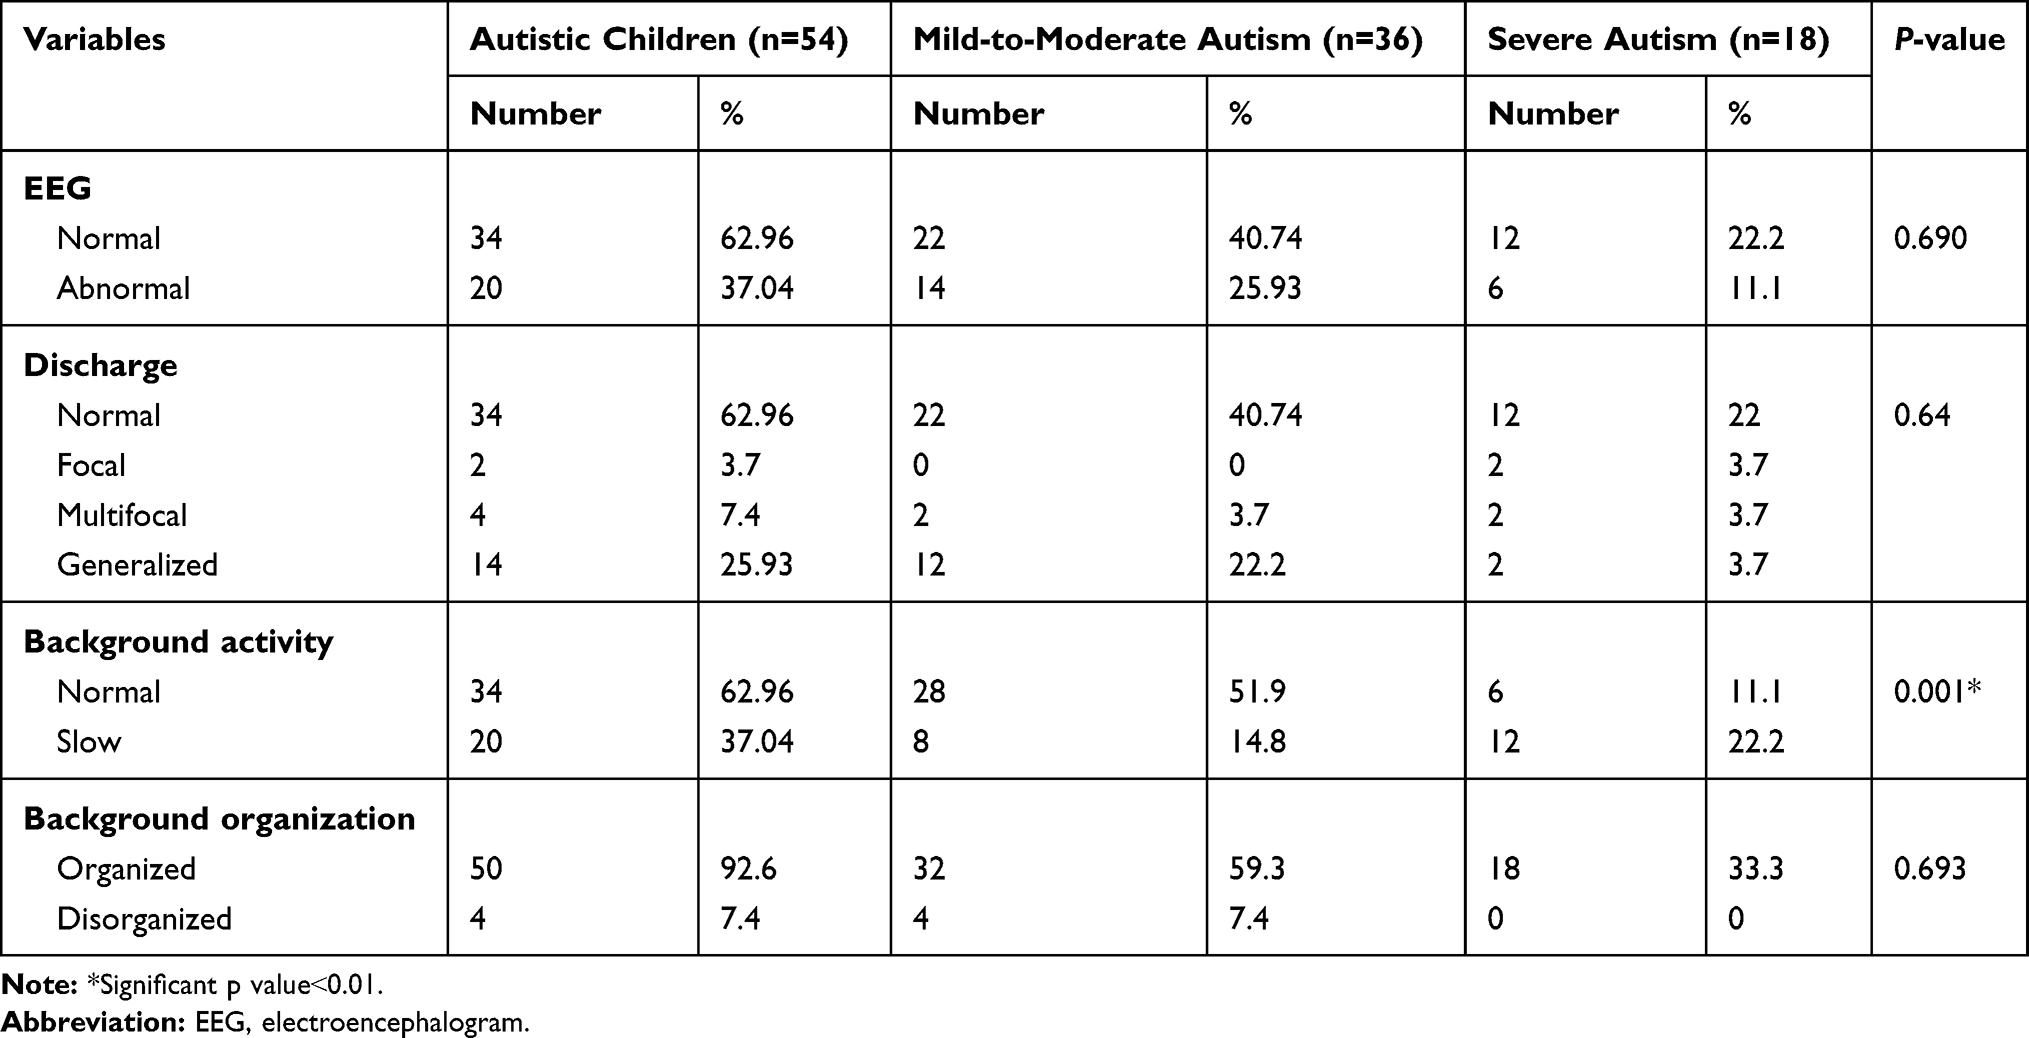 |
Table 3 Patterns of EEG Records Among the Included Autistic Children |
Profiles of Plasma Amino Acids and Some of Their Derivatives Among the Study Groups
Amino acid profile in autistic children showed statistically significant lower levels of aspartic acid, glycine, β-alanine, tryptophan, lysine and proline amino acids when compared with the control group with their ranges and median values as follows: aspartic acid (range 11.71–19.34μmol/l and median 15.94μmol/l versus range 9.171–19.343μmol/l and median 15.94μmol/l in the controls), glycine (range 0.01–178.94μmol/l and median 0.01μmol/l versus range 0.01–230.756μmol/l and median 223.75μmol/l among the controls), β-alanine (range: 0.01–66.894μmol/l and median 62.85μmol/l versus range 0.01–111.570μmol/l and median 66.89μmol/l in the controls), tryptophan (range: 0.01–0.05 and median: 0.01μmol/l versus range 0.01–123.31μmol/l and median 0.01μmol/l in control), lysine (range: 125.10–219.56μmol/l and median159.31μmol/l versus range 64.232–323.828μmol/l and median 162.53μmol/l in controls) and proline (range: 0.01–0.08 and median: 0.01μmol/l in patients versus range 0.01–0.601 and median 0.01μmol/l in controls). (Table 4). On the other hand, there were significantly higher asparagine amino acid derivative levels among autistic patients versus the control group (range 184.51–311.95 and median 294.21μmol/l versus range 184.512–301.72 and median 216.93μmol/l in controls) (p˂0.05), with non-significant differences regarding the plasma levels of other amino acids or their derivatives [taurine, threonine, serine, alanine, citrulline, α-aminobutyric acid, branched-chain amino acids in the form of leucine, isoleucine and valine, cysteine, methionine, tyrosine, phenylalanine, GABA (γ-aminobutyric acid), histidine, ornithine, arginine, and hydroxyproline] (p˃0.05) (Table 4).
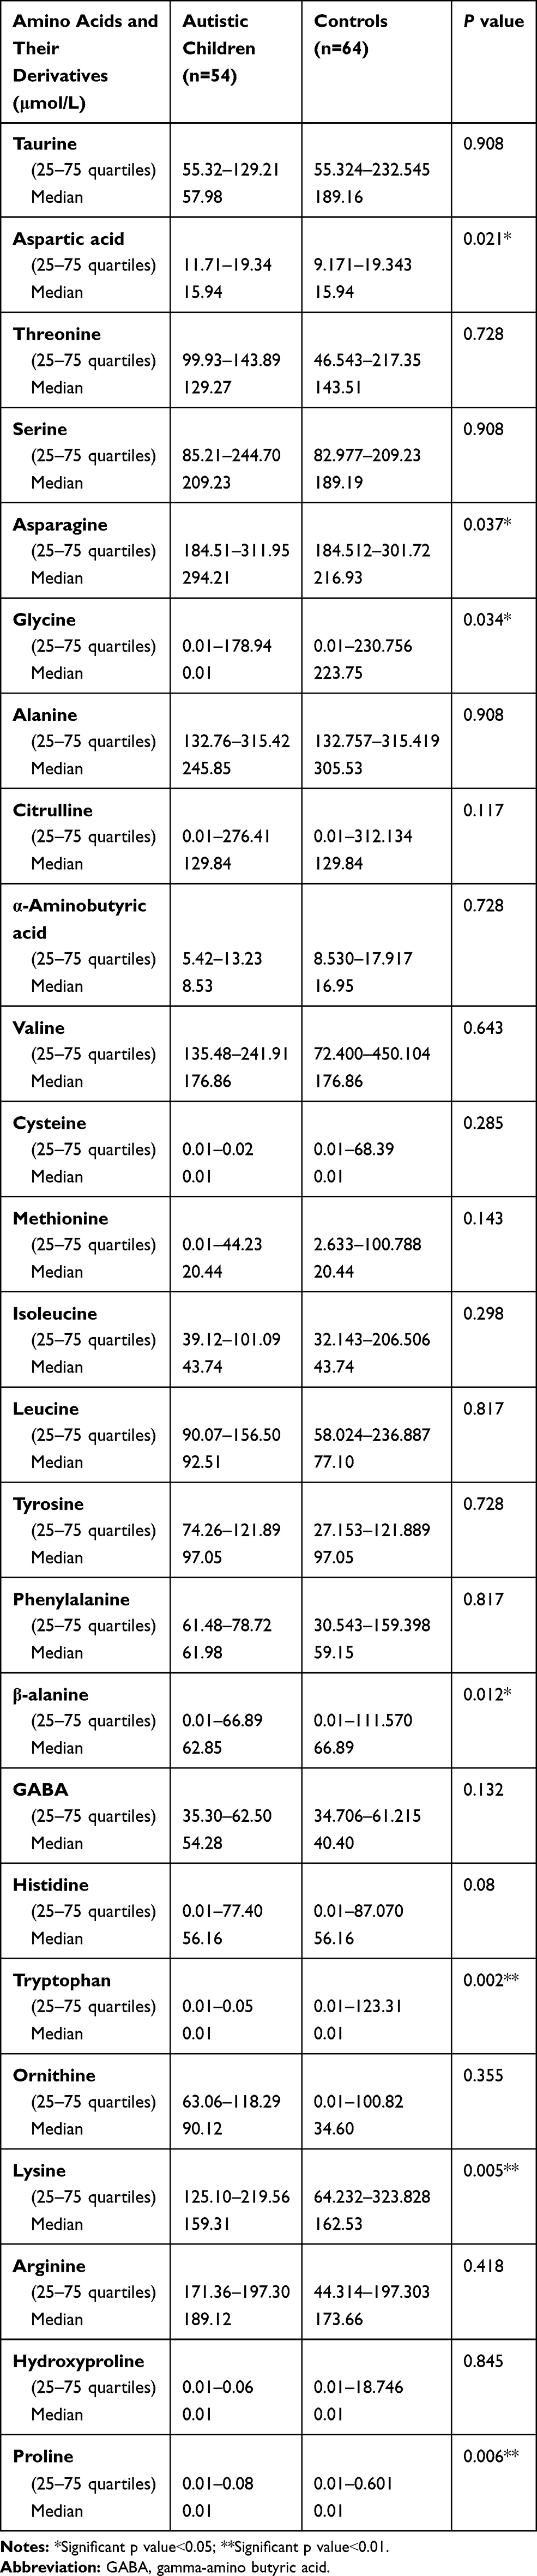 |
Table 4 Comparison Between Patients and Control as Regards Plasma Levels of Amino Acids and Some of Their Derivatives |
Serum Ammonia and Oxidative Stress Status Among the Study Groups
There were significantly higher serum ammonia levels among the included autistic children (range 171.36–200.28μg/dl and median 189.12 μg/dl) versus the control group (range 123.86–197.3μg/dl and median 134.51 μg/dl) with significantly higher total oxidant status (TOS) and oxidative stress index (OSI) values in patients (range: 0.01–0.05mmol/l, 0.36–2.34, respectively, and median 0.02 mmol/l and 1.22, respectively) versus the control group (range 0.0059–0.087mmol/l, 0.265–4.162, respectively, and median 0.02 mmol/l and 1.17, respectively) (p˂0.05) (Table 5). There were non-significant differences in the total antioxidant status (TAS) between the included patients and the controls (p˃0.05) (Table 5).
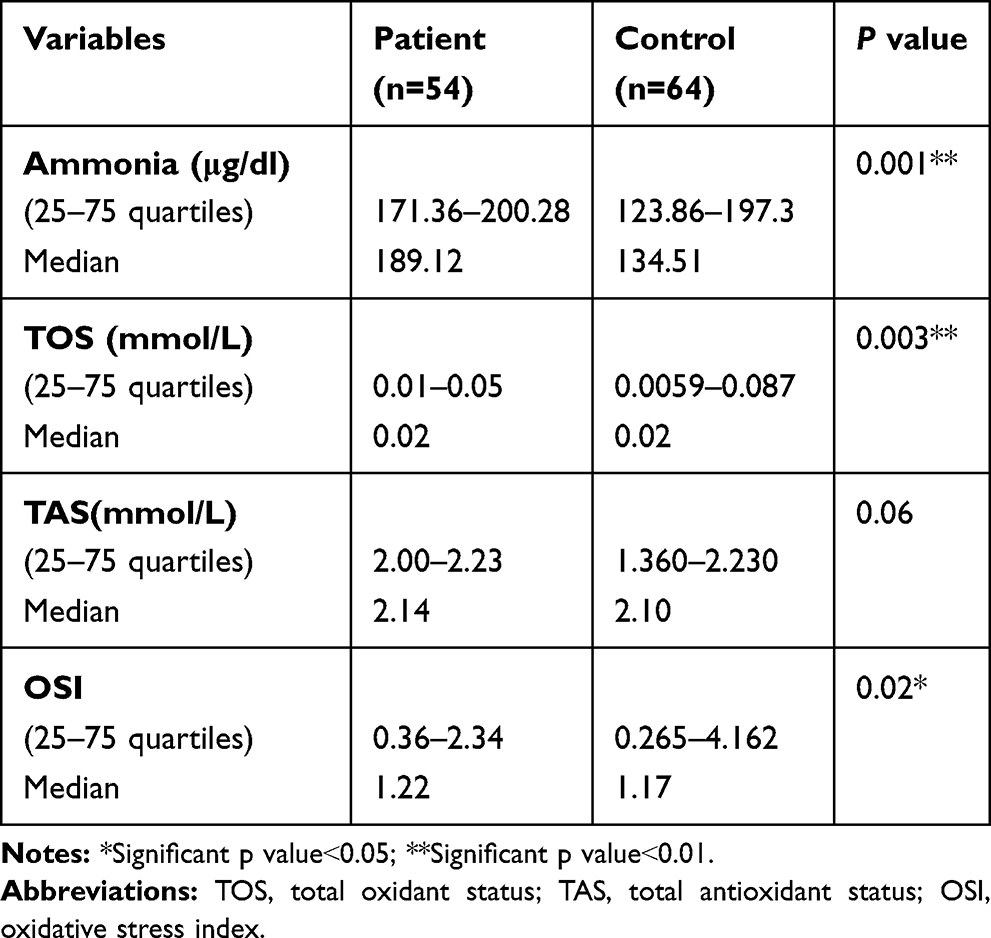 |
Table 5 Comparison Between Patients and Control as Regards Serum Levels of Oxidative Stress Markers and Ammonia |
Profiles of Plasma Amino Acids Among Autistic Children in Terms of EEG Normality
Autistic children with abnormal EEG records exhibited significantly lower amino acid levels in comparison with those having normal EEG in the following amino acids; Threonine (range 99.930–113.189μmol/land median 106.560μmol/l versus range 85.255–164.729μmol/l and median 159.110μmol/l), glycine (range0.01–0.09 μmol/l and median 0.01μmol/l versus range 149.604–327.177 μmol/l and median 256.251μmol/l), histidine (range 0.01–0.03μmol/l and median 0.01μmol/l versus range 58.457–92.995μmol/l and median 59.636μmol/l), ornithine (range90.115–118.294μmol/l and median 95.471μmol/l versus range 70.908–126.606μmol/l and median 92.231μmol/l), lysine (range125.098–150.810μmol/l and median 137.954μmol/l versus range 277.230–337.526μmol/l and median 310.852μmol/l), and the amino acids derivative α-aminobutyric acid (range5.412–5.421μmol/l and median 5.417μmol/l versus range 6.616–9.485μmol/l and median 7.546μmol/l) (p˂0.05) (Table 6). Additionally, there were significantly higher arginine levels in autistic children with normal EEG versus autistic children with abnormal EEG records (range 125.098–150.810μmol/l and median 137.954μmol/l versus range 277.230–337.526μmol/l and median 310.852μmol/l) (p˂0.05) and significantly higher asparagine among autistic children with abnormal EEG records than those with normal EEG (range10.01–294.212μmol/l and median 108.465μmol/l versus range 283.513–395.492μmol/l and median 335.584μmol/l), with non-significant differences regarding the plasma levels of other amino acids or their derivatives (p˃0.05) (Table 6).
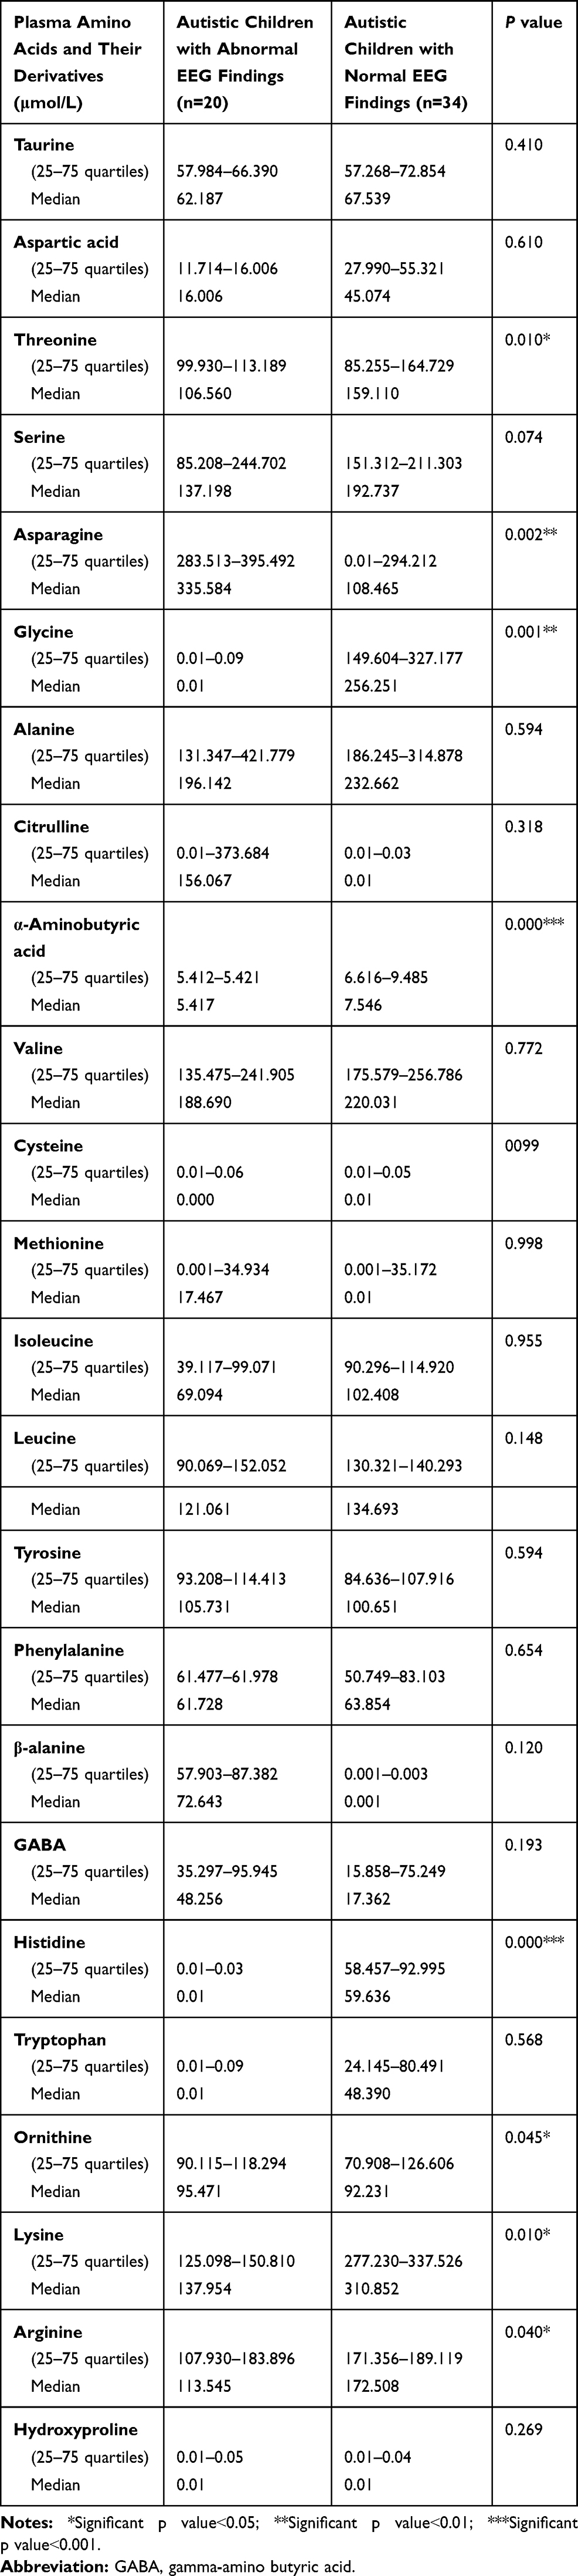 |
Table 6 Comparison Between the Plasma Amino Acids and Their Derivatives in Terms of EEG Records Among the Included Autistic Children |
Serum Ammonia and Oxidative Stress Markers Among Autistic Children in Terms of EEG Findings
Serum ammonia levels were significantly higher among children with abnormal EEG versus children with normal EEG (range171.356–189.119μg/dl and median 171.356μg/dl versus range 22.750–37.660μg/dl and median 27.210μg/dl, respectively) (p˂0.05) (Table 7), with non-significant differences regarding the oxidative stress markers (TOS, TAS, and OSI) (p˃0.05) (Table 7).
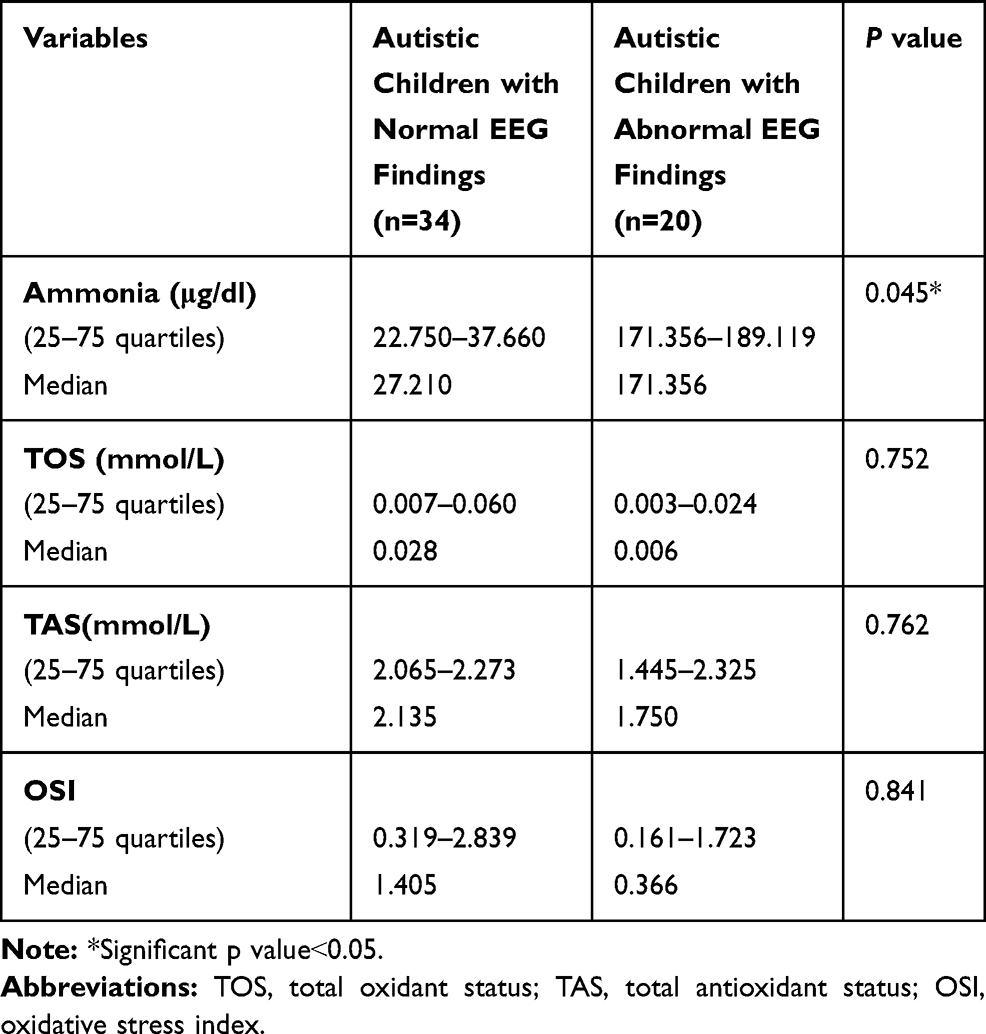 |
Table 7 Comparison Between the Serum Ammonia Levels and the Oxidative Stress Markers Among the Included Autistic Children in Terms of EEG Records |
Correlations Between the Studied Biochemical Markers with CARS Among Autistic Children
There were significantly negative correlations between CARS with aspartic acid (r=−0.269, P=0.049), arginine (r= - 0.286, p= 0.036) (Figure 1A and B) and TAS (r= −0.341, p= 0.012) (Figure 2C), and significantly positive correlations between CARS with TOS (r=0.360, p= 0.007) and OSI (r= 0.338, p= 0.013) (Figure 2A and B). Non-significant correlations could be found between CARS with the other plasma amino acid levels or serum ammonia.
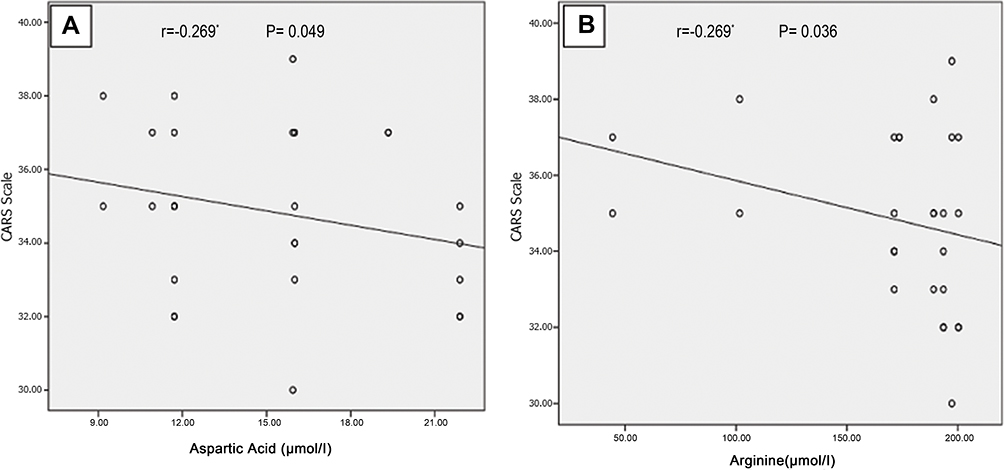 |
Figure 1 Negative correlations between CARS with both plasma aspartic acid (A) and arginine (B) among autistic children. *Indicate statistically significant correlation (p˂0.05). Abbreviation: CARS, Childhood Autism Rating Scale. |
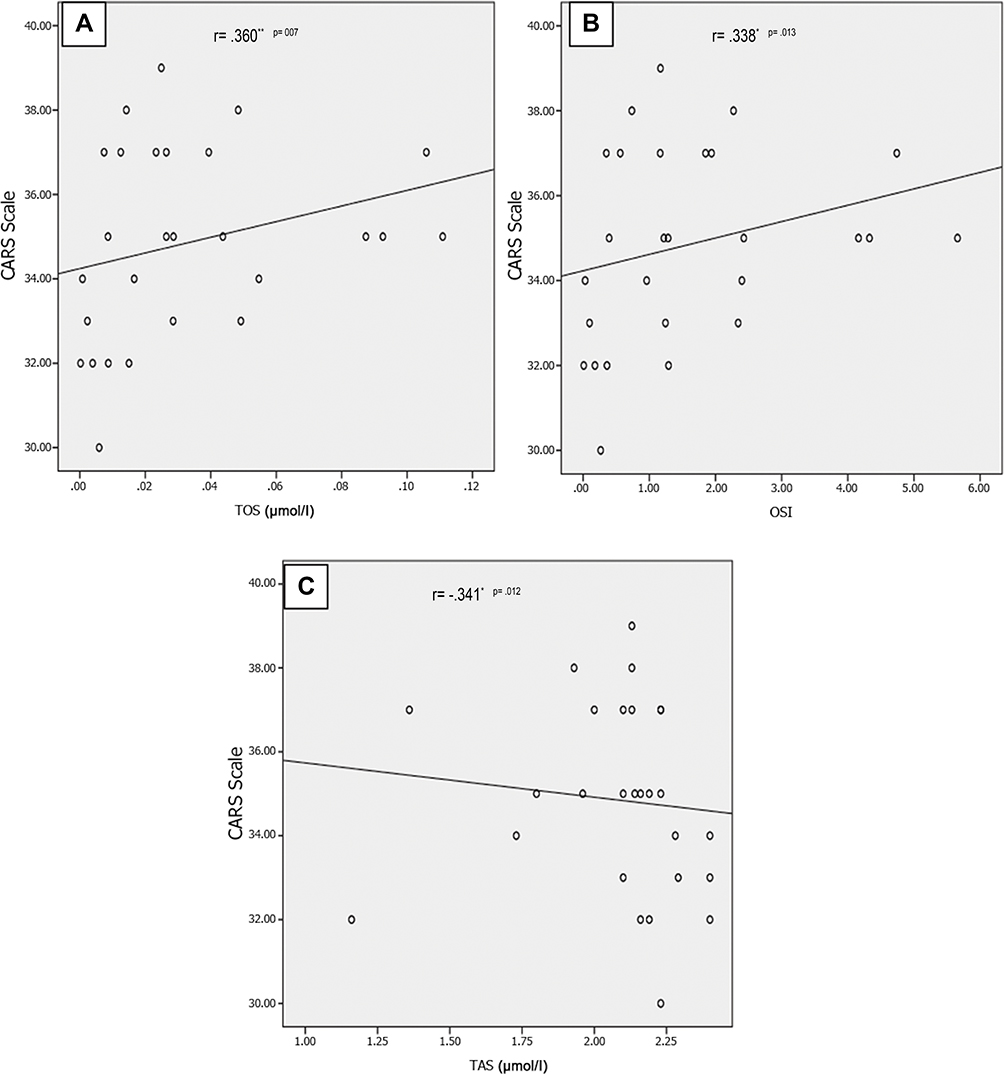 |
Figure 2 Positive correlations between CARS scale with both TOS (A) and OSI (B) and negative correlation between CARS scale and TAS (C) among autistic children. *indicate statistically significant correlation (p˂0.05), **indicate statistically significant correlation (p˂0.01). Abbreviation: CARS, Childhood Autism Rating Scale. |
Discussion
Recently a dramatic increase in the number of reported cases of ASD was observed, which may be attributable to changes in age at diagnosis, diagnostic practices, availability of services, referral patterns, and public awareness.29
Many studies have reported an association between testosterone levels and autism features.24,30,31 Our study data revealed a higher frequency percent of ASD diagnosis among males with a male to female ratio 5.75:1. In an agreement,32 it was found that 461 children (81%) out of 564 participants were male autistic children. Additionally, Shu et al33 noticed that autism was more than twice as common in boys as girls and this ratio increases to 5:1. A study by Liu et al34 reported 10:1 of male: female ratio. Center for Disease Control35 reported that ASD diagnostic estimates are stratified by gender, approximately 1 in 70 boys are diagnosed with ASD, while only 1 in 315 girls are diagnosed with ASD.
EEG is widely used to investigate brain functions in healthy individuals and in those with medical and psychiatric problems,22 it is frequently recorded in patients with autism despite the absence of seizures and multiple case reports have described an association of abnormal EEG findings within autistic individuals.36,37 In our study, we identified a statistically significant difference between the autistic and the control group as regards the EEG abnormalities, as there was a high rate of subclinical epileptiform abnormalities in autistic children. This epileptiform activity can be associated with impaired alertness, attention, and expressive communication.38 In agreement with the current study, Hrdlicka et al39 reported the same rate (38%) of their studied sample (63) children with EEG abnormalities, also a study by Tamarah et al40 for the screening of EEG in ASD (1986–2005) indicated that the prevalence of EEG abnormalities irrespective of clinical seizure history was 38.3–60.8%. Also, Chez et al,36 in a screening of 1268 ASD children between 1996 and 2005, found that 64.7% had EEG abnormalities. This may be particularly attributed to the differences in the type of EEG recording routine; awake EEG was used in their studies, whereas in the present study sedation and induced sleep EEG was used. Additionally, Elhabashy et al and Azouz et al41,42 reported that children with ASD have quantitative EEG abnormalities that underlie their symptomatology and suggesting neural connectivity abnormalities may be a major deficit leading to the symptoms of ASD. Paula et al43 reported that ASD presented a stronger power spectrum in higher frequencies than the control group for some brain areas and differences were more evident in the occipital and interparietal regions.
We found that there was a statistically significant difference between the studied autistic children as regards the background activity of EEG, as 37.04% of the studied cases have a slow background activity with significantly higher frequency percent among sever cases in comparison to those having mild to moderate severity. This was in concordance with Fauzana and Amran study,44 who recorded an EEG slow activity in studied ASD children and suggested that this activity was responsible for the associated social impairments among those children. Additionally, Yousef et al45 reported a significant relationship between the EEG abnormalities and autism severity and concluded that the severity of autistic symptom may be related to an underlying neurological basis in the form of changes and alteration in cortical excitability of varying degrees in patients with ASD and few of these affected patients may have neuronal hyperactivity.46 In the current study, we found non-significant differences in the EEG findings and autism severity as assessed by CARS in the studied children with ASD in terms of the frequency of EEG abnormalities, type of discharge and background organization. As the normal interictal EEG does not exclude a clinical diagnosis of epilepsy and surface-based scalp EEG is not completely presentative for the whole entire brain as many deep-seated cortical gyri are unable to be detected without intracranial electrodes placed directly over the underlying cortex.47
Amino acids have an important role in cell metabolism, cell signaling, neurotransmission, and in the regulation of the immune system.48 Researches investigating the sufficiency of the large neutral amino acids, which serve as precursors for the central nervous system (CNS) neurotransmitters among autism, are essential.49 The results reported in the literature regarding the plasma amino acid levels among autistic children are generally inconclusive and contradictory.50
Plasma tryptophan levels have been reported to be decreased in ASD,7,8 our study findings revealed significantly deficient some essential amino acids among the included autistic children when compared with the controls (tryptophan and lysine) which were in agreement with Arnold et al49 and Bugajska et al51 suggesting poor protein nutrition among such children due to unusual food preferences. Naushad et al23 reported the presence of tryptophan depletion among autistic children with low tryptophan levels largely contributing to behavioral deterioration52 and increasing tryptophan in the diet has been reported to improve social behavior. Tryptophan is the precursor of serotonin which is an important neurotransmitter.53 Dysfunction of serotonin systems is implicated in some forms of ASD and may contribute to social interaction impairments.54 Liu et al34 found that concentrations of lysine were significantly lower in urine samples from ASD children than controls. Lysine indirectly via Kreb’s cycle helps the formation of α-ketoglutaric acid and then glutamate via 5-aminovalerate transaminase, so the abnormal lysine metabolism in children with ASD could indirectly lead to an imbalance in concentrations of the excitatory amino acid glutamate.
Additionally, our study results revealed a deficiency in some non-essential amino acids among autistic children when compared with the controls in the form of glycine, β-alanine, and proline amino acids and some amino acid derivatives in the form of phosphoserine. These amino acid deficiencies may be related to poor nutritional states secondary to unusual food preferences and desire in children with autism that is often taste- or texture-based. Protein digestive capacity may be also impaired in some children with ASD,55 which would contribute to the abnormal amino acid profile in their plasma.
Glycine is one of the major central nervous system (CNS) inhibitory neurotransmitters,56 but in early development, it depolarizes the membrane potentials and acting as an excitatory neurotransmitter57 with shifting from excitatory to inhibitory neurotransmitters at birth and in maturation. If that does not happen it may result in neurological disorders, including ASD.58
β-alanine is essential for the formation of carnosine and anserine, both are functionally similar and act as antioxidants by capturing oxygen-free radicals.34 So β-alanine deficiency among autistic children reported in the current study results in a reduction in their antioxidant capacity with the occurrence of oxidative stress status has been confirmed also in the current study.
Arginine is an essential precursor for the synthesis of proteins and nitric oxide, and it can spare glutamine, detoxify ammonia and increase brain blood flow.59 Our study results revealed a significant negative correlation between plasma arginine levels and CARS.
Additionally, there were significantly lower plasma aspartic acid levels with significantly higher plasma asparagine levels with a significantly negative correlation between plasma aspartic acid levels and CARS. In accordance, a study by Rolf et al61 reported decreased plasma aspartic in autistic children. Liu et al34 reported significantly lower urinary aspartic acid levels among autistic children when compared with the healthy controls. Aldred et al60 and Naushad et al23 reported significantly raised asparagine in the plasma of autistic children. Our findings were contradicted by Morena-Fuenmayor et al,62 who noted increased plasma levels of aspartic acids in children with autism and Arnold et al49 found no significant differences in aspartic acid plasma levels between autistic children and healthy controls. These variabilities among the previous studies could be explained by the differences in study groups in terms of age, gender, number of subjects, intelligence quotient, dietary habits.
Branched-chain amino acids (BCAAs) as Leucine, isoleucine and valine are sharing a transport system with large neutral amino acids (LNAAs), such as tryptophan, tyrosine, and phenylalanine which are the precursors of the neurotransmitter amines 5-hydroxytryptamine (5-HT, serotonin) and the catecholamines.63 Our findings revealed non-significant differences in the plasma levels of branched-chain amino acids among autistic children when compared with the controls. These findings were in agreement with Aldred et al.60
Our findings revealed non-significant differences in the plasma levels of other amino acids or their derivatives (taurine, threonine, serine, alanine, citrulline, α-aminobutyric acid, cysteine, methionine, tyrosine, phenylalanine, GABA (γ-aminobutyric acid), histidine, ornithine, arginine, and hydroxyproline among autistic children vs the controls). In line with our findings, Aldred et al60 and Shinohe et al64 reported non-significant differences regarding serine amino acid; Aldred et al60 and Tirouvanziam et al7 reported non-significant differences regarding alanine amino acids. Aldred et al60 reported non-significant differences as regards threonine, taurine, histidine, serine or cysteine among autistic children when compared with the controls.
No previous studies in the literature have reported the differences in the plasma amino acid levels in terms of EEG records among autistic children. In the current study, there were significantly lower plasma levels of threonine, glycine, histidine, ornithine, lysine, α-aminobutyric acid and arginine among autistic children having abnormal EEG versus those with normal EEG records with significantly higher plasma asparagine levels among autistic children having abnormal EEG vs those with normal EEG records. This could be explained by the possible neurogenic effects of such amino acids on brain electricity.
The present study revealed significantly higher serum ammonia levels among autistic children in comparison to healthy controls and significantly higher ammonia levels among autistic children having abnormal EEG versus those having normal EEG. In line with our findings, Abu Shmais et al65 in a study of Saudi autistic children found increased levels of ammonia. Additionally, Hassan et al24 reported high blood ammonia among the included autistic children.
Oxidative stress has been accused as a contributory factor in ASD development.66,67 Our findings showed significant higher TOS and OSI levels among autistic children with significantly positive correlations between both oxidative stress markers with CARS and a significant negative correlation of CARS with TAO, but we did not notice significant differences in the serum levels of oxidative stress markers among the included autistic children in terms of EEG findings. This comes in line with Hassan et al,24 who reported the presence of unbalanced redox homeostasis with significantly higher serum TOS and OSI among autistic children with a significant positive correlation between CARS and oxidative stress in their study.
Conclusions
EEG abnormalities could be helpful in the assessment of the autism severity. Amino acid dysregulation may play a role in autism pathogenesis. Autistic children may require nutritional monitoring to ensure protein adequacy. The current study confirms that oxidative stress and high blood ammonia could be considered as clinical markers/cause–effect relationships among autistic children.
Study Limitations
Use of one assessment tool to judge the severity of autistic symptoms was the main limitation in the current study.
Acknowledgment
We are grateful to our participants for taking part in the study.
Disclosure
The authors report no conflicts of interest in this work.
References
1. Gerhant A, Olajossy M, Olajossy-Hilkesberger L. [Neuroanatomical, genetic and neurochemical aspects of infantile autism]. Psychiatr Pol. 2013;47(6):1101–1111.
2. Craske G, Bogels S, Friedman M, Hollander E, Fernandez RPR. Diagnostic and Statistical Manual of Mental Disorders (DSM-5TM). American Psychiatric Pub.; 2013.
3. Bradstreet JJ, Smith S, Baral M, Rossignol DA. Biomarker-guided interventions of clinically relevant conditions associated with autism spectrum disorders and attention deficit hyperactivity disorder. Altern Med Rev. 2010;15(1):15–32.
4. Lai MC, Lombardo MV, Baron-Cohen S. Autism. Lancet. 2014;383:896–910. doi:10.1016/S0140-6736(13)61539-1
5. Dawson G, Rogers SJ, Munson J, et al. Randomized, controlled trial of an intervention for toddlers with autism: the early start denver model. Pediatrics. 2010;125:e17–e23. doi:10.1542/peds.2009-0958
6. Bauer AZ, Kriebel D. Prenatal and perinatal analgesic exposure and autism: an ecological link. Environ Health. 2013;12:41. doi:10.1186/1476-069X-12-41
7. Tirouvanziam R, Obukhanych TV, Laval J, et al. Distinct plasma profile of polar neutral amino acids, leucine, and glutamate in children with autism spectrum disorders. J Autism Dev Disord. 2011;42:827–836. doi:10.1007/s10803-011-1314-x
8. Tu WJ, Chen H, He J. Application of LC-MS/MS analysis of plasma amino acids profiles in children with autism. J Clin Biochem Nutr. 2012;51:248–249. doi:10.3164/jcbn.12-45
9. Cochran DM, Sikoglu EM, Hodge SM, et al. Relationship among glutamine, γ-aminobutyric acid, and social cognition in autism spectrum disorders. J Child Adolesc Psychopharmacol. 2015;25:314–322. doi:10.1089/cap.2014.0112
10. Coyle JT. Glutamate and schizophrenia: beyond the dopamine hypothesis. Cell Mol Neurobiol. 2006;26:365–384. doi:10.1007/s10571-006-9062-8
11. Norenberg MD, Jayakumar AR, Rama Rao KV, Panickar KS. New concepts in the mechanism of ammonia induced astrocyte swelling. Metab Brain Dis. 2007;22(3–4):219–234. doi:10.1007/s11011-007-9062-5
12. Häberle J. Clinical and biochemical aspects of primary and secondary hyperammonemic disorders. Arch Biochem Biophys. 2013;536(2):101–108. doi:10.1016/j.abb.2013.04.009
13. Wakefield AJ, Puleston JM, Montgomery SM, Anthony A, O’Leary JJ, Murch SH. Review article: the concept of entero-colonic encephalopathy, autism and opioid receptor ligands. Aliment Pharmacol Ther. 2002;16:663–674. doi:10.1046/j.1365-2036.2002.01206.x
14. Braissant O, McLin VA, Cudalbu C. Ammonia toxicity to the brain. J Inherit Metab Dis. 2013;36(4):595–612. doi:10.1007/s10545-012-9546-2
15. Singh KK. Mitochondrial damage checkpoint, aging, and cancer. Ann N Y Acad Sci. 2006;1067:182–190. doi:10.1196/annals.1354.022
16. Andreazza AC, Kauer-Sant’Anna M, Frey BN, et al. Oxidative stress markers in bipolar disorder: a meta-analysis. J Affect Disord. 2008;111:135–144. doi:10.1016/j.jad.2008.04.013
17. Tsaluchidu S, Cocchi M, Tonello L, Puri BK. Fatty acids and oxidative stress in psychiatric disorders. BMC Psychiatry. 2008;8(1):S1–S5. doi:10.1186/1471-244X-8-S1-S5
18. James SJ, Cutler P, Melnyk S, et al. Metabolic biomarkers of increased oxidative stress and impaired methylation capacity in children with autism. Am J Clin Nutr. 2004;80:1611–1617. doi:10.1093/ajcn/80.6.1611
19. Narzisi A, Muratori F, Calderoni S, Fabbro F, Urgesi C. Neuropsychological profile in high functioning autism spectrum disorders. J Autism Dev Disord. 2013;43:1895–1909. doi:10.1007/s10803-012-1736-0
20. Coben R. The importance of electroencephalogram assessment for autistic disorders. Biofeedback. 2009;37:71–80. doi:10.5298/1081-5937-37.2.71
21. Wang J, Barstein J, Ethridge LE, et al. Resting state EEG abnormalities in autism spectrum disorders. J Neurodev Disord. 2013;5(1):24. doi:10.1186/1866-1955-5-24
22. Boutros NN, Lajiness-O’Neill R, Zillgitt A, Bowyer SM. EEG changes associated with autistic spectrum disorders. Neuropsychiatr Electrophysiol. 2015;1–3. doi:10.1186/s40810-014-0001-5
23. Naushad SM, Jain JM, Prasad CK, Naik U, Akella RR. Autistic children exhibit distinct plasma amino acid profile. Indian J Biochem Biophys. 2013;50(5):474–478.
24. Hassan MH, Desoky T, Sakhr HM, Gabra RH, Bakri AH. Possible metabolic alterations among autistic male children: clinical and biochemical approaches. J Mol Neurosci. 2019;67:204–216. doi:10.1007/s12031-018-1225-9
25. Desoky T, Hassan MH, Fayed HM, Sakhr HM. Biochemical assessments of thyroid profile, serum 25-hydroxycholecalciferol and cluster of differentiation 5 expression levels among children with autism. Neuropsychiatr Dis Treat. 2017;13:2397–2403. doi:10.2147/NDT.S146152
26. Matsonand JL, Rivet TT. The effects of severity of autism and PDD-NOS symptoms on challenging behaviors in adults with intellectual disabilities. J Dev Phys Disabil. 2008;20(1):41–51. doi:10.1007/s10882-007-9078-0
27. Sadek AA, Hassan MH, Mohammed NA. Clinical and neuropsychological outcomes for children with phenylketonuria in Upper Egypt; a single-center study over 5 years. Neuropsychiatr Dis Treat. 2018;14:2551–2561. doi:10.2147/NDT.S176198
28. Al B, Yarbil P, Zengin S, Ercan S, Davutoglu V, Yildirim C. Impact of scorpion stings on electrocardiographic changes and relationship with body oxidant and antioxidant status. J Pak Med Assoc. 2014;64:423–427.
29. Volkmar F, Chawarska K, Klin A. Autism in infancy and early childhood. Annu Rev Psychol. 2005;56:315–336. doi:10.1146/annurev.psych.56.091103.070159
30. Pfaff DW, Rapin I, Goldman S. Male predominance in autism: neuroendocrine influences on arousal and social anxiety. Autism Res. 2011;4(3):163–176. doi:10.1002/aur.191
31. Auyeung B, Knickmeyer R, Ashwin E, Taylor K, Hackett G, BaronCohen S. Effects of fetal testosterone on visuospatial ability. Arch Sex Behav. 2012;41(3):571–581. doi:10.1007/s10508-011-9864-8
32. Itzchak EB, Zachor DA, Harofeh A. Male: Female ratio Is Related to Autism Spectrum Disorder in the Family and to Maternal Age. Zerifin, Israe: Harofeh Medical Center, Franklin Hall B Level 4 (Philadelphia Marriott Downtown l); 2010.
33. Shu BC, Lung FW, Chang YY. The mental health in mothers with autistic children: a case-control study in southern Taiwan. Kaohsiung J Med Sci. 2000;16(6):308–314.
34. Liu A, Zhou W, Qu L, et al. Altered urinary amino acids in children with autism spectrum disorders. Front Cell Neurosci. 2019;13:7. doi:10.3389/fncel.2019.00007
35. Centers for Disease Control and Prevention (CDC). Prevalence of autism spectrum disorders-autism and developmental disabilities monitoring network, 14 sites, United States. MMWR. 2012;61:1–19.
36. Chez MG, Chang M, Krasne V, Coughlan C, Kominsky M, Schwartz A. Frequency of epileptiform EEG abnormalities in a sequential screening of autistic patients with no known clinical epilepsy from 1996 to 2005. EpilepsyBehav. 2006;8:267–271. doi:10.1016/j.yebeh.2005.11.001
37. Amiet C, Gourfinkel-An I, Bouzamondo A, et al. Epilepsy in autism is associated with intellectual disability and gender: evidence from a meta-analysis. Biol Psychiatry. 2008;64:577–582. doi:10.1016/j.biopsych.2008.04.030
38. Binnie CD. Significance and management of transitory cognitive impairment due to subclinical EEG discharges in children. Brain Dev. 1993;15:23–30. doi:10.1016/0387-7604(93)90003-Q
39. Hrdlicka M, Komarek V, Propper L, et al. Not EEG abnormalities but epilepsy is associated with autistic regression and mental functioning in childhood autism. Eur Child Adolesc Psychiatry. 2004;13:209–213. doi:10.1007/s00787-004-0353-7
40. Tamarah K, Roberts W, Snead C. Screening electroencephalogram in autism spectrum disorder. J Child Neurol. 2005;20:197–206. doi:10.1177/08830738050200030601
41. Elhabashy H, Raafat O, Afifi L, Raafat H, Abdullah K. Quantitative EEG in autistic children. Egypt J Neurol Psychiatr Neurosurg. 2015;52(3):176–182. doi:10.4103/1110-1083.162031
42. Azouz HG, Khalil M, Abdeldayem SH. Quantitative electroencephalographic changes in children with autism spectrum disorders. Alexandria Med J. 2018;31:97–105. doi:10.4103/AJOP.AJOP_29_18
43. Paula CAR, Reategui C, Costa BK, et al. High-frequency EEG variations in children with autism spectrum disorder during human faces visualization. Biomed Res Int. 2017;2017:3591914. doi:10.1155/2017/3591914
44. Fauzana N, Amran H. Brain waves and connectivity of autism spectrum disorders. Procedia Soc Behav Sci. 2015;171:882–890. doi:10.1016/j.sbspro.2015.01.204
45. Yousef AM, Youssef UM, El-Shabrawy A, Abdel Fattah NR, Khedr H, Khedr H. EEG abnormalities and severity of symptoms in non-epileptic autistic children. Egypt J Psychiatry. 2017;38(2):59–68. doi:10.4103/1110-1105.209676
46. Takarae Y, Sablich SR, White SP, Sweeney JA. Neurophysiological hyperresponsivity to sensory input in autism spectrum disorders. J Neurodev Disord. 2016;8:29. doi:10.1186/s11689-016-9162-9
47. William O, Aatif M, Selim R, Peter W. Handbook of EEG Interpretation. Springer Publishing Company. 2008:51–71.
48. Wu G. Amino acids: metabolism, functions, and nutrition. Amino Acids. 2009;37(1):1–17. doi:10.1007/s00726-009-0269-0
49. Arnold GL, Hyman SL, Mooney RA, Kirby RS. Plasma amino acids profiles in children with autism: potential risk of nutritional deficiencies. J Autism Dev Disord. 2003;33(4):449–454. doi:10.3164/jcbn.12-45
50. Zheng HF, Wang WQ, Li XM, et al. Body fluid levels of neuroactive amino acids in autism spectrum disorders: a review of the literature. Amino Acids. 2017;49(1):57–65. doi:10.1007/s00726-016-2332-y
51. Bugajska J, Berska J, Wojtyto T, Bik-Multanowski M, Sztefko K. The amino acid profile in blood plasma of young boys with autism. Psychiatr Pol. 2017;51(2):359–368. doi:10.1016/j.rasd.2018.03.004
52. McDougle CJ, Naylor ST, Cohen DJ, Aghajanian GK, Heninger GR, Price LH. Effects of tryptophan depletion in drug-free adults with autistic disorder. Arch Gen Psychiatry. 1996;53(11):9931000. doi:10.1001/archpsyc.1996.01830110029004
53. Zhang WQ, Smolik CM, Barba-Escobedo PA, et al. Acute dietary tryptophan manipulation differentially alters social behavior, brain serotonin and plasma corticosterone in three inbred mouse strains. Neuropharmacology. 2015;90:1–8. doi:10.1016/j.neuropharm.2014.10.024
54. Yang CJ, Tan HP, Du YJ. The developmental disruptions of serotonin signaling may involved in autism during early brain development. Neuroscience. 2014;267:1–10. doi:10.1016/j.neuroscience.2014.02.021
55. Sanctuary MR, Kain JN, Angkustsiri K, German JB. Dietary considerations in autism spectrum disorders: the potential role of protein digestion and microbial putrefaction in the gut-brain axis. Front Nutr. 2018;5:40. doi:10.3389/fnut.2018.00040
56. Ito S. GABA and glycine in the developing brain. J Physiol Sci. 2016;66:375–379. doi:10.1007/s12576-016-0442-7
57. Kaila K, Price TJ, Payne JA, et al. Cation-chloride cotransporters in neuronal development, plasticity and disease. Nat Rev Neurosci. 2014;15:637–654. doi:10.1038/nrn3819
58. Tyzio R, Nardou R, Ferrari DC, et al. Oxytocin-mediated GABA inhibition during delivery attenuates autism pathogenesis in rodent offspring. Science. 2014;343:675–679. doi:10.1126/science.1247190
59. Good P. Do salt cravings in children with autistic disorders reveal low blood sodium depleting brain taurine and glutamine?. Med Hypotheses. 2011;77:1015–1021. doi:10.1016/j.mehy.2011.08.038
60. Aldred S, Moore KM, Fitzgerald M, Waring RH. Plasma amino acid levels in children with autism and their families. J Autism Dev Disord. 2003;33(1):93–97. doi:10.1023/a:1022238706604
61. Rolf LH, Haarmann FY, Grotemeyer KH, Kehrer H. Serotonin and amino acid content in platelets of autistic children. Acta Psychiatr Scand. 1993;87(5):312–316. doi:10.1111/j.1600-0447.1993.tb03378.x
62. Morena-Fuenmayor J, Borjas I, Arrieta A, Balera V, SocorroCandanoza I. Plasma excitatory amino acids in autism. Investigacion Clinica. 1996;37:113–128.
63. Fernstrom JD. Branched-chain amino acids and brain function. J Nutr. 2005;135:1539–1546. doi:10.1093/jn/135.6.1539S
64. Shinohe A, Hashimoto K, Nakamura K, et al. Increased serum levels of glutamate in adult patients with autism. Prog Neuropsychopharmacol Biol Psychiatry. 2006;30(8):1472–1477. doi:10.1016/j.pnpbp.2006.06.013
65. Abu Shmais G, Al-Ayadhi L, Al-Dbass A, El-Ansary A. Mechanism of nitrogen metabolism-related parameters and enzyme activities in the pathophysiology of autism. J Neurodev Disord. 2012;4(1):4. doi:10.1186/1866-1955-4-4
66. Melnyk S, Fuchs GJ, Schulz E, et al. Metabolic imbalance associated with methylation dysregulation and oxidative damage in children with autism. J Autism Dev Disord. 2012;42(3):367–377. doi:10.1007/s10803-011-1260-7
67. Howsmon DP, Kruger U, Melnyk S, James SJ, Hahn J. Classification and adaptive behavior prediction of children with autism spectrum disorder based upon multivariate data analysis of markers of oxidative stress and DNA methylation. PLoS Comput Biol. 2017;13(3):e1005385. doi:10.1371/journal.pcbi.1005385
 © 2020 The Author(s). This work is published and licensed by Dove Medical Press Limited. The full terms of this license are available at https://www.dovepress.com/terms.php and incorporate the Creative Commons Attribution - Non Commercial (unported, v3.0) License.
By accessing the work you hereby accept the Terms. Non-commercial uses of the work are permitted without any further permission from Dove Medical Press Limited, provided the work is properly attributed. For permission for commercial use of this work, please see paragraphs 4.2 and 5 of our Terms.
© 2020 The Author(s). This work is published and licensed by Dove Medical Press Limited. The full terms of this license are available at https://www.dovepress.com/terms.php and incorporate the Creative Commons Attribution - Non Commercial (unported, v3.0) License.
By accessing the work you hereby accept the Terms. Non-commercial uses of the work are permitted without any further permission from Dove Medical Press Limited, provided the work is properly attributed. For permission for commercial use of this work, please see paragraphs 4.2 and 5 of our Terms.