")
Back to Journals » Clinical Interventions in Aging » Volume 11
Assessment risk of osteoporosis in Chinese people: relationship among body mass index, serum lipid profiles, blood glucose, and bone mineral density
Authors Cui R, Zhou L, Li Z, Li Q, Qi Z, Zhang J
Received 8 January 2016
Accepted for publication 11 March 2016
Published 4 July 2016 Volume 2016:11 Pages 887—895
DOI https://doi.org/10.2147/CIA.S103845
Checked for plagiarism Yes
Review by Single anonymous peer review
Peer reviewer comments 2
Editor who approved publication: Dr Zhi-Ying Wu
Rongtao Cui,1 Lin Zhou,2 Zuohong Li,2 Qing Li,2 Zhiming Qi,2 Junyong Zhang3
1Department of Orthopedic and Trauma Surgery, Surgical Research, Duisburg-Essen University Hospital, Essen, Germany; 2Department of Orthopedics, Dalian Central Hospital, Dalian, 3Department of Gastroenterology, Shandong Provincial Hospital, Jinan, People’s Republic of China
Objective: The aim of our study was to investigate the relationship among age, sex, body mass index (BMI), serum lipid profiles, blood glucose (BG), and bone mineral density (BMD), making an assessment of the risk of osteoporosis.
Materials and methods: A total of 1,035 male and 3,953 female healthy volunteers (aged 41–95 years) were recruited by an open invitation. The basic information, including age, sex, height, weight, waistline, hipline, menstrual cycle, and medical history, were collected by a questionnaire survey and physical examination. Serum lipid profiles, BG, postprandial blood glucose, and glycosylated hemoglobin were obtained after 12 hours fasting. BMD in lumbar spine was measured by dual-energy X-ray absorptiometry scanning.
Results: The age-adjusted BMD in females was significantly lower than in males. With aging, greater differences of BMD distribution exist in elderly females than in males (P<0.001), and the fastigium of bone mass loss was in the age range from 51 to 55 in females and from 61 to 65 years in males. After adjustment for sex, there were significant differences in BMD among BMI-stratified groups in both males and females. The subjects with a BMI of <18.5 had a higher incidence of osteoporosis than BMI ≥18.5 in both sexes. BMD in type 2 diabetes mellitus with a BG of >7.0 mmol/L was lower than in people with BG of ≤7.0 mmol/L (P<0.001). People with serum high-density lipoprotein cholesterol levels of ≥1.56 mmol/L had a greater prevalence of osteoporosis compared with high-density lipoprotein cholesterol ≤1.55 mmol/L. Logistic regression with odds ratios showed that no association was found among total cholesterol, triglyceride, low-density lipoprotein cholesterol, glycosylated hemoglobin, postprandial blood glucose and BMD.
Conclusion: The present study further confirmed that factors such as age, sex, weight, BMI, high-density lipoprotein cholesterol, and diabetes are significant predictors of osteoporosis in the Chinese people.
Keywords: risk assessment, BMI, blood glucose, serum lipid profiles, osteoporosis
Introduction
In the early 21st century, China’s population had risen to nearly 1.4 billion. There are ~200 million people older than 60 years old; surprisingly, around 100 million people either already have osteoporosis (OP) or are at a high risk due to low bone mass (osteopenia).1 This means that a large proportion of the population suffers from OP or osteopenia. In the Chinese people, OP is therefore an increasingly serious public health problem.2
OP is a disease marked by reduced bone strength leading to an increased risk of fractures or broken bones. It can be assessed indirectly through a noninvasive measurement of bone mineral density (BMD).3 OP is defined by a BMD which is reduced compared to normal levels. The reduction of bone densitometry with a T score of ≤−2.5 was based on the definition of the World Health Organization. Low BMD is a major risk factor for OP and osteoporotic fracture.4 As mentioned earlier, the difference between osteopenia and OP is that in osteopenia the bone loss is not as severe as in OP, which means that someone with osteopenia is more likely to fracture a bone than someone with normal bone density, but less likely to do so than someone with OP.5
Sex difference in BMD has long been reported, generally with a lower BMD in females than in males.6,7 The difference in BMD distribution at the same skeletal site between the two sexes may be partially explained by differences in endocrine and paracrine factors between the sexes.8,9 Most studies documenting age-related changes of total body and regional BMD have focused on female10,11 rather than male subjects.12 Elderly people experience bone loss with aging after peak bone mass is attained. Weight and height are two important factors related to BMD variation and are commonly used as covariates to adjust for BMD.13–15 To account for the correlation between weight and height, body mass index (BMI) has been introduced as a composite covariate for adjustment in BMD studies. BMI is weight divided by height squared (ie, kg/m2). Associations among BMI, weight, height, and BMD have been reported for many populations.15–17
Although type 1 diabetes mellitus (DM) has been associated with decreased BMD, there have been conflicting reports about BMD in type 2 diabetes mellitus (T2DM). Some authors have reported elevated BMD,18 whereas some have reported decreased BMD,19 and others have reported that BMD did not change.20 Previous epidemiological studies have demonstrated a relationship between serum lipid profiles and BMD.21–23 And furthermore, the question of whether the serum lipid profiles affect the value of BMD in the Chinese people (both men and women) is unclear.
Since the association between serum lipid profiles, blood glucose and BMI with BMD has not been assessed simultaneously in both Chinese men and women, we aimed to investigate this relationship and make a risk assessment of OP in this setting.
Materials and methods
Subjects
A total of 10,300 subjects (2,665 males and 7,635 females aged 40–95 years) who voluntarily requested to be hospitalized for a 2-day complete physical check-up during 2012 through 2015 were enrolled in the study. The exclusion criteria for the present study were as follows: type 1 DM, non-insulin-dependent DM, severe scoliosis, polio, hyper- or hypothyroidism, impaired renal function, significant chronic lung disease, apparently abnormal liver function, rheumatoid arthritis or collagen disease, malignancies, or a history of alcoholism, heavy smoking (>1 pack/day), hysterectomy, estrogen use, oophorectomy, and corticosteroid use. Those with fractures in the lumbar spine were also excluded from the analysis. Finally, 1,035 healthy males, aged 40–95 years (median 65 years) and 3,953 healthy females, aged 41–95 years (median 59 years) were classified to be eligible for the present study. All the study subjects belong to the Chinese Han ethnic group, which comprises ~90% of the total population of People’s Republic of China. Before entering the project, all subjects signed informed consent documents, and the protocols for the study were reviewed and approved by the ethics committee of the Dalian Central Hospital (Dalian, People’s Republic of China). For each study subject, the basic information, including age, sex, family history, inheritance history, medical history, and so on were obtained from self-administered questionnaires at the same time as BMD measurement. The menstrual history of each woman was recorded during an individual interview. Menopause was defined as the absence of any menstrual cycle for at least 1 year. The height, weight, waistline, and hipline were taken during the interview, with subjects wearing light indoor clothes without shoes.
Laboratory measurement
The biochemical parameters, including fasting blood glucose (FBG), postprandial blood glucose, glycosylated hemoglobin (HbA-1c), total cholesterol (TC), triglyceride (TG), and serum high-density lipoprotein cholesterol (HDL-C), were measured using an Abbott Diagnostics C8000i auto-analyzer (Abbott Laboratories, Abbott Park, Illinois USA) with commercial kits. Multigent direct assays were used to estimate serum low-density lipoprotein cholesterol (LDL-C) levels (Abbott Laboratories, Abbott Park, Illinois USA). The whole measurement procedure was supported by the Department of Clinical Laboratory and Imaging in the hospital. As a test of the Abbott Diagnostics C8000i auto-analyzer and Multigent direct assays’s precision, we measured blood from 15 individuals twice on the same day. The coefficient of variation values for TC, TG, HDL-C, and LDL-C were 1.9%, 1.6%, 3.6%, and 3.8%, respectively.
BMD measurement
BMD was measured for the lumbar spine (L1–L4) using a GE Lunar Prodigy (Lunar Corp., Madison, WI, USA) by dual-energy X-ray absorptiometry scanning. BMD was determined according to standard lunar protocols. BMD was expressed in T score and as peak bone mass percentage in normal subjects, depending on the software used in the device. The results for the lumbar spine were classified into three groups according to the World Health Organization criteria: normal (T score from −1.0 to 1.0 standard deviation), osteopenia (T score from −1.0 to −2.5 standard deviation), and OP (T score of ≤−2.5 standard deviation). As a test of the dual-energy X-ray absorptiometry scanner’s precision, we measured 15 individuals twice on the same day. The coefficient of variation of BMD for those subjects was 0.9% for the lumbar spine.
Statistical analysis
Continuous variables were defined as median values and interquartile ranges (25th to 75th percentile) because they were not normally distributed. According to the China Adult Dyslipidemia Prevention Guide, variables were categorized as follows: subjects were divided into groups by age with a 5-year span in each group – BMI <18.5, 18.5–22.9, >22.9 kg/m2; FBG ≤7.0, >7.0 mmol/L; postprandial blood glucose ≤11.1, >11.1 mmol/L; HbA-1c ≤6.5%, >6.5%; HDL-C ≤1.15 (1.54 in male), ≥1.16 (1.55 in male) mmol/L; LDL-C <3.1, ≥3.1 mmol/L; TC ≤2.8, 2.8–5.17, ≥5.17 mmol/L; and TG ≤0.56, 0.56–1.7, ≥1.7 mmol/L. In case data were not normally distributed, nonparametric tests were used. Mann–Whitney and Kruskal–Wallis tests were used for comparing two groups and for comparison of more than two groups simultaneously, respectively. Groups for categorical variables were analyzed by chi-square or Fisher’s exact tests. The relationship between BMD and continuous variables were tested using Spearman’s rank test. Pearson correlation was used to explore the risk factors of OP. SPSS software (version 21.0; IBM, Armonk, NY, USA) was used for statistical analysis. Statistical significance was accepted for a P-value of 0.05.
Results
The characteristics between males and females show significant differences (P<0.05) between height, weight, BMI, waistline, hipline, FBG, postprandial blood glucose, creatinine, HDL-C, LDL-C, TC, TG, and HbA-1c (Table 1). The significant difference between males and females in BMD value, and the age-adjusted BMD in lumbar spine was significant (P<0.05), especially over the age of 55 years (Table 2). Comparison of age-related BMD changes between male and female in lumbar spine was shown in Figure 1. In females (Figure 2), BMD decreased obviously with aging; a significant bone decrease started at >50 years of age at which the maximal BMD decrease was seen. In males, the bone decrease with aging was minimal or insignificant. The OP morbidity was increasing gradually with aging in females as shown in Figure 2; there was no significant difference with aging in males. The BMD median values in lumbar spine were lower in females than males which indicated an obvious sex difference in BMD.
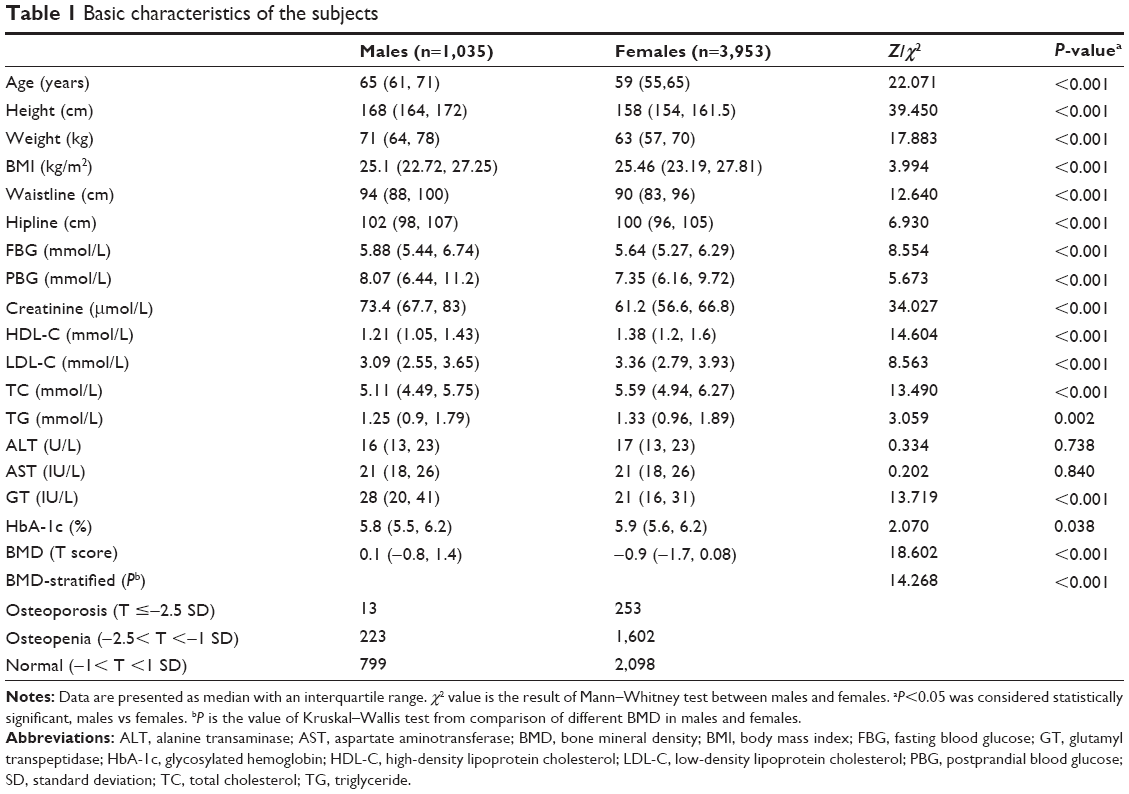 | Table 1 Basic characteristics of the subjects |
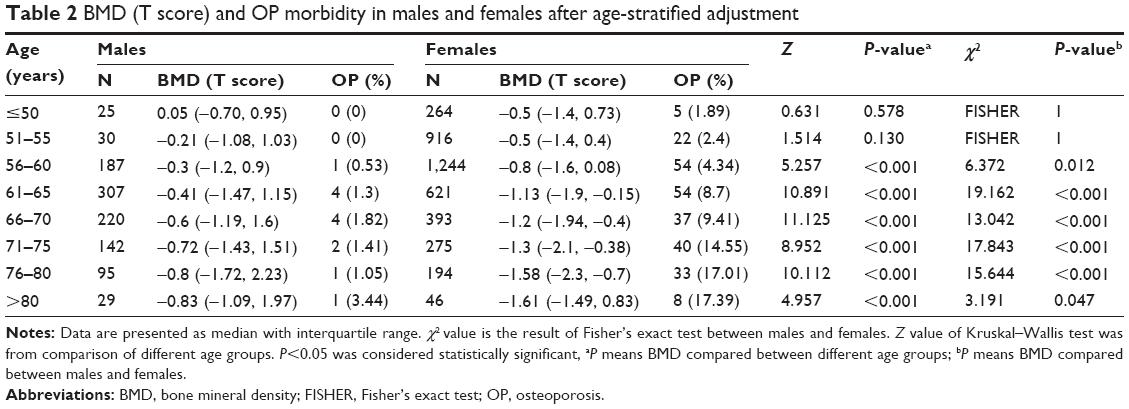 | Table 2 BMD (T score) and OP morbidity in males and females after age-stratified adjustment |
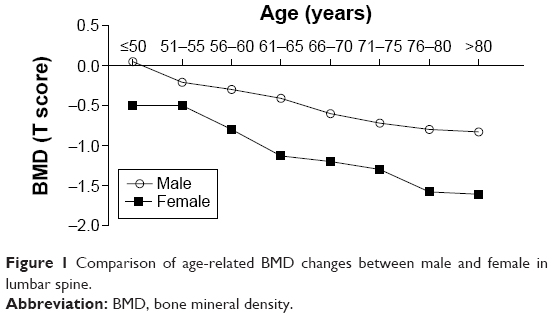 | Figure 1 Comparison of age-related BMD changes between male and female in lumbar spine. |
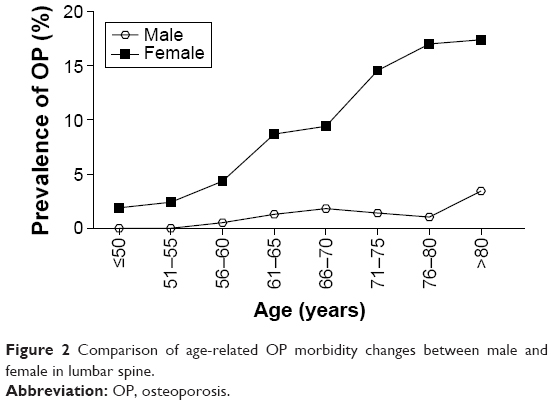 | Figure 2 Comparison of age-related OP morbidity changes between male and female in lumbar spine. |
According to the criteria, males and females were classified into three groups (OP, osteopenia, and normal). Significant differences between OP and normal groups were found in both males and females. The basic characteristics, including age, weight, BMI, and hipline, were significant differences between OP and normal (Tables 3 and 4). Furthermore, after adjustment for BMI, the subjects with BMI <18.5 had higher incidence of OP than the group with BMI ≥18.5 in both males and females.
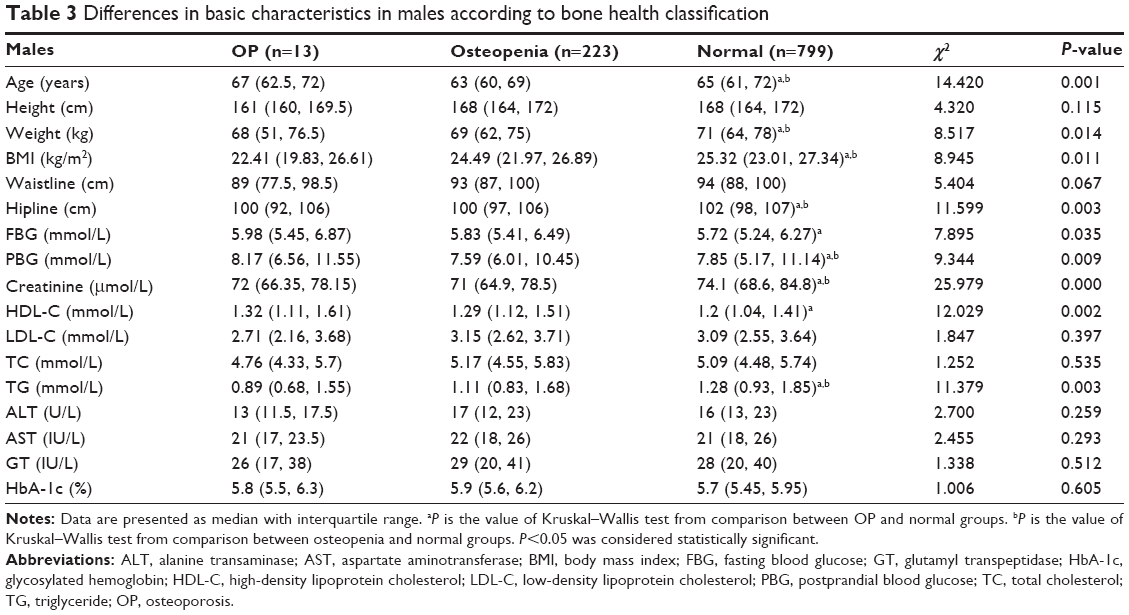 | Table 3 Differences in basic characteristics in males according to bone health classification |
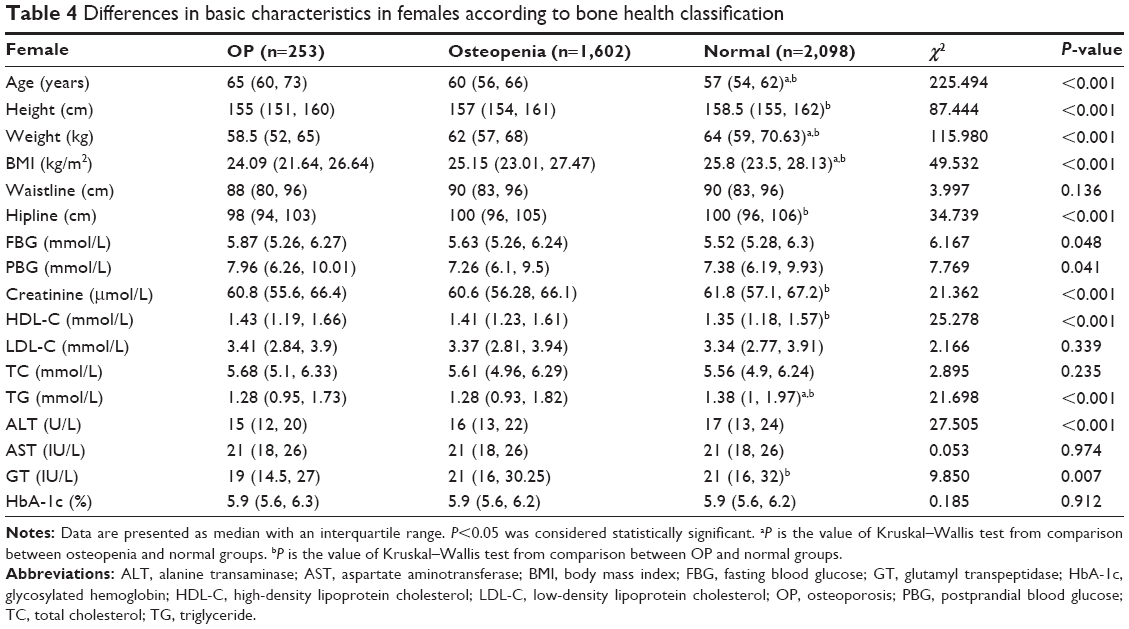 | Table 4 Differences in basic characteristics in females according to bone health classification |
Mann–Whitney tests showed that OP was more prevalent in the class of lower BMI values (<18.5 kg/m2) and FBG levels (>7.0 mmol/L) in both males and females. However, OP was more prevalent in the class of higher HDL-C levels (≥1.55 mmol/L) in females; as well a significant correlation between OP and HDL-C in males was found. In this study, no relationships were found between postprandial blood glucose, HbA-1c, and TC levels and OP (Tables 5 and 6).
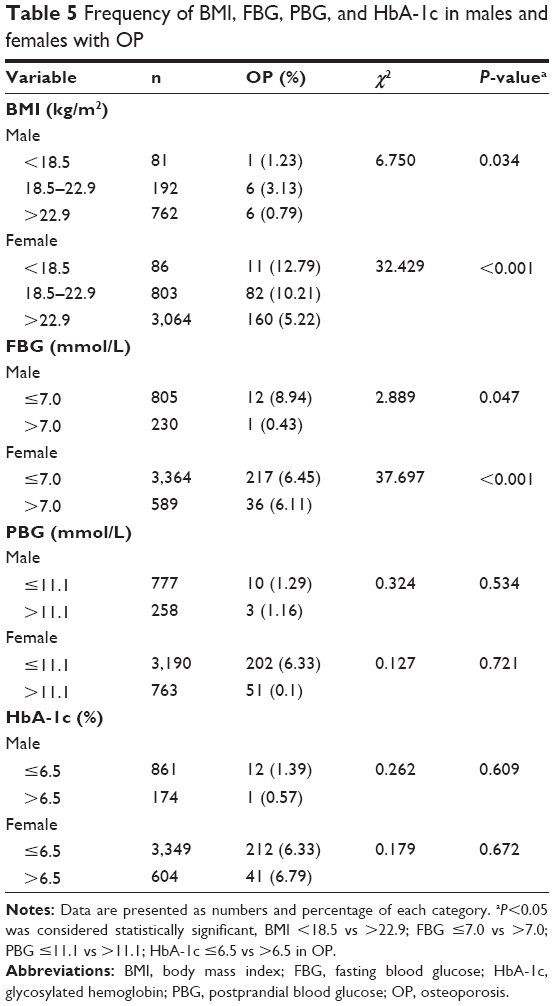 | Table 5 Frequency of BMI, FBG, PBG, and HbA-1c in males and females with OP |
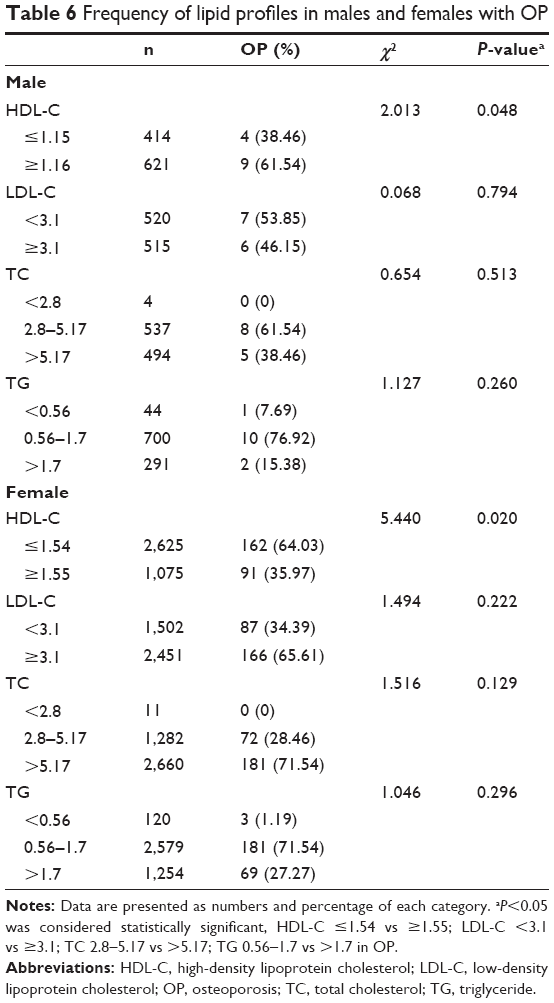 | Table 6 Frequency of lipid profiles in males and females with OP |
In both sexes, the correlation (r=0.168 in males, r=−0.260 in females) between OP and age was higher than that between OP and other variables. Correlation between females and OP was higher than males and OP. Both body weight and BMI were positively correlated with OP, the correlation (r=0.145) between OP and BMI in males was higher than that between OP and body weight (r=0.132), and the influence of BMI on OP (r=0.115) was lower than body weight (r=0.184) in females. FBG (r=0.08 in males, r=0.113 in females), HDL-C (r=0.153 in males, r=−0.104 in females), and TG (r=0.101 in males, r=0.076 in females) were correlated with OP in both males and females (Table 7).
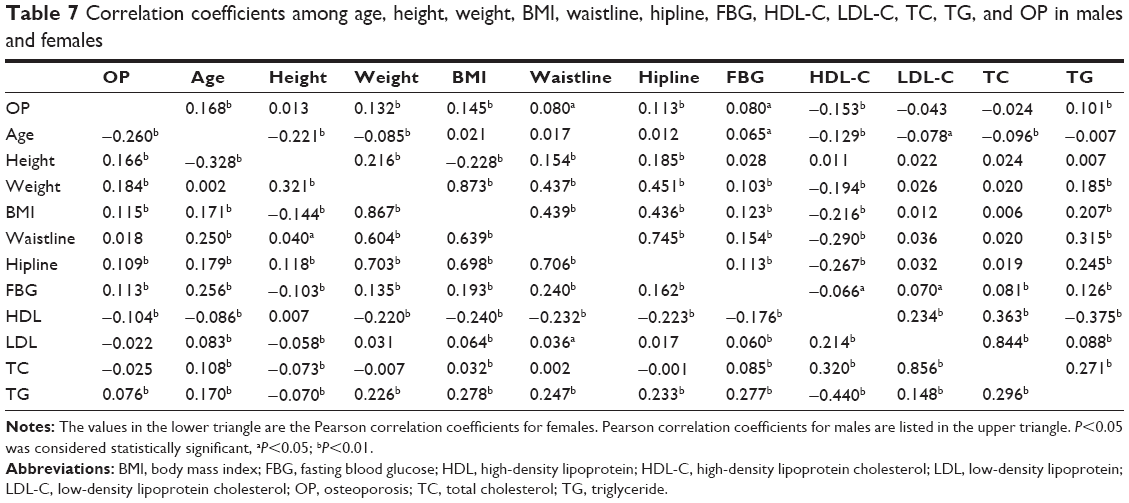 | Table 7 Correlation coefficients among age, height, weight, BMI, waistline, hipline, FBG, HDL-C, LDL-C, TC, TG, and OP in males and females |
Discussion
The global population is currently undergoing an upward shift in its age structure due to a decreasing fertility rate and an increasing life expectancy. Meanwhile, the incidence of OP is increasing sharply, and OP is becoming a serious public health problem. We investigated the relationship between age, sex, weight, height, BMI, FBG, and blood lipids profiles with BMD to improve the diagnosis and prevention of OP and reduce not only a significant economic and societal burden but also a social burden to individuals.24
In this study, we report that age is correlated with lumbar spine BMD in both sexes (P<0.001). Between the ages 46–50 and 56–60 years we found in women a rapid decrease in BMD, with a maximum bone decrease occurring at 51–55 years, and a decelerated decrease in BMD after 56–60 years. However, in men, the decrease in BMD with aging is minimal or insignificant except from 61–65 to 66–70 years, during which a major decrease in BMD of 2.5% is found. The pattern of BMD change in women in our study is simpler than previously reported: 1) maintenance of this level is from 35–39 to 40–44 years; 2) a mild decrease in BMD is from 40–44 to 45–49 years; 3) a rapid decrease in BMD is from 45–49 to 55–59 years; and 4) a decelerated decrease in BMD is after 55–59 years.25 There is a great discrepancy on the significance of premenopausal decline in BMD.26 A previous study demonstrated a substantial premenopausal decrease in BMD in lumbar spine,27 whereas another found no significant decrease in BMD before menopause.28 The present study’s results show a consistency with previous studies in that a maximum decrease in lumbar spine BMD is found in women at 50–54 years, the age at which the peak bone loss is reached.25
The current study demonstrates a sex-related difference for the lumbar spine BMD, which is consistent with a previous study showing that women have lower bone mass than men.17 The difference in BMD distribution at the same skeletal site between the two sexes may be partially explained by the differences in endocrine and paracrine factors between the sexes.8,9 Aging females experience two phases of bone loss, whereas aging males experience only one phase. An accelerated phase of predominantly cancellous bone loss initiated by menopause is the result of the loss of the direct restraining effect of estrogen on bone turnover. The sex steroid levels, including estrogen, rapidly decrease in postmenopausal women.
Our study shows that the magnitude of sex difference in BMD was reduced after adjustment for weight (BMI), which is similar to results reported previously.29–31 Previous studies have found that both weight and BMI impact on BMD. Contrary to this, Lei et al17 found the opposite viewpoint that height and BMI plays a crucial role in assessing BMD, with weight being a variable that explains the greatest proportion of the BMD variation for all measured sites in the Chinese. It is not appropriate to use weight and height simultaneously as covariates to adjust BMD. We detected that weight and BMI accounted for most of the effect of height on BMD variation in our sample. BMI is a variable derived from weight and height; in an attempt to deal with the correlation between height and weight, our study supports the notion that they are the appropriate covariates that reflect the effect of height and weight on BMD. Our results agree with reports from a previous study, which show that BMI and weight are the two most important variables relating to BMD.17
In our study, diabetes caused a decrease in the BMD of lumbar spine. All the T2DM patients in our study had good metabolic control. In a study by Isaia et al,32 decreased BMD was detected in patients with T2DM. This decrease arose from the period before the diagnosis of the disease when metabolic control was impaired. In another study, BMD in T2DM was also found to be decreased.33 A previous study has demonstrated that metformin increased osteogenesis by directly affecting the osteoblasts, and although sulfonylureas had an indirect favorable effect on fracture risk by correcting the glycemic control, they had an overall effect of reducing BMD, and pioglitazone was correlated with an increased fracture risk in postmenopausal females.34 By contrast, one study found that after adjustment for BMI, patients with T2DM had bone microarchitecture and BMD that were not significantly different than controls.19 However, as noted earlier, radial cortical porosity tended to have higher BMD in the patients with T2DM, which is consistent with the findings of Burghardt et al.35 The mechanisms explaining the increase in BMD are obesity, anabolic and mitogen effects of hyperinsulinemia, an increase in sex hormone-binding globulin, and increased estrogen and testosterone levels.36 It has been demonstrated that in patients with type 1 DM, insulin deficiency, decreased insulin-like growth factors-1 levels, and hypercalciuria play a role in the pathogenesis of increased bone loss.37 But the mechanisms of decreased BMD in T2DM are still unclear.
Although several studies have explored the association between serum lipid profiles and bone metabolisms, the literature is conflicting. Our findings are consistent with previous studies38,39 that found a negative relationship between HDL-C levels and BMD values. A previous study demonstrated that postmenopausal females who have never taken hormone replacement therapy show significantly higher cholesterol levels and lower BMD measurements in the lumbar spine than premenopausal females.40 A epidemiological study of 375 premenopausal and 355 postmenopausal rural women in South Korea showed that levels of serum TC and LDL-C were inversely correlated with BMD.22 Furthermore, plasma LDL-C and HDL-C levels have been shown to be inversely and positively correlated with BMD in both males and females, respectively.38,41 In some studies, serum TG and HDL-C were found to be correlated with BMD, but no relationship was seen between either TC or LDL-C and BMD.42–44 Li et al44 only focused on the postmenopausal Chinese women; however, our studies focused on both men and women aged 40–95 years old, where data on this population are scarce. This is population-based and included a relatively large sample size.
In the present study, although the correlation coefficients among age, weight, BMI, waistline, hipline, FBG, HDL-C, TG and OP were weak, the large number of subjects in this study provide us with credible conclusions that these parameters were risk factors in OP.
To summarize, our study gives further insights into a comprehensive risk assessment for OP in the Chinese people, increasing our understanding of the effect of age, sex, height, weight, BMI, blood glucose, and serum lipids profiles, including HDL-C, LDL-C, TC, and TG, on BMD. We found that women are more susceptible to suffer from OP than men in the Chinese people. The age at which the peak bone mass loss is reached in both men and women should be brought to the attention of researchers and clinicians. Weight and BMI have been shown to be key important variables relating to BMD. There also appears to be a significant bone mass loss in patients with T2DM, and the same is true for people who have high serum lipid levels, especially regarding the level of HDL-C. These variables and correlations which indicate BMD decline should be used in an effort to prevent and reduce the effect of OP.
This study also has several limitations. First, this study was involved individuals who took a health check in our hospital, as a result of which almost all subjects who were recruited to our study are older than 40 years old, and so we cannot discuss the BMD between young people and old people. Second, there is evidence that menopause modifies the association between age and BMD. However, we did not have access to such data from most female subjects to adjust for these parameters.
Acknowledgments
We wish to offer our sincere and grateful thanks to the subjects who helped with the development of our study. We thank the staff who helped us to measure the biochemical parameters and BMD in the Department of Clinical Laboratory and Imaging, Dalian Central Hospital.
Disclosure
The authors report no conflicts of interests in this work.
References
Wang Y, Tao Y, Hyman ME, Li J, Chen Y. Osteoporosis in China. Osteoporosis Int. 2009;20(10):1651–1662. | ||
Lin X, Xiong D, Peng YQ, et al. Epidemiology and management of osteoporosis in the People’s Republic of China: current perspectives. Clin Interv Aging. 2015;10:1017–1033. | ||
Cummings SR. Osteoporosis: Review of the evidence for prevention, diagnosis, and treatment and cost-effectiveness analysis – Status report. Osteoporosis Int. 1998;8:S1–S85. | ||
Atsumi K, Kushida K, Okamoto S, Aoshima H. Bone mineral density at various sites for prediction of vertebral fractures in hemodialysis patients. J Bone Miner Res. 2001;16:S544–554. | ||
Karaguzel G, Holick MF. Diagnosis and treatment of osteopenia. Rev Endocr Metab Disord. 2010;11(4):237–251. | ||
Ebbesen EN, Thomsen JS, Beck-Nielsen H, Nepper-Rasmussen HJ, Mosekilde L. Age- and gender-related differences in vertebral bone mass, density, and strength. J Bone Miner Res. 1999;14(8):1394–1403. | ||
Yan L, Prentice A, Zhou B, et al. Age- and gender-related differences in bone mineral status and biochemical markers of bone metabolism in Northern Chinese men and women. Bone. 2002;30(2):412–415. | ||
Khosla S, Melton LJ 3rd, Riggs BL. Osteoporosis: gender differences and similarities. Lupus. 1999;8(5):393–396. | ||
Riggs BL, Khosla S, Melton LJ. Sex steroids and the construction and conservation of the adult skeleton. Endocr Rev. 2002;23(3):279–302. | ||
Gotfredsen A, Nilas L, Podenphant J, Hadberg A, Christiansen C. Regional bone-mineral in healthy and osteoporotic women – a cross-sectional study. Scand J Clin Lab Invest. 1989;49(8):739–749. | ||
Christiansen C, Riis BJ, Rodbro P. Prediction of rapid bone loss in postmenopausal women. Lancet. 1987;1(8542):1106–1108. | ||
Nuti R, Martini G, Gennari C. Age-related-changes of whole skeleton and body-composition in healthy-men. Calcif Tissue Int. 1995;57(5):336–339. | ||
Blain H, Vuillemin A, Teissier A, Hanesse B, Guillemin F, Jeandel C. Influence of muscle strength and body weight and composition on regional bone mineral density in healthy women aged 60 years and over. Gerontology. 2001;47(4):207–212. | ||
Kirchengast S, Knogler W, Hauser G. Protective effect of moderate overweight on bone density of the hip joint in elderly and old Austrians. Anthropol Anz. 2002;60(2):187–197. | ||
Felson DT, Zhang Y, Hannan MT, Anderson JJ. Effects of weight and body mass index on bone mineral density in men and women: the Framingham study. J Bone Miner Res. 1993;8(5):567–573. | ||
Nguyen TV, Center JR, Eisman JA. Osteoporosis in elderly men and women: effects of dietary calcium, physical activity, and body mass index. J Bone Miner Res. 2000;15(2):322–331. | ||
Lei SF, Deng FY, Li MX, Dvornyk V, Deng HW. Bone mineral density in elderly Chinese: effects of age, sex, weight, height, and body mass index. J Bone Miner Metab. 2004;22(1):71–78. | ||
Suzuki K, Sugimoto C, Takizawa M, et al. Correlations between bone mineral density and circulating bone metabolic markers in diabetic patients. Diabetes Res Clin Pract. 2000;48(3):185–191. | ||
Farr JN, Drake MT, Amin S, Melton LJ, McCready LK, Khosla S. In vivo assessment of bone quality in postmenopausal women with type 2 diabetes. J Bone Miner Res. 2014;29(4):787–795. | ||
Saito M, Marumo K. Collagen cross-links as a determinant of bone quality: a possible explanation for bone fragility in aging, osteoporosis, and diabetes mellitus. Osteoporosis Int. 2010;21(2):195–214. | ||
Orozco P. Atherogenic lipid profile and elevated lipoprotein (a) are associated with lower bone mineral density in early postmenopausal overweight women. Eur J Epidemiol. 2004;19(12):1105–1112. | ||
Cui LH, Shin MH, Chung EK, et al. Association between bone mineral densities and serum lipid profiles of pre- and post-menopausal rural women in South Korea. Osteoporosis Int. 2005;16(12):1975–1981. | ||
Adami S, Braga V, Gatti D. Association between bone mineral density and serum lipids in men. J Am Med Assoc. 2001;286(7):791–792. | ||
Christensen K, Doblhammer G, Rau R, Vaupel JW. Ageing populations: the challenges ahead. Lancet. 2009;374(9696):1196–1208. | ||
Yao WJ, Wu CH, Wang ST, Chang CJ, Chiu NT, Yu CY. Differential changes in regional bone mineral density in healthy Chinese: age-related and sex-dependent. Calcified Tissue Int. 2001;68(6):330–336. | ||
Riis BJ. Premenopausal bone loss – Fact or artifact. Osteoporosis Int. 1994;4:35–37. | ||
Riggs BL, Wahner HW, Melton LJ 3rd, Richelson LS, Judd HL, Offord KP. Rates of bone loss in the appendicular and axial skeletons of women – evidence of substantial vertebral bone loss prior to menopause. J Clin Invest. 1986;34(2):1487–1491. | ||
Ravn P, Hetland ML, Overgaard K, Christiansen C. Premenopausal and postmenopausal changes in bone-mineral density of the proximal femur measured by dual-energy X-ray absorptiometry. J Bone Miner Res. 1994;9(12):1975–1980. | ||
Looker AC, Beck TJ, Orwoll ES. Does body size account for gender differences in femur bone density and geometry? J Bone Miner Res. 2001;16(7):1291–1299. | ||
Leidig-Bruckner G, Grobholz S, Bruckner T, Scheidt-Nave C, Nawroth P, Schneider JG. Prevalence and determinants of osteoporosis in patients with type 1 and type 2 diabetes mellitus. BMC Endocr Disord. 2014;14:33. | ||
Gorman E, Chudyk AM, Madden KM, Ashe MC. Bone health and type 2 diabetes mellitus: a systematic review. Physiother Can. 2011;63(1):8–20. | ||
Isaia GC, Ardissone P, Di Stefano M, et al. Bone metabolism in type 2 diabetes mellitus. Acta Diabetol. 1999;36(1–2):35–38. | ||
Montagnani A, Gonnelli S. Antidiabetic therapy effects on bone metabolism and fracture risk. Diabetes Obes Metab. 2013;15(9):784–791. | ||
Matyszewski A, Czarnecka M, et al. Impaired glucose metabolism treatment and carcinogenesis. Oncology Letters. 2015;10(2):589–594. | ||
Burghardt AJ, Issever AS, Schwartz AV, et al. High-resolution peripheral quantitative computed tomographic imaging of cortical and trabecular bone microarchitecture in patients with type 2 diabetes mellitus. J Clin Endocr Metab. 2010;95(11):5045–5055. | ||
Lunt H, Florkowski CM, Cundy T, et al. A population-based study of bone mineral density in women with longstanding type 1 (insulin dependent) diabetes. Diabetes Res Clin Pract. 1998;40(1):31–38. | ||
Starup-Linde J, Vestergaard P. Diabetes and osteoporosis: cause for concern? Eur J Endocrinol. 2015;173(3):R93–R99. | ||
Adami S, Braga V, Zamboni M, et al. Relationship between lipids and bone mass in 2 cohorts of healthy women and men. Calcified Tissue Int. 2004;74(2):136–142. | ||
Buizert PJ, van Schoor NM, Lips P, Deeg DJH, Eekhoff EM. Lipid levels: a link between cardiovascular disease and osteoporosis? J Bone Miner Res. 2009;24(6):1103–1109. | ||
Makovey J, Chen JS, Hayward C, Williams FMK, Sambrook PN. Association between serum cholesterol and bone mineral density. Bone. 2009;44(2):208–213. | ||
Yamaguchi T, Sugimoto T, Yano S, et al. Plasma lipids and osteoporosis in postmenopausal women. Endocr J. 2002;49(2):211–217. | ||
Dennison EM, Syddall HE, Sayer AA, Martin HJ, Cooper C; Hertfordshire Cohort Study Group. Lipid profile, obesity and bone mineral density: the Hertfordshire Cohort Study. Qjm-Int J Med. 2007;100(5):297–303. | ||
Jeong IK, Cho SW, Kim SW, et al. Lipid profiles and bone mineral density in pre- and postmenopausal women in Korea. Calcified Tissue Int. 2010;87(6):507–512. | ||
Li S, Guo HB, Liu YS, et al. Relationships of serum lipid profiles and bone mineral density in postmenopausal Chinese women. Clin Endocrinol (Oxf). 2015;82(1):53–58. |
 © 2016 The Author(s). This work is published and licensed by Dove Medical Press Limited. The full terms of this license are available at https://www.dovepress.com/terms.php and incorporate the Creative Commons Attribution - Non Commercial (unported, v3.0) License.
By accessing the work you hereby accept the Terms. Non-commercial uses of the work are permitted without any further permission from Dove Medical Press Limited, provided the work is properly attributed. For permission for commercial use of this work, please see paragraphs 4.2 and 5 of our Terms.
© 2016 The Author(s). This work is published and licensed by Dove Medical Press Limited. The full terms of this license are available at https://www.dovepress.com/terms.php and incorporate the Creative Commons Attribution - Non Commercial (unported, v3.0) License.
By accessing the work you hereby accept the Terms. Non-commercial uses of the work are permitted without any further permission from Dove Medical Press Limited, provided the work is properly attributed. For permission for commercial use of this work, please see paragraphs 4.2 and 5 of our Terms.