")
Back to Journals » Vascular Health and Risk Management » Volume 16
Assessment of Ventricular Repolarization in Sickle Cell Anemia Patients: The Role of QTc Interval, Tp-e Interval and Tp-e/QTc Ratio and Its Gender Implication
Authors Ajibare AO , Olabode OP, Fagbemiro EY, Akinlade OM , Akintunde AA , Akinpelu OO, Olatunji LA , Soladoye AO, Opadijo OG
Received 24 April 2020
Accepted for publication 1 October 2020
Published 7 December 2020 Volume 2020:16 Pages 525—533
DOI https://doi.org/10.2147/VHRM.S259766
Checked for plagiarism Yes
Review by Single anonymous peer review
Peer reviewer comments 2
Editor who approved publication: Dr Konstantinos Tziomalos
Adeola Olubunmi Ajibare,1 Olatunde Peter Olabode,2 Emmanuel Yemi Fagbemiro,3 Olawale Mathias Akinlade,4 Adeseye Abiodun Akintunde,4 Oluwaseun Oyetope Akinpelu,5 Lawrence Aderemi Olatunji,6 Ayodele Olufemi Soladoye,6 Oladimeji George Opadijo4
1Department of Medicine, Lagos State University College of Medicine Ikeja, Lagos, Nigeria; 2Cardiology Unit, BT Diagnostics, LASUTH, Ikeja, Lagos, Nigeria; 3Department of Medicine, College of Medicine, Nile University, Abuja, Nigeria; 4Cardiology Unit, Department of Internal Medicine, LAUTECH Teaching Hospital, Ogbomoso, Nigeria; 5Department of Hematology, LAUTECH Teaching Hospital, Ogbomoso, Nigeria; 6Department of Physiology, University of Ilorin, Ilorin, Nigeria
Correspondence: Adeola Olubunmi Ajibare Tel +234 8033251010
Email [email protected]
Background: Many specific and non-specific electrocardiographic abnormalities including ventricular arrhythmias have been reported in subjects with sickle cell anemia (SCA). In SCA patients, cardiac electrical abnormalities may be the leading cause of increased risk of arrhythmias. The corrected QT (QTc) interval, peak to the end of the T wave (Tp-e) interval and associated Tp-e/QTc ratio are promising measures of altered ventricular repolarization and increased arrhythmogenesis risk.
Aim: This study assessed ventricular repolarization abnormalities in subjects with SCA using the QTc interval, Tp-e interval and Tp-e/QTc ratio, and also evaluated the gender differences in these parameters, as well as their determinants.
Methods: Sixty subjects with SCA and 60 healthy control subjects, matched for age and gender, were studied. All participants underwent physical examination, hematological and biochemical evaluation, and 12-lead electrocardiography (ECG) recording. QT and Tp-e intervals were measured from the ECG, and the QTc interval was calculated using Bazett’s formula. Tp-e/QT and Tp-e/QTc ratios were also derived.
Results: QT and QTc intervals were prolonged in subjects with SCA. Tp-e interval, Tp-e/QT ratio and Tp-e/QTc ratio were prolonged in male SCA subjects, with a paradoxical shortening in female SCA subjects. Plasminogen activator inhibitor-1 (PAI-1) was an independent determinant of QTc, while body mass index (BMI) was an independent determinant of both Tp-e interval and Tp-e/QTc ratio.
Conclusion: Our results suggest an elevated risk for ventricular arrhythmogenesis in male SCA subjects. Furthermore, increased BMI and PAI-1 level are possible markers of ventricular repolarization abnormalities in SCA subjects.
Keywords: arrhythmias, electrocardiography, sickle cell anemia, ventricular repolarization, QTc interval, Tp-e interval
Introduction
Sickle cell disease (SCD) is an autosomal recessive disorder resulting from point mutations in the gene that encodes the β-globin chains of hemoglobin (Hb), leading to sickling/polymerization of erythrocytes after deoxygenation. This results in rigid, adherent erythrocytes, which are trapped in the microcirculation. Vaso-occlusion and hemolysis are the clinical hallmarks of the disease, leading to cardiac and non-cardiac manifestations.1 Vaso‐occlusive phenomena lead to intermittent ischemic events called crises. Crises may cause severe organ damage affecting all body organs including the brain, skeleton, pulmonary vasculature, spleen, liver and heart, resulting in an increased morbidity burden and increased mortality.2 Cardiac manifestations of sickle cell anemia (SCA) patients are variable depending on the pattern of evaluation, ethnicity and geographical distribution.3 Although there has been an improvement in the lifespan of patients with SCD over the past several decades, there is still a very high mortality rate from cardiovascular and pulmonary complications.4 Diastolic dysfunction, structural heart diseases, pulmonary hypertension and coronary artery/ischemic heart diseases are complications in subjects with SCA; however, malignant ventricular arrhythmias and death independent of the presence of structural heart diseases have been seen in sickle cell patients. Iron overload with evidence of cardiac iron deposition on magnetic resonance imaging has also been implicated as a cause of arrhythmia and death in patients with SCA.5 Electrocardiographic (ECG) abnormalities, such as significant prolongation of QRS duration, PR and QTc intervals, P wave, QRS and QTc dispersions, as well as inverted T-waves in the right-side chest leads, have been reported among Nigerians with SCA.6
Myocardial repolarization can be assessed with many ECG parameters, including QT interval (QT), corrected QT interval (QTc), QT dispersion and transmural dispersion of repolarization (TDR). Peak-to-end of the T wave (Tp-e), the interval from the peak to the end of the T wave on ECG, is a measure of transmural dispersion of ventricular repolarization.7 Tp-e/QT and Tp-e/QTc ratios can also be used as an ECG index of ventricular arrhythmogenesis.8
The QT interval on ECG is the time from the start of the QRS complex to the end of the T wave. Both a reduction and a prolongation in QT interval have been considered to be precursors of dangerous ventricular tachyarrhythmia. This has been seen in people with congenital short or long QT syndromes, characterized by extreme QT intervals at each end of the spectrum with a high risk of sudden cardiac death.9 In normal populations, many studies have associated changes in the heart rate-corrected QT (QTc) interval with an elevated risk of sudden cardiovascular death.10
Although QT and QTc intervals have been demonstrated to be important ECG predictors of ventricular arrhythmogenesis in SCA and other populations, their prognostic importance has been challenged in some studies11 and they have been termed as poor indicators of ventricular arrhythmogenesis.12 Therefore, there is a need to evaluate other parameters, such as Tp-e interval and Tp-e/QT and Tp-e/QTc ratios, which are known to be relatively constant parameters compared to QT and QTc intervals, which are subject to dynamic changes.
Increases in the serum level of plasminogen‐activator inhibitor type 1 (PAI‐1) and some other inflammatory markers supporting the existence of ongoing procoagulation and hypofibrinolysis had previously been documented to occur in steady-state SCA, which then increase further in sickle cell crises;13 however, their relationship with ventricular repolarization is not well documented. Other determinants of ventricular repolarization also need to be further evaluated.
There is a paucity of studies investigating the Tp-e interval and Tpe-e/QTc ratio in SCA. Gender differences in ventricular repolarization and arrhythmias in SCA populations have also not been fully studied. Owing to gender-specific associations of many electrical abnormalities, such as QT and QTc, it is important to identify gender differences among these parameters in SCA patients. Our aim in this study is therefore to evaluate ventricular repolarization in SCA subjects using the QTc interval, Tp-e interval and Tp-e/QTc ratio in comparison with normal individuals; and also to investigate whether there are gender differences in these parameters among the study population.
Methods
Patients
This study was conducted in the sickle cell outpatients clinics of the University of Ilorin Teaching Hospital (UITH), Ilorin, Kwara State, and Ladoke Akintola University of Technology (LAUTECH) Teaching Hospital, Ogbomoso, Oyo State, Nigeria. Sixty (M/F = 35/25) consecutive young adults with SCA and 60 healthy controls (M/F = 36/24), between the ages of 18 and 35 years, were recruited. All patients recruited into this study were in a steady-state condition, defined as the absence of vaso-occlusive crises, stroke, priapism and acute chest syndrome (ACS), and the absence of acute illness for a minimum of 8 weeks prior to recruitment. Pregnant patients and those with heart disease, recent blood transfusion (within 12 weeks), severe anemia (hematocrit <18%), use of tobacco, and excessive intake of alcohol (>16 g daily) were excluded from the SCA group. The inclusion criteria for controls were individuals who had aHb genotype of AA on hemoglobin electrophoresis (HbAA). The controls were healthy subjects selected from the student population, as well as the local and hospital community. All participants consented to the procedure and purpose of the study. Ethical approval was given by the ethical review committees of both UITH and LAUTECH Teaching Hospital.
Clinical Data
A meter tape was used to measure the waist circumference (WC), neck circumference (NC), hip circumference (HC) and height, while weight was measured using a weighing scale and body mass index was calculated (BMI = weight/height2, kg/m2). The systolic and diastolic blood pressure (BP) were measured using a mercury column sphygmomanometer according to standardized protocols. Pulse pressure was taken as the difference between systolic BP and diastolic BP. The mean arterial pressure (MAP) was calculated as the diastolic BP + ⅓ pulse pressure. Heart rate (HR) was also recorded for each patient.
Biological Data
Blood samples were taken after a 12-hour overnight fast, between 8:00 a.m. and 10:00 a.m., and hematological parameters such as hemoglobin and hematocrit concentrations, white blood cell (WBC), red blood cell (RBC) and platelet counts were determined using an automated hematological analyzer (Mindray BC-5300; In-Vitro Diagnostics, UK). Aliquots of the blood samples were centrifuged at 3000 rpm for 15 minutes and plasma was stored in the refrigerator until assayed. Fasting plasma levels of triglyceride (TG), total cholesterol (TC) and high-density lipoprotein cholesterol (HDL-C) were obtained by a standard enzymatic–colorimetric method with assay kits supplied by Randox Laboratory (Co Antrim, UK). Low-density lipoprotein cholesterol (LDL-C) was calculated using Friedewald’s formula.14 Plasma temperature was maintained at 37°C in a thermostatic incubator before plasma viscosity was estimated by adapted capillary viscometry. Plasma viscosity was calculated as the ratio of the flow time for a given volume of plasma to the flow time for the same volume of distilled water,15 while blood viscosity was calculated by the modified Vand formula.16 Uric acid was determined using the uricase–peroxidase method. Both CRP and PAI-1 were derived using enzyme-linked immunosorbent assay (ELISA) kits.
Electrocardiography (ECG)
The 12-lead ECG recordings were obtained using the Biocare® IE-12A model digital electrocardiography machine at a voltage of 10 mm/mV and paper speed of 25 mm/sec. QT and Tp-e intervals were measured manually. The Tp-e/QT ratio and Tp-e/QTc ratio were derived from these measurements. The QT interval was recorded as the time from the start of the QRS to the point at which the T wave returns to baseline. The corrected QT (QTc) interval was derived using Bazett’s formula. The Tp-e interval was measured from the peak of the T wave to the end of the T wave. The end of the T wave is the intersection of the tangent to the down slope of the T wave and isoelectric line using the long rhythm strips of leads V2 and V5 (Figure 1). In the presence of a U wave, the end of the T wave was defined as the nadir between the T wave and U wave. Two independent investigators performed all the measurements. The mean of the measurements was calculated and analyzed.
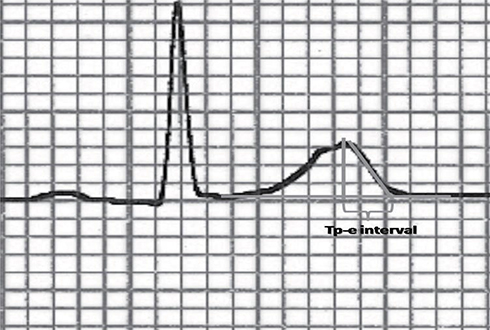 |
Figure 1 Measurement of the interval between the peak and the end of the T wave (Tp-e). |
Data Analyses
The results were expressed as means ± standard deviation (SD). To compare biological parameters between the groups, the unpaired Student’s t-test was used for continuous variables. To identify risk factors associated with ECG parameters in SCA patients, we used a multivariate linear regression analysis. The level of significance was set as p˂0.05. All statistical analyses were conducted using SPSS (version 18; IBM SPSS Statistics, Chicago, IL).
Results
Our study population comprised 60 patients with SCA and 60 healthy control subjects. We first compared the data of the whole SCA population mean value to the normal population (Tables 1 and 2) and thereafter separated the study population into male and female and compared them to their respective gender controls (Tables 3 and 4). The case and control groups were matched for age and gender (Tables 1 and 3). The SCA groups had significantly reduced weight, NC, WC, HC and BMI compared with normal controls and also when both SCA gender groups were compared separately with their respective controls. The SCA population appears to be shorter than normal individuals but there was no statistical difference in the height of both male and female SCA groups compared to their respective controls (Tables 1 and 3).
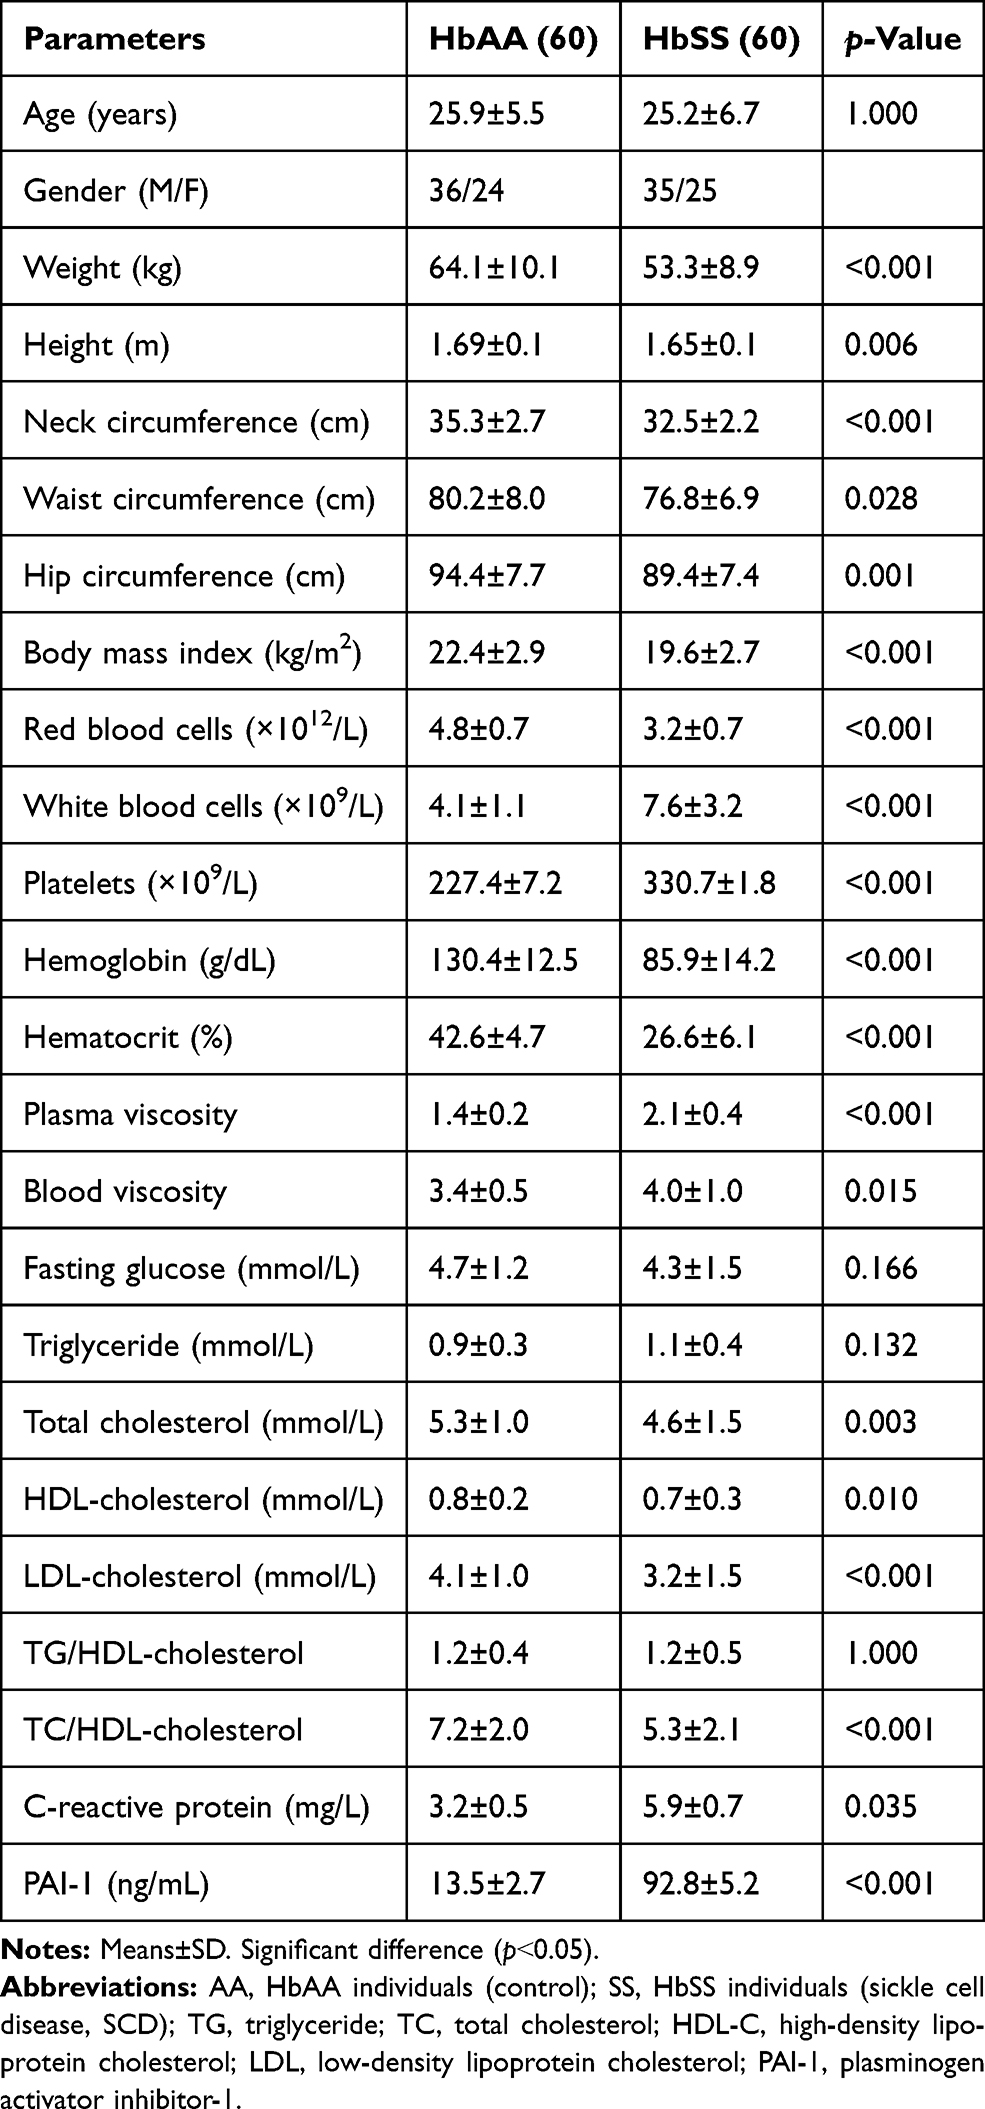 |
Table 1 Biological and Laboratory Parameters of the Study Population |
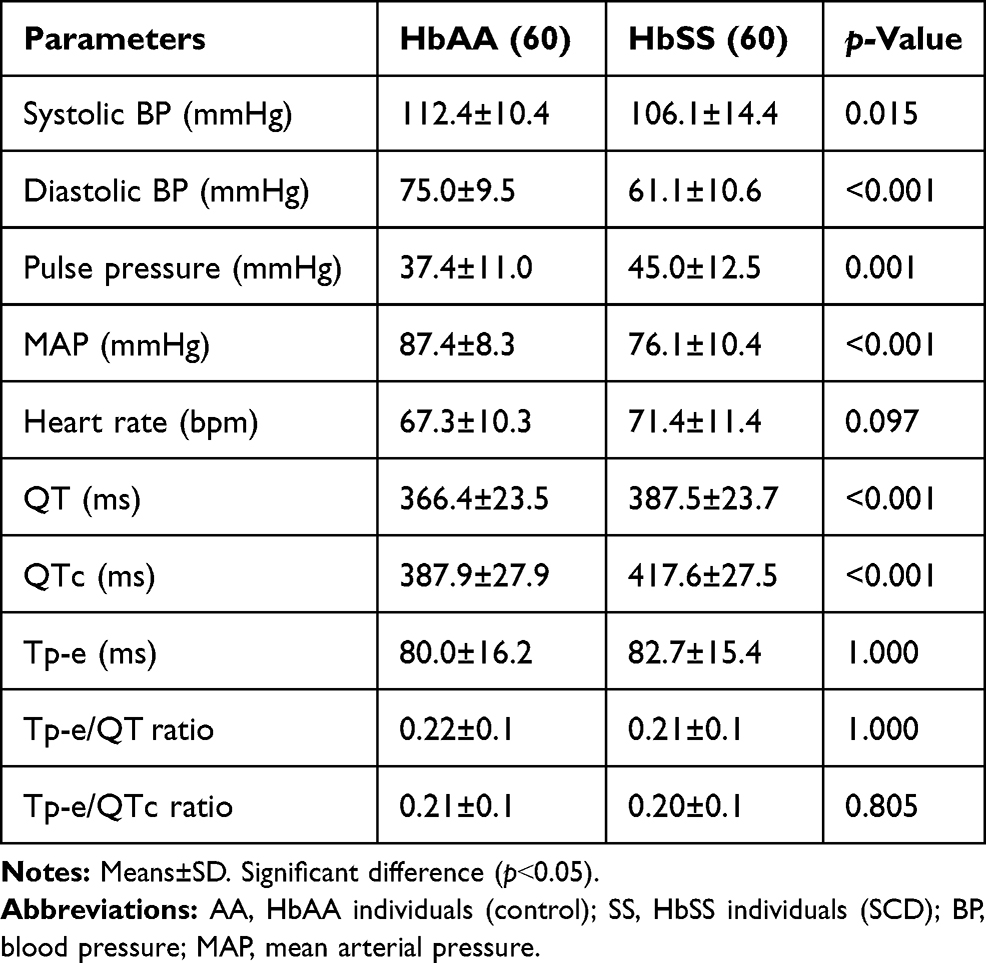 |
Table 2 Clinical and Electrocardiographic Variables of the Study Population |
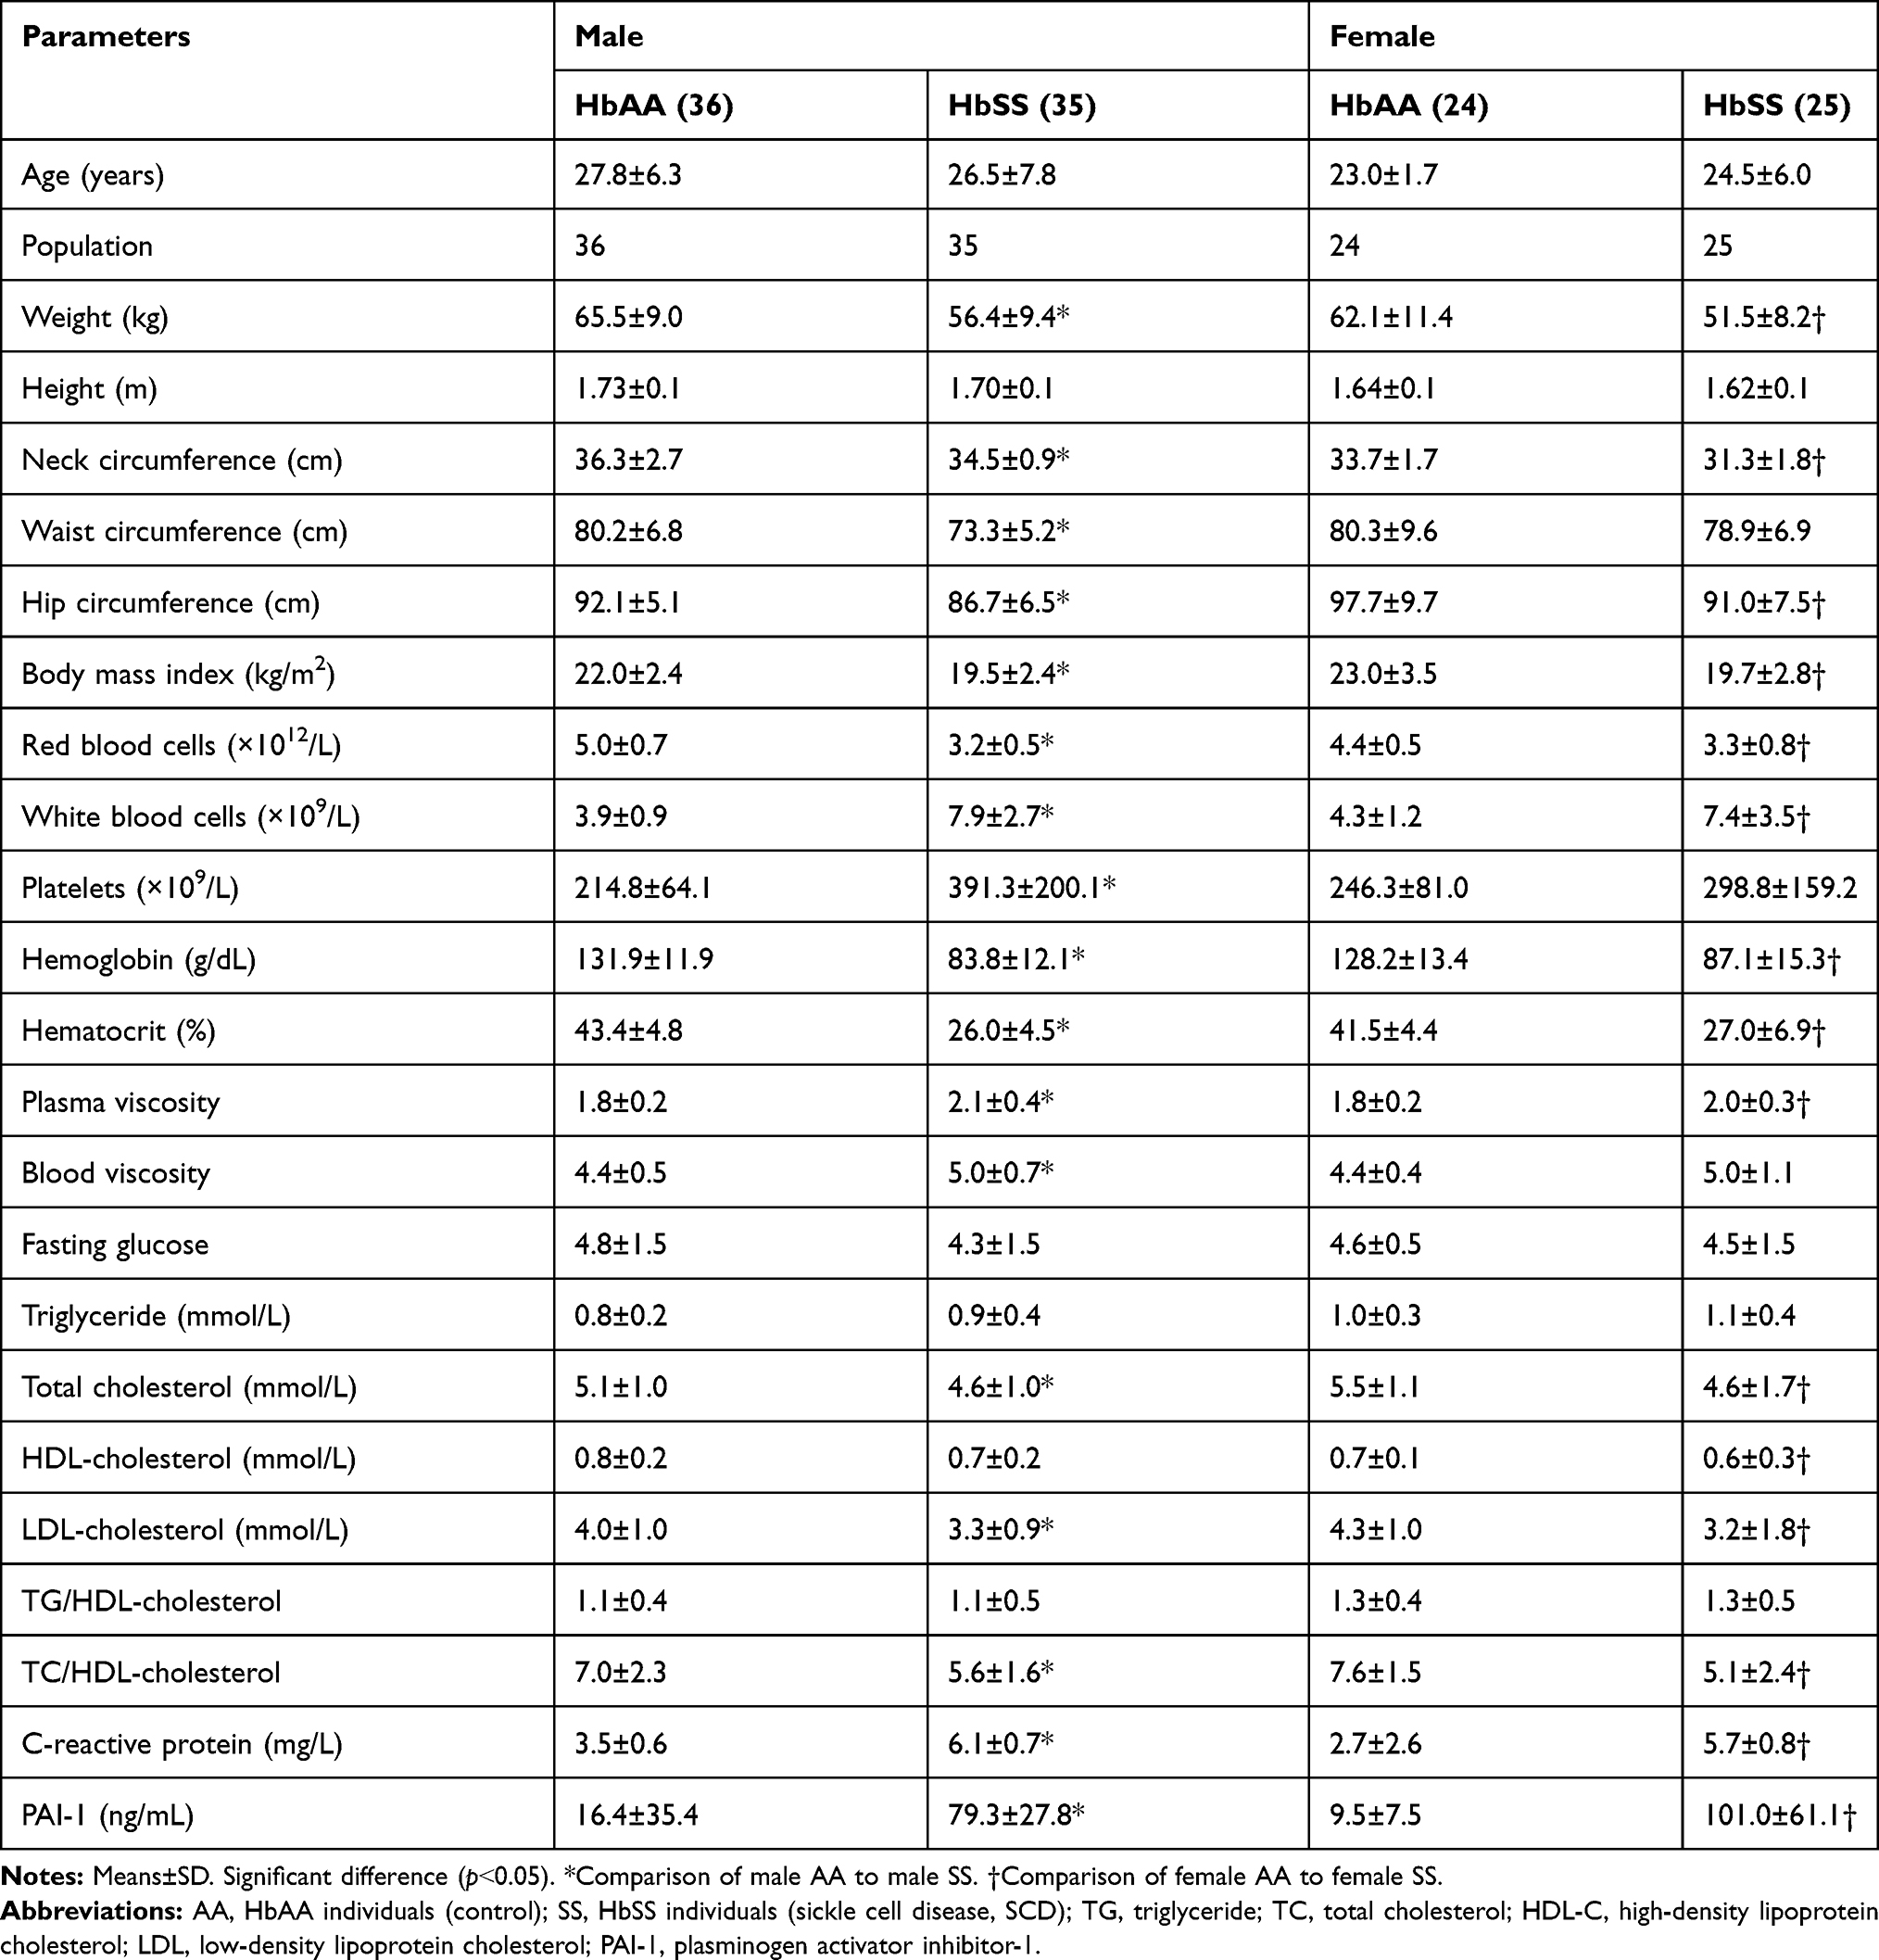 |
Table 3 Biological and Laboratory Parameters of the Study Population Characterized by Gender |
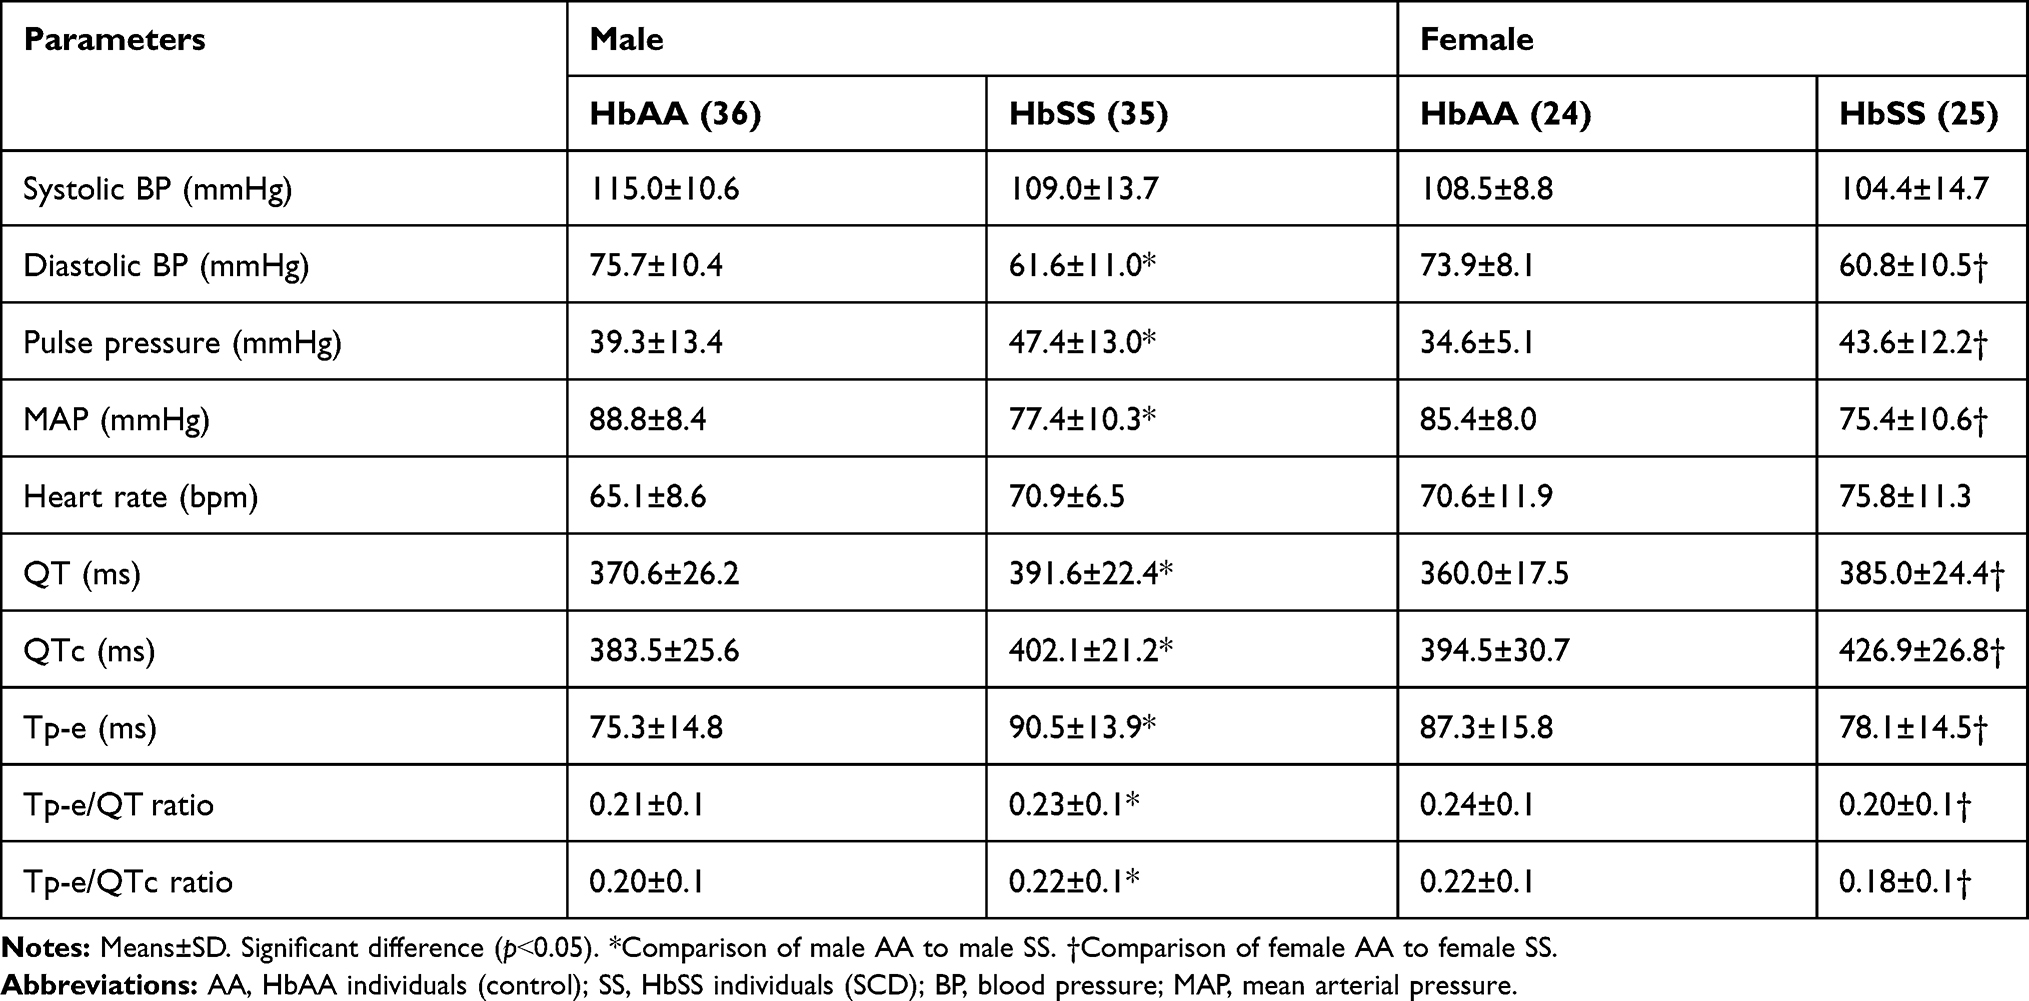 |
Table 4 Clinical and Electrocardiographic Variables of the Study Population Characterized by Gender |
For hematological variables, RBC, hemoglobin and hematocrit levels were lower, while the WBC count was significantly higher in all SCA groups compared with their respective controls. There was an increase in the platelet count of the whole SCA population and male SCA; however, the platelet count of the female SCA, although higher than the controls, was not significantly so. Fasting plasma glucose was also comparable in the SCA general population and the gender subgroups (Tables 1 and 3).
In all SCA groups, TC, LDL-C and TC/HDL-C were all significantly lower compared to the control, while the TG/HDL-C was comparable. TG was increased in the SCA population but was not statistically different in both male and female groups compared with their respective controls. HDL-C was higher in the SCA groups but this difference was not statistically significant.
CRP and PAI-1 were also elevated in all SCA groups compared to controls (Tables 1 and 3).
Regarding BP and ECG parameters, all SCA groups had significantly lower diastolic BP and MAP, while the pulse pressure was significantly higher in all the SCA groups. The systolic BP was lower in the SCA groups, though not significantly so, while the mean HR was higher in the SCA groups compared to the controls.
QT and QTc intervals were significantly higher in both the male and female SCA population compared to their respective control groups; however, while the Tp-e interval, Tp-e/QT and Tp-e/QTc ratios were prolonged in the male SCA groups, there was a paradoxical shortening in the female SCA population (Tables 2 and 4).
Multivariate Linear Regression Analysis
Multiple linear regression analysis established that PAI-1 was an independent determinant of QTc (Table 5) and BMI was an independent determinant of both Tp-e interval (Table 6) and Tp-e/QTc ratio (Table 7) in both genders. However, the predictive power of these variables appears to be stronger in males than in females with SCA.
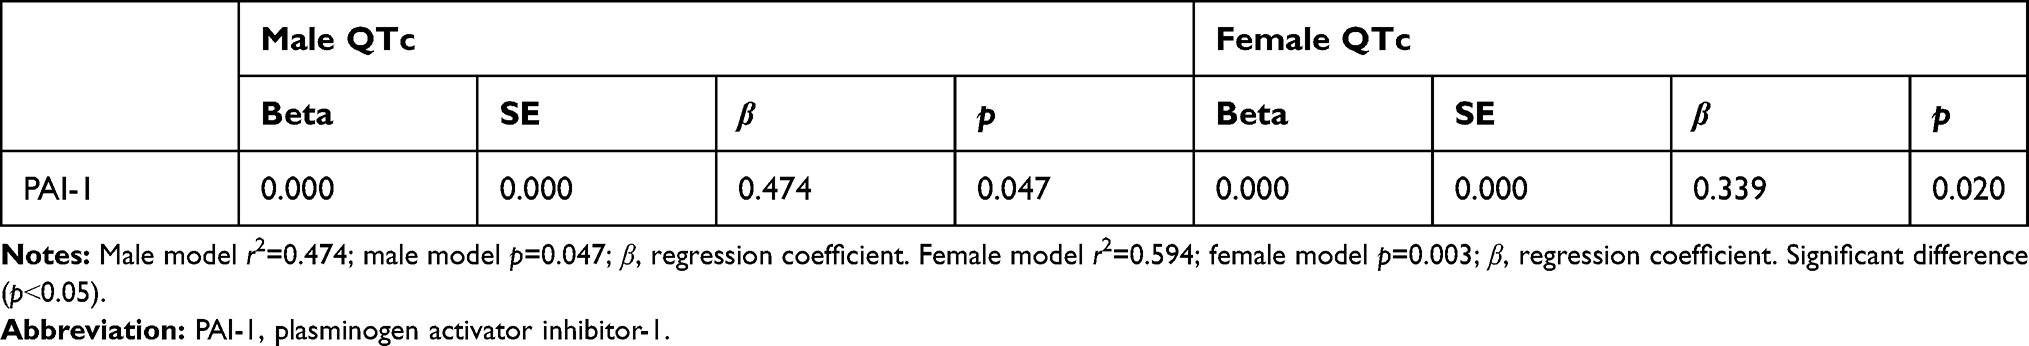 |
Table 5 Linear Regression in the Sickle Cell Anemia Population (PAI-1 and QTc) |
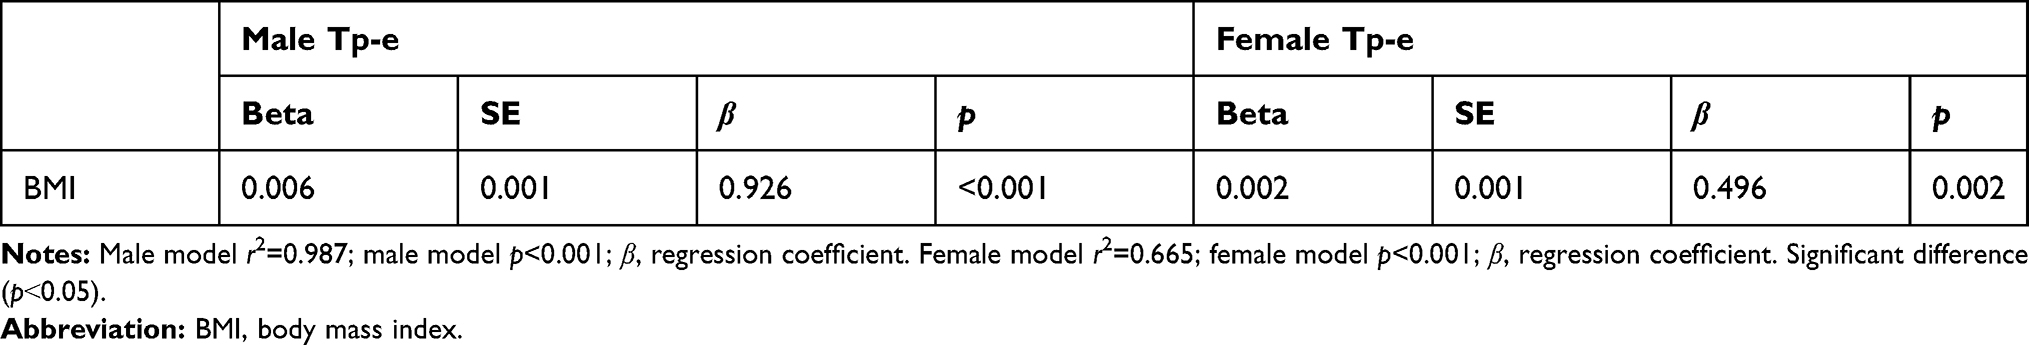 |
Table 6 Linear Regression in the Sickle Cell Anemia Population (BMI and Tp-e) |
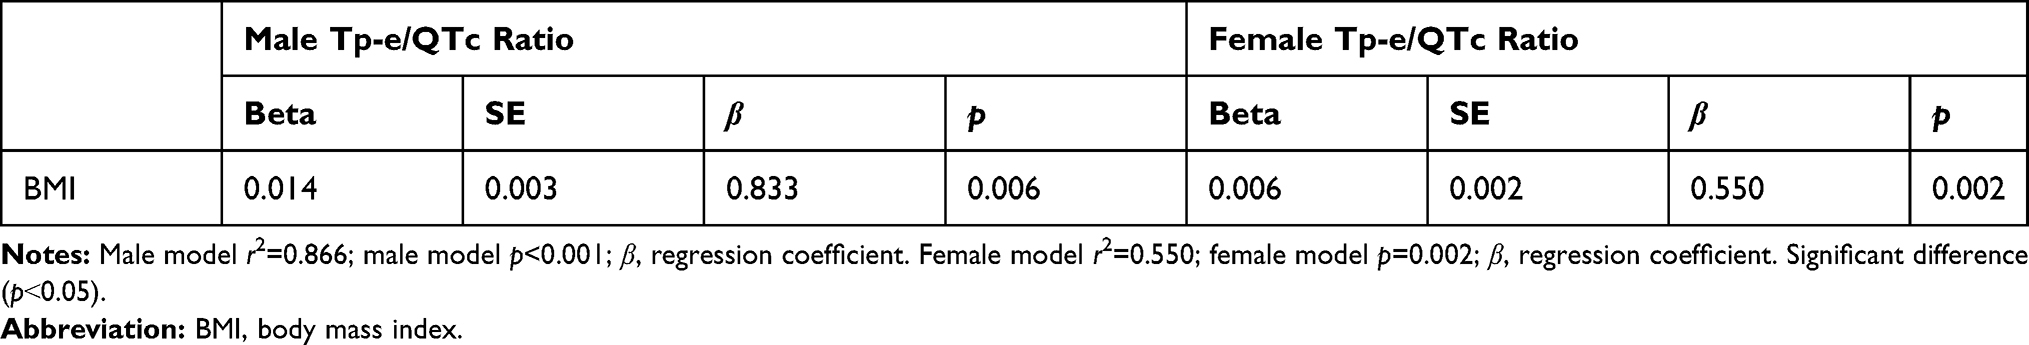 |
Table 7 Linear Regression in the Sickle Cell Anemia Population (BMI and Tp-e/QTc Ratio) |
Discussion
We evaluated some ECG parameters that were previously linked with sudden death in SCA patients and also examined gender differences in these ECG parameters. Our results showed that the mean QT and QTc intervals were higher in the SCA group compared to the control group. Also, when analyzed separately for gender comparison, the SCA gender subgroups had significantly higher values than their corresponding control groups. These findings are similar to the conclusion of previous studies that evaluated QT parameters in SCA patients.17,18 Prolongation of QTc was used to assess abnormal ventricular repolarization, which was shown to be a harbinger of ventricular tachyarrhythmia, troublesome palpitations, cardiac arrest and sudden cardiac death.19 Similarly, some studies have associated the prolonged QT and QTc seen in SCA patients with pulmonary hypertension and multiple blood transfusions, which are common in SCA;20,21 however, this study did not evaluate the frequency of blood transfusion or the presence of pulmonary hypertension.
One major finding of this study is that the Tp-e interval and Tp-e/QT and Tp-e/QTc ratios were not statistically significantly different when the whole SCA population was compared to normal individuals; however, there was an increase in these indices in male SCA and a paradoxical decrease in female SCA compared to their respective controls. It has been shown that prolongation of the Tp-e interval is associated with increased risk of mortality and sudden death in many chronic conditions, such as Brugada syndrome, long QT syndromes, hypertrophic cardiomyopathy and obstructive sleep apnea, and in some patients undergoing primary percutaneous coronary intervention for myocardial infarction.10,22,23 Also, research has established that these indices decreased as the collateral circulation increased in stable coronary artery disease and associated cardiac ischemia.24 Our understanding from these findings is that cardiac ischemia resulting from microvascular occlusion may be one of the factors prolonging the Tp-e interval and thus may be responsible for the prolongation of these parameters in SCA patients.
In a large cooperative study conducted in the USA in 1994 by Platt et al, the median survival for SCA was reported as 42 and 48 years in men and women, respectively. For hemoglobin SC (Hb SC) disease, the ages were reported as 60 years and 68 years for men and women, respectively,25 and in Jamaica, survival ages estimated for people with SCA were 53 years and 58.5 years for men and women, respectively,26 suggesting that males with SCA are more prone to sudden death and have a shorter lifespan compared to females with SCA. An epidemiological study has also revealed that women appear to have a lower risk of arrhythmia-related sudden death than men, and that postmenopausal women are more at risk of sudden cardiac death than their premenopausal counterparts.27 Animal experiments have shown that estrogen could attenuate ischemia- or reperfusion-induced ventricular arrhythmias,28 which suggests that female sex hormones may have protective effects against arrhythmias.29 Our findings of increased Tp-e interval and Tp-e/QT and Tp-e/QTc ratios in males but not in females with SCA may be a pointer to the pathophysiology and reasons for the shorter life expectancy, higher sudden death and increased prevalence of ventricular arrhythmias observed in males compared to females with SCA.
On the predictors of ECG parameters in SCA patients, our findings showed that PAI-1 was an independent determinant of QTc interval, and BMI was equally an independent determinant of both Tp-e interval and Tp-e/QTc ratio. Furthermore, the predictive power of these variables was stronger in males than in females with SCA, suggesting that a change in PAI-1 and BMI may produce a stronger impact on the ECG parameters in male than in female patients with SCA. In SCA, elevated PAI-1 levels have been reported at steady state and are further elevated during sickle vaso-occlusive crises,30 and a previous study in another population showed that the Tp-e interval and Tp-e/QT ratio correlate positively with inflammation.31 Our findings may therefore suggest that females with SCA may have a lower risk of ventricular arrhythmias with the varying PAI-1 seen during sickle cell crisis. PAI-1 has been reported to mediate inflammation and thrombosis and also to stimulate oxidative stress.32
Our results also showed that the sickle cell population had higher blood viscosity, plasma viscosity and heart rate compared to the control group, which may be markers of ongoing inflammation and/or increased sympathetic activity. Janse van Rensburg et al and Mountantonakis and Deo showed that increased sympathetic and inflammatory activity has a direct causal relationship with cardiac arrhythmias and sudden cardiac death through electrical disturbances occurring during ventricular repolarization.33,34 Our result on the impact of the correlation of BMI with ECG ventricular repolarization variables is also in tandem with the findings of Arslan et al.35
Conclusion
This study demonstrated that there may be an increased risk of ventricular arrhythmias and thus cardiovascular mortality in male SCA patients compared with their female counterparts. Also, increased BMI and PAI-1 level are possible markers of ECG abnormalities in SCA patients. There are limited data assessing the Tp-e interval and Tp-e/QTc ratio in SCA patients; therefore, our findings may be useful as a reference for further studies.
Disclosure
The authors report no conflicts of interest for this work.
References
1. Potoka KP, Gladwin MT. Vasculopathy and pulmonary hypertension in sickle cell disease. Am J Physiol Lung Cell Mol Physiol. 2015;308(4):L314–L324. doi:10.1152/ajplung.00252.2014
2. Piccin A, Murphy C, Eakins E, et al. Insight into the complex pathophysiology of sickle cell anaemia and possible treatment. Eur J Haematol. 2019;102(4):319–330. doi:10.1111/ejh.13212
3. Gladwin TM, Sachdev V. Cardiovascular abnormalities in sickle cell disease. J Am Coll Cardiol. 2012;59:13.
4. Pearson HA. Reply: sickle cell disease in the Kingdom of Saudi Arabia: East and West. Ann Saudi Med. 1999;19:281–282.
5. Oduor H, Minniti CP, Brofferio A, et al. Severe cardiac iron toxicity in two adults with sickle cell disease. Transfusion. 2017;57(3):700–704.
6. Bode-Thomas F, Ogunkunle OO, Omotoso AB. Electrocardiographic and self-paced walking exercise features of Nigerians with sickle cell anaemia at OAUTHC, Ile-Ife. Nig J Med. 2002;11:170–176.
7. Kors JA, van Eck HJ, van Herpen G. The meaning of the Tp-Te interval and its diagnostic value. J Electrocardiol. 2008;41:575–580.
8. Gupta P, Patel C, Patel H, et al. T(p-e)/QT ratio as an index of arrhythmogenesis. J Electrocardiol. 2008;41:567–574.
9. Morita H, Wu J, Zipes DP. The QT syndromes: long and short. Lancet. 2008;372:750–763.
10. Montanez A, Ruskin JN, Hebert PR, et al. Prolonged QTc interval and risks of total and cardiovascular mortality and sudden death in the general population: a review and qualitative overview of the prospective cohort studies. Arch Intern Med. 2004;164(9):943–948. doi:10.1001/archinte.164.9.943
11. Zabel M, Klingenheben T, Franz MR, et al. Assessment of QT dispersion for prediction of mortality or arrhythmic events after myocardial infarction: results of a prospective, long-term follow-up study. Circulation. 1998;97(25):2543–2550. doi:10.1161/01.CIR.97.25.2543
12. Sahu P, Lim PO, Rana BS, et al. QT dispersion in medicine: electrophysiological holy grail or fool’s gold? QJM. 2000;93:425–431. doi:10.1093/qjmed/93.7.425
13. Piccin A, Sartori MT, Bisogno G, et al. New insights into sinusoidal obstruction syndrome. Intern Med J. 2017;47(10):1173–1183. doi:10.1111/imj.13550
14. Friedewald WT, Levy RI, Fredrickson DS. Estimation of the concentration of low-density lipoprotein cholesterol in plasma without use of the preparative ultracentrifuge. Clin Chem. 1972;18:499–502. doi:10.1093/clinchem/18.6.499
15. Famodu AA, Halim NKD, Odoemene DI, et al. Haemorheological changes in sickle cell disease: measurement and significance. Br J Biomed Sci. 1998;55:275.
16. Gordon RJ. Viscosity considerations in the determination of regional circulatory adjustments to anemia. Circ Res. 1972;31:805–812.
17. Oguanobi NI, Onwubere BJ, Ike SO, et al. Electrocardiographic findings in adult Nigerians with sickle cell anaemia. Afr Health Sci. 2010;10:235–241.
18. Liem RI, Young LT, Thompson AA. Prolonged QTc interval in children and young adults with sickle cell disease at steady state. Pediatr Blood Cancer. 2009;52(7):842–846. doi:10.1002/pbc.21973
19. Barr CS, Naas A, Freeman M, et al. QT dispersion and sudden unexpected death in chronic heart failure. Lancet. 1994;343(8893):327–329. doi:10.1016/S0140-6736(94)91164-9
20. Akgul F, Seyfeli E, Melek İ, et al. Increased QT dispersion in sickle cell disease: effect of pulmonary hypertension. Acta Haematol. 2007;118(1):1–6. doi:10.1159/000100929
21. Boga C, Kozanoglu I, Yeral M, et al. Assessment of corrected QT interval in sickle cell disease patients who undergo erythroapheresis. Transfus Med. 2007;17(6):466–472. doi:10.1111/j.1365-3148.2007.00801.x
22. Kilicaslan F, Tokatli A, Ozdag F, et al. Tp-e interval, Tp-e/QT ratio, and Tp-e/QTc ratio are prolonged in patients with moderate and severe obstructive sleep apnea. Pacing Clin Electrophysiol. 2012;35(8):966–972. doi:10.1111/j.1540-8159.2012.03439.x
23. Haarmark C, Hansen PR, Vedel-Larsen E, et al. The prognostic value of the tpeak-tend interval in patients undergoing primary percutaneous coronary intervention for ST-segment elevation myocardial infarction. J Electrocardiol. 2009;42:555–560.
24. Tasolar H, Ballı M, Cetin M, et al. Effects of the coronary collateral circulation on the Tp-e interval and Tp-e/QT ratio in patients with stable coronary artery disease. Ann Noninvasive Electrocardiol. 2015;20:53–61.
25. Platt OS, Brambilla DJ, Rosse WF, et al. Mortality in sickle cell disease. Life expectancy and risk factors for early death [see comments]. N Engl J Med. 1994;330:1639–1644.
26. Wierenga KJJ, Hambleton IR, Lewis NA. Survival estimates for patients with homozygous sickle-cell disease in Jamaica: a clinic-based population study. Lancet. 2001;357(9257):680–683.
27. Sourander L, Rajala T, Räihä I, et al. Cardiovascular and cancer morbidity and mortality and sudden cardiac death in postmenopausal women on oestrogen replacement therapy (ERT). Lancet. 1998;352:1965–1969.
28. Kim YD, Chen B, Beauregard J, et al. 17 beta-estradiol prevents dysfunction of canine coronary endothelium and myocardium and reperfusion arrhythmias after brief ischemia/reperfusion. Circulation. 1996;94:2901–2908.
29. Wang Y, Wang Q, Zhao Y, et al. Protective effects of estrogen against reperfusion arrhythmias following severe myocardial ischemia in rats. Circulation. 2010;74:634–643.
30. Nsiri B, Gritli N, Mazigh C, et al. Fibrinolytic response to venous occlusion in patients with homozygous sickle cell disease. Hematol Cell Ther. 1997;39:229–232.
31. Acar G, Yorgun H, Inci MF, et al. Evaluation of Tp-e interval and Tp-e/QT ratio in patients with ankylosing spondylitis. Mod Rheumatol. 2013.
32. Devaraj S, Xu DY, Jialal I. C-reactive protein increases plasminogen activator inhibitor-1 expression and activity in human aortic endothelial cells: implications for the metabolic syndrome and atherothrombosis. Circulation. 2003;107:398–404.
33. Janse van Rensburg DC, Ker JA, Grant CC, et al. Autonomic impairment in rheumatoid arthritis. Int J Rheum Dis. 2012;15:419–426.
34. Mountantonakis S, Deo R. Biomarkers in atrial fibrillation, ventricular arrhythmias, and sudden cardiac death. Cardiovasc Ther. 2012;30:74–80.
35. Arslan E, Yiginer O, Yavasoglu I, et al. Effect of uncomplicated obesity on QT interval in young men. Pol Arch Med Wewn. 2010;120:209–213.
 © 2020 The Author(s). This work is published and licensed by Dove Medical Press Limited. The full terms of this license are available at https://www.dovepress.com/terms.php and incorporate the Creative Commons Attribution - Non Commercial (unported, v3.0) License.
By accessing the work you hereby accept the Terms. Non-commercial uses of the work are permitted without any further permission from Dove Medical Press Limited, provided the work is properly attributed. For permission for commercial use of this work, please see paragraphs 4.2 and 5 of our Terms.
© 2020 The Author(s). This work is published and licensed by Dove Medical Press Limited. The full terms of this license are available at https://www.dovepress.com/terms.php and incorporate the Creative Commons Attribution - Non Commercial (unported, v3.0) License.
By accessing the work you hereby accept the Terms. Non-commercial uses of the work are permitted without any further permission from Dove Medical Press Limited, provided the work is properly attributed. For permission for commercial use of this work, please see paragraphs 4.2 and 5 of our Terms.