")
Back to Journals » Patient Preference and Adherence » Volume 14
Assessment of Non-Adherence to Oral Metformin and Atorvastatin Therapies: A Cross-Sectional Survey in Piedmont (Italy)
Authors Parente M, Pignata I, Gnavi R , Spadea T , Di Martino M , Baratta F , Brusa P
Received 12 August 2019
Accepted for publication 16 November 2019
Published 14 February 2020 Volume 2020:14 Pages 261—266
DOI https://doi.org/10.2147/PPA.S226206
Checked for plagiarism Yes
Review by Single anonymous peer review
Peer reviewer comments 2
Editor who approved publication: Dr Johnny Chen
Marco Parente,1 Irene Pignata,1 Roberto Gnavi,2 Teresa Spadea,2 Mirko Di Martino,3 Francesca Baratta,1 Paola Brusa1
1Department of Drug Science and Technology, University of Turin, Turin, Italy; 2Epidemiology Unit, ASL TO3, Grugliasco, Italy; 3Department of Epidemiology, Lazio Regional Health Service, Rome, Italy
Correspondence: Paola Brusa
Department of Drug Science and Technology, University of Turin, Via Pietro Giuria 9, Turin 10125, Italy
Tel +39 011 670 66 65
Email [email protected]
Introduction: It is not possible to recover from chronic diseases; however, a healthy lifestyle and correct adherence to therapy can avoid complications and co-morbidities. The aim of this study was the cross-sectional evaluation, by means of a questionnaire, of real-world data on the prevalence of non-adherence to metformin and atorvastatin oral therapies in a sample of patients that attend community pharmacies in the Piedmont Region. The secondary aim was to evaluate the presence of correlations between non-adherence and a number of variables detected by the questionnaire.
Materials and Methods: Data were gathered from face-to-face interviews in six community pharmacies in Piedmont. The questionnaire was divided into two sections: the first included the Morisky, Green and Levine Medication Adherence Questionnaire (MAQ) (to assess therapy adherence); the second included questions on gender, age, level of education and the pharmacy in which the questionnaire was administered. Comparisons between proportions and mean values were performed using the χ 2 test. Modified Poisson regression with robust standard errors was used for multivariate analysis. The level of significance was fixed at 0.05, CI at 95%.
Results: The sample analysed was composed of 408 subjects (receiving either metformin or atorvastatin). According to MAQ, 62 patients were non-adherent (15% of the total cohort). Crude and multivariate analysis did not show any statistically significant correlation between gender, age, level of education and non-adherence. It emerged that there was a correlation between non-adherence and being a customer of two of the pharmacies involved [PR = 3.31 (p=0.028) and PR = 3.11 (p=0.027)].
Conclusions: Community pharmacies can be an appropriate setting to identify non-adherent patients. Therefore, healthcare professionals could realize an integrated and structured intervention to improve adherence. However, MAQ could underestimate the number of non-adherent patients. Further studies to test the association between non-adherence prevalence and being the customer of a specific pharmacy should be performed.
Keywords: community pharmacies, Morisky, Green and Levine Medication Adherence Questionnaire, adherence to therapy
Introduction
It is well known that the impact of chronic diseases on the population is becoming ever more evident. The Italian statistical yearbook reports that a significant portion of the elderly people in Italy is affected by at least one chronic disease.1,2 Although it is well known that it is not possible to recover from these diseases, a healthy lifestyle and correct adherence to therapy can avoid complications and co-morbidities.3 However, correct adherence to therapy is a complex and multifaceted behaviour and most failures in disease treatment arise from inaccurate adherence to therapy.3–5 Even if the definition of non-adherence is well known, no universal and ongoing high impact model has been identified to prevent and quantify this negative behaviour.6 It is estimated that the percentage of people that are non-adherent to oral antidiabetic drugs is 57%4 and that the same figure for lipid-lowering treatments is 53%.7
In Italy, a Legislative Decree8 was designed to promote the role of community pharmacies as a place where patients can access chronic-disease-prevention and drug-adherence services. In this regard, Federfarma Piedmont, the Orders of Pharmacists of Piedmont and the University of Turin have joined forces to create the “Farmacia di Comunità” (Community Pharmacy) project. This project’s aim is to present a new role for community pharmacies in the it-NHS (Italian National Health Service), using a structured intervention-model.9 The intervention-model is composed of three phases:
- pharmacist training in disease, therapy and the administration of questionnaires;
- administration of a questionnaire followed by structured subject/patient counselling. The questionnaires are written in collaboration with experienced epidemiologists, clinicians and community pharmacists;
- evaluation of the impact of the intervention-model.
The “Community Pharmacy” intervention model also includes a number of satellite studies to test the feasibility of the model and analysis techniques. The present study has been performed as one of these pilot studies.
The aim of this study was the cross-sectional evaluation of real-world data on the prevalence of non-adherence to metformin and atorvastatin oral therapies in a sample of patients that attend community pharmacies in the Piedmont Region. The secondary aim was the evaluation of the presence of correlations between non-adherence and a number of variables detected by the questionnaire.
Materials and Methods
The study was designed as a cross-sectional survey. Data were gathered from face-to-face interviews by means of questionnaires10 performed by adequately trained researchers. The interviews were carried out in six community pharmacies in Piedmont (recruited on a voluntary basis) that were chosen from a panel of pharmacies with experience in the gathering of data from questionnaires.
The recruitment period was from April 2016 to May 2017. The patients enrolled were all those that entered one of the pharmacies, that were involved, with an it-NHS prescription of metformin (any dosage), or atorvastatin (any dosage) and that accepted to participate in the study. The two drugs were chosen because of the high prevalence of the two diseases (diabetes and hypercholesterolemia), and the estimated low therapy adherence.6
The questionnaire was divided into two sections:
- The first section included the Morisky, Green and Levine Medication Adherence Questionnaire (MAQ),11 which is a questionnaire consisting of four closed-ended questions. With two positive responses, the subject is considered non-adherent to therapy.
- The second section included questions on gender, age, level of education and the pharmacy in which the questionnaire was administered.
Statistical Methods
PR (prevalence ratio) and the percentage prevalence were the two indicators used for the crude and the multivariate analysis. Prevalence is considered to be the tool that is least affected by overestimation, in cross-sectional studies, when the prevalence of the event studied is elevated (>5%).12 The normality of data distribution was evaluated by performing the Shapiro–Wilk test. Comparisons between proportions and mean values were performed using the χ2 test. Modified Poisson regression with robust standard errors was the model used for multivariate analysis. The level of significance was fixed at 0.05, CI at 95%. Statistical analysis was performed using Stata14 ® (Corp. 2015. Stata Statistical Software: Release 14. College Station, TX: StataCorp LP).
Results
The prevalence of non-adherent subjects taking atorvastatin and the one of those taking metformin was similar [p=0.7]. Therefore, to not decrease the statistical power of the study, data on the two drugs were analysed together.
Descriptive Statistics
The sample analysed was composed of 408 subjects.
The mean age was 69 years with 46% of the subjects being under 70 years old. Forty-one percent of the interviewees were female (Table 1). There were no significant age-group differences between men and women (p=0.9). The levels of education in men and women did not vary (p=0.09), while younger subjects (<70 years old) had a higher level of education than older subjects (p<0.001). Neither age distribution (p=0.529), nor gender (p=0.67) varied across pharmacies, while the distribution of educational level was significantly different (p<0.001).
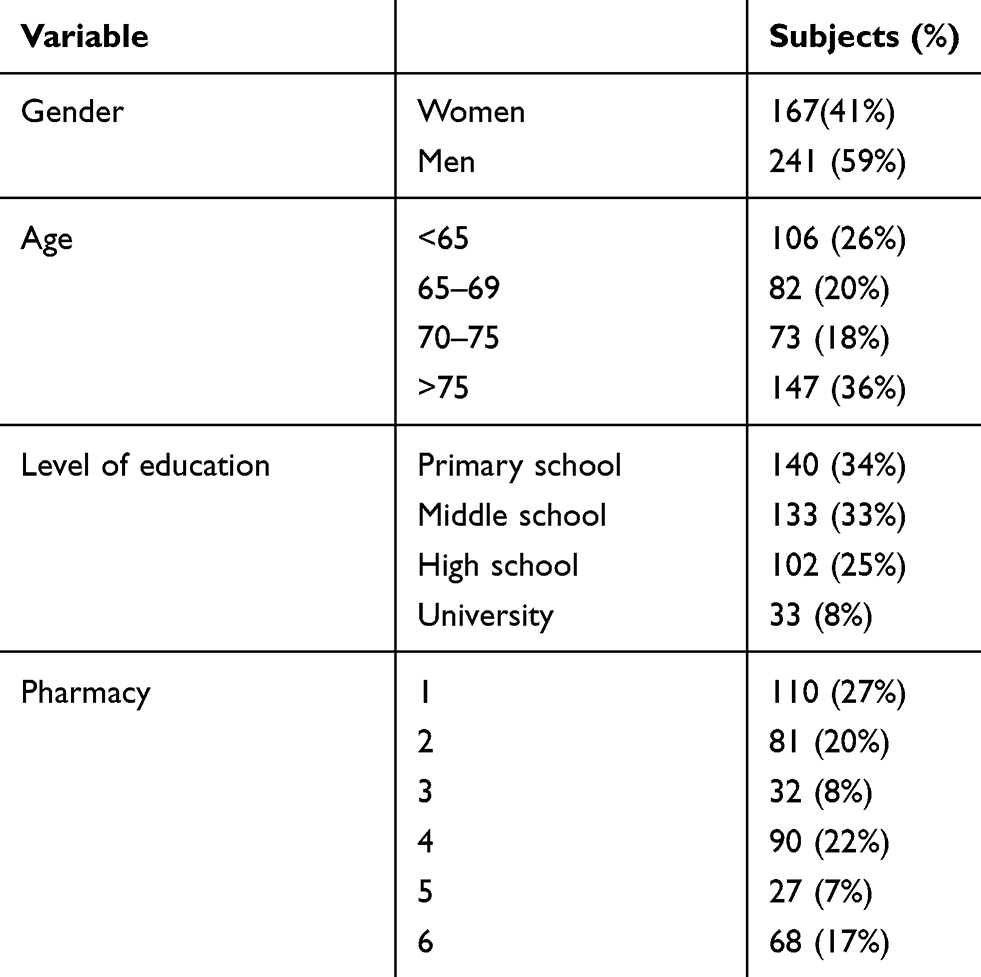 |
Table 1 Population Distribution per Gender, Age, Education and Pharmacies |
One hundred and fifty subjects (37% of the cohort) gave a positive answer to at least one question in the MAQ, and 62 subjects (15%) were considered non-adherent to therapy (with at least two positive answers). Of these, 55 subjects (13% of the cohort) answered “yes” to two questions and 7 (2%) to three.
An analysis of each answer to the MAQ led to the observation that a positive response to question 1 or question 2 was more frequent when the subject was found to be non-adherent to therapy (according to the score). The difference in the prevalence of positive answers in adherents and non-adherents was significant for all items (Table 2).
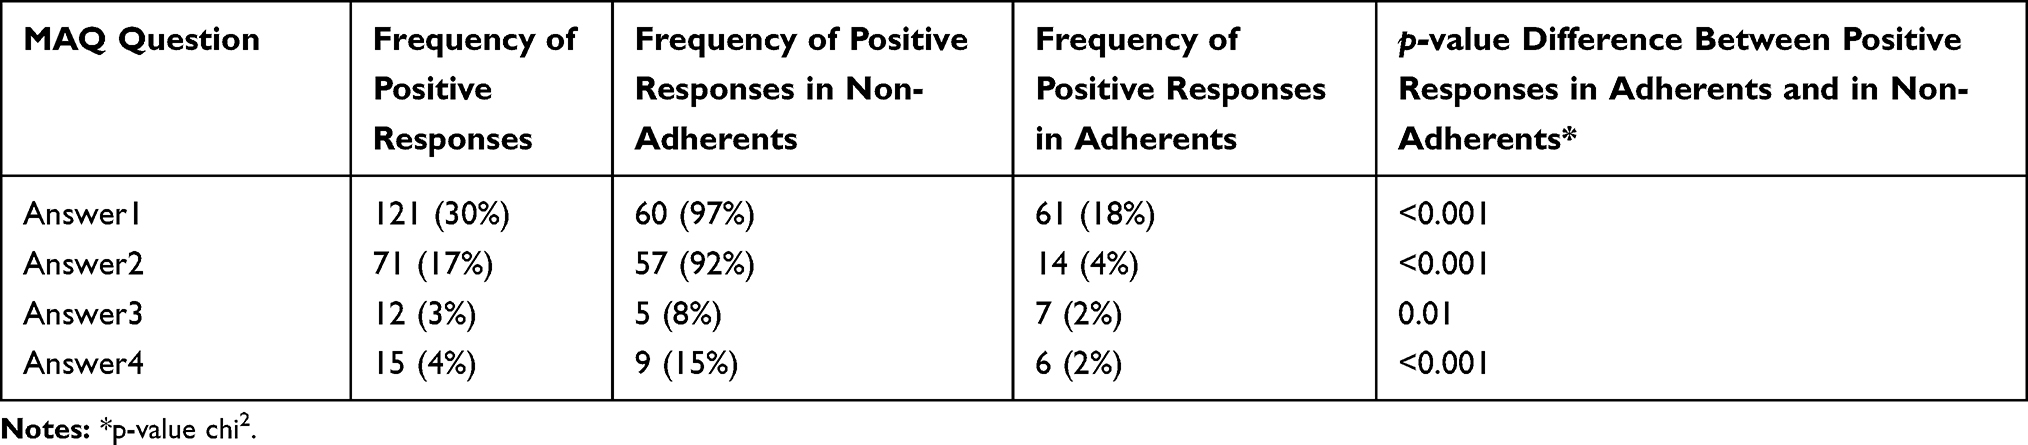 |
Table 2 Frequency of Positive Responses to the MAQ, Sorted by Item |
Each answer was analysed in order to evaluate possible correlations with gender, age, education level and pharmacy (Table 3). As seen in Table 3, there was no correlation between gender, age, education level and pharmacy in positive answers to single items.
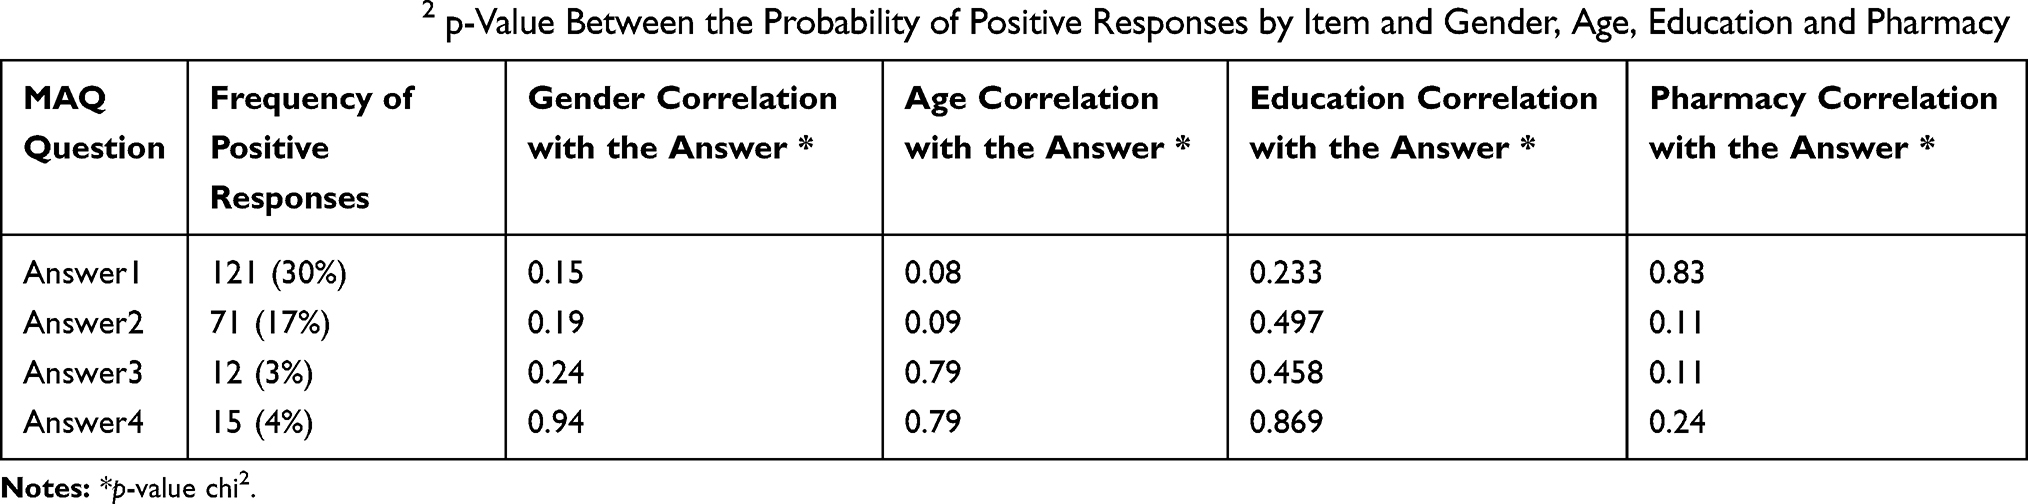 |
Table 3 Correlation by Chi2 p-Value Between the Probability of Positive Responses by Item and Gender, Age, Education and Pharmacy |
Multivariate Analysis
The multivariate analysis confirmed the results of the crude analysis regarding gender, age and level of education: there was no significant correlation between these variables and the increasing prevalence rate of non-adherence (Table 4).
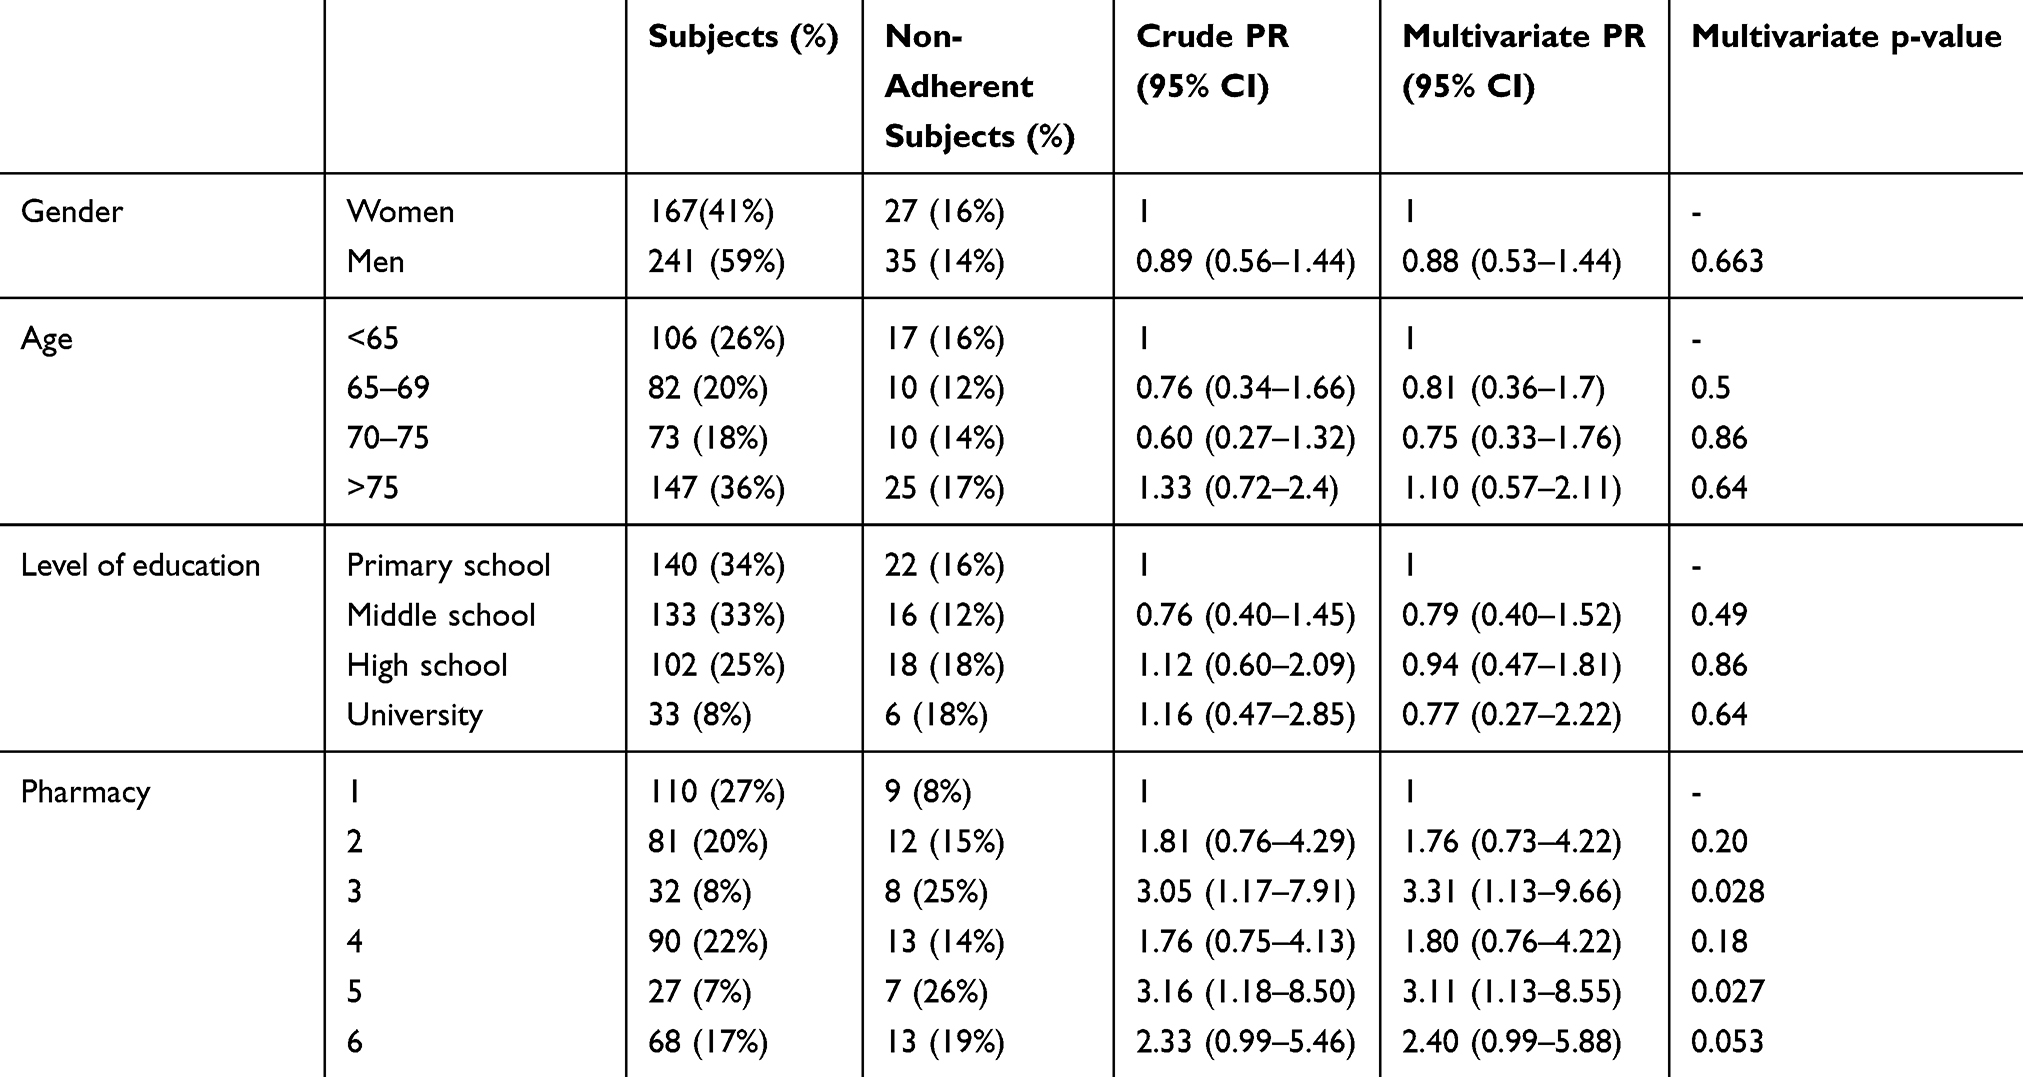 |
Table 4 Crude and Multivariate PR – Poisson Regression Modified with Robust Standard Errors |
It emerged that there was a correlation between non-adherence and being a customer of pharmacies number 3 and 5 [respectively, PR = 3.31 (CI 95% 1.13–9.66; p=0.028) and PR = 3.11 (CI 95% 1.13–8.55; p=0.027)].
Discussions
The results showed that 15% of the patients recruited in the six community pharmacies involved were non-adherent to therapies. This rate is lower than the figure estimated in the literature, which is about 50–60% of non-adherence prevalence for the two drugs investigated.4–7 The underestimated prevalence of non-adherence may be due to a selection bias; patients recruited in pharmacies may be intrinsically more adherent to the baseline than those reported in the literature. There may also be a social desirability bias present: patients are not inclined to declare their non-adherence to a healthcare professional.13 This bias may have led patients to give negative responses in the face-to-face interview simply to avoid judgment by a healthcare professional. In the future, it may be interesting to investigate the extent of the social desirability bias in face-to-face interviews that use the MAQ.
The sample size of the interviewed population was small, therefore the single-answer analysis showed that gender is not correlated with non-adherence to therapy. This type of difference is usually only detectable in large cohorts.14 Furthermore, age did not appear to be associated with non-adherence in this study. This evaluation may be flawed as some variables, such as treatment complexity and the possibility of aid being given by relatives or caregivers, were not considered. Although education level did not appear to be correlated with non-adherence in the present study, literature reports show that a low level of education is strictly related to non-adherence to therapy.15 The absence of this association may be due to the low statistical power of the study or possibly to other non-investigated confounders.
The increased prevalence of non-adherence in association with being the customer of a specific pharmacy is an interesting result. Indeed, our results show that there seems to be an association between the pharmacy in which the questionnaire was administered and the prevalence rate of being non-adherent. More analysis and future studies could be performed to investigate this correlation.
Using a validated questionnaire such as the Morisky-Green-Levine questionnaire, a cross-sectional study was carried out in Italy for the first time, to our knowledge, to assess therapy adherence in chronic patients. Indeed, entering on PubMed the words: “Morisky; pharmacies; chronic; Italy” no items have been found. It is important to underline that only few studies at the international level used pharmacies as a recruiting centre to assess patients’ adherence to therapies. The comparison between these studies and ours is complicated by the significant differences among the national NHSs.16–18
Strengths and Limits of the Study
Face-to-face interviews were used to collect data by a pre-set questionnaire. The data collection was carried out by researchers purposely trained. The pharmacy role to detect non-adherent subjects was highlighted by this data collection method.
Data present in literature suggest significant differences between the adherence to oral treatment for diabetes and the one to oral lipid-lowering treatment.4–7 Clinical practises have observed that diabetic patients perceive their condition as a pathology whereas patients treated with lipid-lowering drugs often do not. The latter are less aware of their pathological condition leading to less care in the adherence. The effect of therapy interruption in this case may not be as immediate as it is for diabetic patients. This effect causes the perception that glucose-lowering drugs are more essential than lipid-lowering drugs.4,19–21
However, in apparent contrast with the data in the literature, the present study highlighted that the prevalence of non-adherence in the two cohorts is similar. Therefore, to increase the statistical power of this study, metformin-treated and atorvastatin-treated subjects were aggregated.
Moreover, the generalisability of the results is not easily definable.
The sociodemographic data of the subjects that did not willing to take part in the study were not collected.
Furthermore, in this pilot study, few factors, possibly responsible for the no adherence, were taken into consideration by the questionnaire. Future studies will be needed to investigate further patient habits and how these factors impact on their adherence to the therapies (such as the number of medications taken, how long patients have been taking the medication, ADR, … ).
This kind of study (cross-sectional survey) does not allow us to evaluate the causal inference about the variables that affect non-adherence. We can only suppose that the correlation found in the present study (non-adherence and being a customer of two of the pharmacies involved) may be present due to the different sociodemographic characteristics of the areas in which the pharmacies are located or to the different expertise of the pharmacists. Further studies are needed to investigate this correlation.
Conclusions
It can be concluded that community pharmacies can be used to identify non-adherent patients. Indeed, 62 non-adherent patients have been identified in the pharmacies involved. Therefore, healthcare professionals could realize an integrated and structured intervention to improve patients’ adherence. Many studies have demonstrated the utility and efficacy of the community pharmacy in improving patients’ adherence.22,23 The structured counselling is the main tool for the community pharmacist to apply to improve patient adherence.24 However, the counselling of the pharmacist has to be built on solid foundations. It is essential that pharmacists be trained to intervene efficiently in different conditions.25 Better results could be achieved if pharmacists would be part of a multidisciplinary team.
However, MAQ used in the community pharmacy setting could underestimate the number of non-adherent patients. Future studies are needed to identify more effective methods for the identification of non-adherent subjects in community pharmacies.
Moreover, this study has also identified a possible correlation between non-adherence prevalence and being the customer of a specific pharmacy. Further studies to test the association between these two variables should be performed. If this association is confirmed, the variable must be taken into consideration in all studies that use community pharmacies as recruiting centres.
Increasing the sample size to grant the statistical power to analyse the two cohorts separately (patients treated with atorvastatin and metformin) is one of the goals for the future.
Ethics Approval
The subjects participated in the study on a voluntary basis and were informed of the characteristics and the purpose of the study. The questionnaire was anonymous. Personal data were not collected and there is no way to trace the answers back to a specific responder. Therefore, according to Italian legislation on the protection of personal data26 no ethical approval was required.
Acknowledgments
The authors thank Federfarma Piedmont and the pharmacies involved. The authors would also like to thank Dr. Lorenzo Ravetto Enri for the support given during the development of the research project. The authors also wish to thank Dr. Claudia Casale, Dr. Alessia Sarvia and Dr. Benedetta Ugonia for their collaboration in the gathering of the data discussed. The paper also benefited from fruitful discussions between Dr. Marco Parente and tutors and colleagues during his Master’s degree in Epidemiology.
Disclosure
The authors report no conflicts of interest in this work.
References
1. Di Martino M. Adherence to long-term therapies and its relevance to epidemiology. Recenti Prog Med. 2017;08(4):165–167.
2. Sistema Statistico Nazionale – Istituto Nazionale di Statistica. Annuario statistico italiano. 2016. Available from: https://www.istat.it/it/files//2016/12/Asi-2016.pdf.
3. Brown MT, Bussell JK. Medication adherence: WHO cares? Mayo Clin Proc. 2011;86(4):304–314. doi:10.4065/mcp.2010.0575
4. Huber AC, Rapold R, Brüngger B, Reich O, Rosemann T. One-year adherence to oral antihyperglycemic medication and risk prediction of patient outcomes for adults with diabetes mellitus: an observational study. Medicine (Baltimore). 2016;95(26):e3994. doi:10.1097/MD.0000000000003994
5. McDonald HP, Garg AX, Haynes RB. Interventions to enhance patient adherence to medication prescriptions: scientific review. JAMA. 2002;288(22):2868–2879. doi:10.1001/jama.288.22.2868
6. WHO. Adherence To Long-Term Therapies - Evidence For Action. 2003. Available from: https://www.who.int/chp/knowledge/publications/adherence_full_report.pdf?ua=1.
7. The Medicines Utilization Monitoring Centre. National Report on Medicines Use in Italy. January-September 2016. Rome: Italian Medicines Agency; 2017.
8. Legislative Decree n. 153 of October 3rd, 2009, Official Gazette of the Italian Republic n. 257.
9. Spadea T, Brusa P, Gnavi R, Mana M, Giaccone M, Costa G. Community pharmacy; towards a new model. Recenti Prog Med. 2017;108(4):168–171. doi:10.1701/2681.27451
10. Heerwegh D. Mode differences between face-to-face and web surveys: an experimental investigation of data quality and social desirability effects. Int J Public Opin Res. 2009;21(1):111–121. doi:10.1093/ijpor/edn054
11. Morisky DE, Green LW, Levine DM. Concurrent and predictive validity of a self-reported measure of medication adherence. Med Care. 1986;24(1):67–74. doi:10.1097/00005650-198601000-00007
12. Zocchetti C, Consonni D, Bertazzi PA. Relationship between prevalence rate ratios and odds ratios in cross-sectional studies. Int J Epidemiol. 1997;26(1):220–223. doi:10.1093/ije/26.1.220
13. Mooney AC, Campbell CK3, Ratlhagana MJ, et al. Beyond social desirability bias: investigating inconsistencies in self-reported HIV testing and treatment behaviors among HIV-positive adults in North West Province, South Africa. AIDS Behav. 2018;22(7):2368–2379. doi:10.1007/s10461-018-2155-9
14. Lyon A, Jackson EA, Kalyani RR, Vaidya D, Kim C. Sex-specific differential in risk of diabetes-related macrovascular outcomes. Curr Diab Rep. 2015;15(11):85. doi:10.1007/s11892-015-0662-x
15. Valencia WM, Florez H. Pharmacological treatment of diabetes in older people. Diabetes Obes Metab. 2014;16(12):1192–1203. doi:10.1111/dom.12362
16. Jüngst C, Gräber S, Simons S, Wedemeyer H, Lammert F. Medication adherence among patients with chronic diseases: a survey-based study in pharmacies. QJM. 2019;112(7):505–512. doi:10.1093/qjmed/hcz058
17. Janežič A, Locatelli I, Kos M, Leroyer C. Criterion validity of 8-item Morisky medication adherence scale in patients with asthma. PLoS One. 2017;12(11):e0187835. doi:10.1371/journal.pone.0187835
18. Molitorisová M, Kotlářová J, Snopková M, Waczulíková I. Support of medication adherence by community pharmacists in Czech and Slovak Republics: a questionnaire survey study. Eur Pharm J. 2018;65(1):15–23. doi:10.1515/afpuc-2017-0006
19. Haddad C, Hallit S, Salhab M. Association between adherence to statins, illness perception, treatment satisfaction, and quality of life among lebanese patients. J Cardiovasc Pharmacol Ther. 2018;23(5):414–422. doi:10.1177/1074248418769635
20. de Vries ST, Keers JC, Visser R. Medication beliefs, treatment complexity, and non-adherence to different drug classes in patients with type 2 diabetes. J Psychosom Res. 2014;76(2):134–138. doi:10.1016/j.jpsychores.2013.11.003
21. Phatak HM, Thomas J. Relationships between beliefs about medications and nonadherence to prescribed chronic medications. Ann Pharmacother. 2006;40(10):1737–1742. doi:10.1345/aph.1H153
22. Singleton J, Veach S, Catney C, Witry M. Analysis of a community pharmacy intervention to improve low adherence rates to oral diabetes medications. Pharmacy. 2017;19;5(4). doi:10.3390/pharmacy5040058.
23. Presley B, Groot W, Pavlova M. Pharmacy-led interventions to improve medication adherence among adults with diabetes: a systematic review and meta-analysis. Res Social Adm Pharm. 2019;15(9):1057–1067. doi:10.1016/j.sapharm.2018.09.021
24. Centro Nazionale per la Prevenzione delle Malattie e la Promozione della Salute, Istituto Superiore di Sanità Il farmacista e le competenze di base del counselling. Una figura chiave per l’adozione di stili di vita salutari. [ITALIAN]. Available from https://www.epicentro.iss.it/guadagnare-salute/comunicazione/materiali/192018_364%20all.1.pdf.
25. Stokes M, Reyes C, Xia Y, Alas V, Goertz HP, Boulanger L. Impact of pharmacy channel on adherence to oral oncolytics. BMC Health Serv Res. 2017;17:414. doi:10.1186/s12913-017-2373-2
26. GARANTE PER LA PROTEZIONE DEI DATI PERSONALI. DELIBERAZIONE 5 maggio 2011. Linee guida in tema di trattamento di dati per lo svolgimento di indagini di customer satisfaction in ambito sanitario. Deliberazione n. 182 - Official Gazette of the Italian Republic n. 120, May 25th, 2011. [ITALIAN]).
 © 2020 The Author(s). This work is published and licensed by Dove Medical Press Limited. The full terms of this license are available at https://www.dovepress.com/terms.php and incorporate the Creative Commons Attribution - Non Commercial (unported, v3.0) License.
By accessing the work you hereby accept the Terms. Non-commercial uses of the work are permitted without any further permission from Dove Medical Press Limited, provided the work is properly attributed. For permission for commercial use of this work, please see paragraphs 4.2 and 5 of our Terms.
© 2020 The Author(s). This work is published and licensed by Dove Medical Press Limited. The full terms of this license are available at https://www.dovepress.com/terms.php and incorporate the Creative Commons Attribution - Non Commercial (unported, v3.0) License.
By accessing the work you hereby accept the Terms. Non-commercial uses of the work are permitted without any further permission from Dove Medical Press Limited, provided the work is properly attributed. For permission for commercial use of this work, please see paragraphs 4.2 and 5 of our Terms.