")
Back to Journals » International Journal of General Medicine » Volume 14
Assessment of Computed Tomography-Defined Muscle and Adipose Tissue Features in Relation to Length of Hospital Stay and Recurrence of Hypertriglyceridemic Pancreatitis
Authors Yu H, Huang Y, Chen L, Shi L, Yang Y, Xia W
Received 15 March 2021
Accepted for publication 16 April 2021
Published 5 May 2021 Volume 2021:14 Pages 1709—1717
DOI https://doi.org/10.2147/IJGM.S311118
Checked for plagiarism Yes
Review by Single anonymous peer review
Peer reviewer comments 4
Editor who approved publication: Dr Scott Fraser
Huajun Yu, 1 Yingbao Huang, 2 Lifang Chen, 2 Liuzhi Shi, 3 Yunjun Yang, 2 Weizhi Xia 4
1Department of Pancreatitis Center, The First Affiliated Hospital of Wenzhou Medical University, Wenzhou, People’s Republic of China; 2Department of Radiology, The First Affiliated Hospital of Wenzhou Medical University, Wenzhou, People’s Republic of China; 3Department of Clinical Laboratory, The First Affiliated Hospital of Wenzhou Medical University, Wenzhou, People’s Republic of China; 4Department of Radiology, The Second Affiliated Hospital of Wenzhou Medical University, Wenzhou, People’s Republic of China
Correspondence: Weizhi Xia
Department of Radiology, The Second Affiliated Hospital of Wenzhou Medical University, Xue Yuan Xi Lu 109, Lucheng District, Wenzhou, 325000, People’s Republic of China
Email [email protected]
Background: Analytic morphometric assessment has recently been proposed to be applied to the study of acute pancreatitis (AP). However, the relationship between body composition and the outcomes of hypertriglyceridemic pancreatitis (HTGP) is still unclear. The aim of this study was to evaluate body composition in relation to the length of hospital stay (LOS) and recurrence of HTGP.
Methods: Patient characteristics, admission examination data, body composition parameters, LOS, and recurrence within 1 year were collected from the institutional pancreatitis database and follow-up records. Logistic regression analysis was used to identify risk factors for LOS and recurrence of HTGP.
Results: Of the 196 included patients, 158 (80.6%) were men and 53 (27.0%) were sarcopenic. The average LOS was 15.83± 10.02 days. The recurrence rate of HTGP was 36.7%. Multivariate analysis with multiple linear regression suggested that subcutaneous adipose tissue (SAT) area (p=0.019) and high-density lipoprotein-cholesterol (HDL-C) (p=0.001) were independently associated with the LOS for HTGP after adjusting for age and sex. The multivariate adjusted hazard ratios for SAT area and HDL-C, with respect to the relationship between body parameters and LOS, were 1.008 (95% confidence interval [CI], 1.001– 1.015) and 0.090 (95% CI, 0.022– 0.361), respectively. No significant differences were observed between the AP and recurrent AP (RAP) groups in terms of characteristics, admission examination data, and body composition parameters.
Conclusion: SAT area and HDL-C are associated with LOS in patients with HTGP. The body composition of patients at the first symptom onset of HTGP cannot predict recurrence.
Keywords: hypertriglyceridemic pancreatitis, recurrent pancreatitis, length of hospital stay, body composition, subcutaneous adipose tissue
Corrigendum for this paper has been published
Introduction
Acute pancreatitis (AP), a common inflammatory disease, progresses to organ dysfunction in 10% to 20% of patients, with increasing incidence and a high mortality rate.1–4 The most common etiologies of AP are gallstones and alcoholism.2 Notably, hypertriglyceridemic pancreatitis (HTGP), which accounts for up to 10% of AP cases, occurs in the presence of hypertriglyceridemia with no signs of other causes.5 Recent reports have indicated that the incidence of HTGP in Asia is increasing,3,6 and is higher than that reported in Western countries,7 which and ranked as the third leading cause for AP.8
Most studies of AP did not classify the etiological patterns. Different etiologies have different pathophysiological mechanisms.9 Gallstone induced pancreatitis is caused by duct obstruction by gallstone migration. Duct obstruction promotes pancreatitis by increasing duct pressure and subsequent unregulated activation of digestive enzymes.10 While, it is generally believed that the pathophysiology of HTGP is that the free fatty acids’ deposition, hydrolyzed by pancreatic lipase from TG, facilitates the occurrence of the disease. The fatty acids can be bound to serum albumin. Whereas, it would play a detergent-like role if exceeded, and attack platelets, vascular endothelium, and acinar cells.7,11 Previous studies have shown that the prognosis and severity of AP seem to vary depending on etiology.9 HTGP is associated with more complications, a longer and more severe disease, and a higher recurrence rate.7,12,13 Therefore, it is important to distinguish the etiology of AP.
As we know, HTGP patients are usually associated with obesity and other metabolic complications, there is a higher chance for HTGP patients to have more fat tissue.14 Obesity is a well-known risk factor for AP that can exacerbate inflammation.4,15–20 A meta-analysis showed that obesity is associated with local complications, organ failure, and high mortality in patients with AP.21 However, most studies did not distinguish between visceral adipose tissue (VAT) and subcutaneous adipose tissue (SAT). The study of fat distribution is crucial to understanding the metabolic implications of excess adiposity.22–25 Computed tomography (CT) is a reliable method for the analysis of fat distribution and the measurement of adipose tissues.26 The aim of the present study was to assess the impact of body composition on the length of hospital stay (LOS) and risk of recurrence of HTGP.
Methods
Study Population
We retrospectively evaluated consecutive patients with HTGP who were admitted to our pancreatitis center between September 2016 and August 2019. The diagnosis of AP was made if at least two of the following three features were present: (1) acute abdominal pain, (2) serum amylase and/or lipase levels three or more times the upper limit of normal, and (3) evidence of pancreatitis on abdominal imaging.27 The diagnosis of HTGP was confirmed if patients had AP with serum total triglyceride (TG) >11.3 mmol/L (1000 mg/dL), or a serum TG level of 5.65–11.3 mmol/L accompanied by chylous serum and the absence of other risk factors for AP.5 The exclusion criteria were (1) indication of biliary, alcoholic, autoimmune, drug-induced or pancreatic tumor-related etiology of AP; (2) poor CT imaging of the abdomen; (3) pregnancy. This study was performed with approval from the ethics committee of the First Affiliated Hospital of Wenzhou Medical University (KY2019–011).
Clinical Data
Clinical data such as age, sex, body mass index (BMI), umbilical waist circumference (WC), pre-existing comorbidity (including hypertension, diabetes mellitus, and alcoholism), and admission laboratory test data (including Triglycerides [TG], total cholesterol, high-density lipoprotein-cholesterol [HDL-C], and low-density lipoprotein-cholesterol [LDL-C]) were retrospectively collected. The outcomes were LOS and recurrence (defined as hospital admission within 1 year after discharge).
Anthropometric Measurements by CT Image Analysis
All patients in this study underwent abdominal CT within 1 week of symptom onset for the quantitative assessment of body composition. CT scanning was performed by Aquilion ONE 320 Slice CT scanner (Toshiba, Japan) or 64-slice spiral CT scanner (Lightspeed VCT, GE Healthcare, USA). The slice thickness was 0.5 mm for the 320 Slice CT scanner (single-turn spiral time 0.5 s, 100 kV, 300 mA) and 0.625 mm for 64-slice spiral CT scanner (pitch 0.984, single-turn spiral time 0.5 s, 100 kV, 500 mA). For contrast-enhanced CT, 60mL of nonionic contrast agent (Ultravist 370; Bayer Schering Pharma, Berlin, Germany) was injected via the cubital vein with a high-pressure syringe at a rate of 4.0 mL/s; thereafter, 30 mL saline was administered at the same rate. The scanning was triggered intelligently by monitoring of the abdominal aorta, the arterial phase was delayed for 30–35 s, and the portal phase was delayed for 60–70s. Body composition parameters were measured based on the unenhanced CT scanning. Two experienced radiologists (with 5 years of imaging experience), who were blinded to the patients’ clinical data, analyzed the CT images using a post processing station (GE Healthcare Advantage Workstation, version 4.6) with the axial image at the level of the L3 vertebra. Re-measurement took place when disagreement of the measurements occurred. The predetermined Hounsfield unit (HU) thresholds were −29 to 150 HU for abdominal muscle area, −30 to −190 HU for SAT, and −50 to 150 HU for VAT (Figure 1). Sarcopenia was defined using predetermined sex-specific abdominal muscle area cut-off values: 52.4 cm2/m2 for men and 38.5 cm2/m2 for women.28
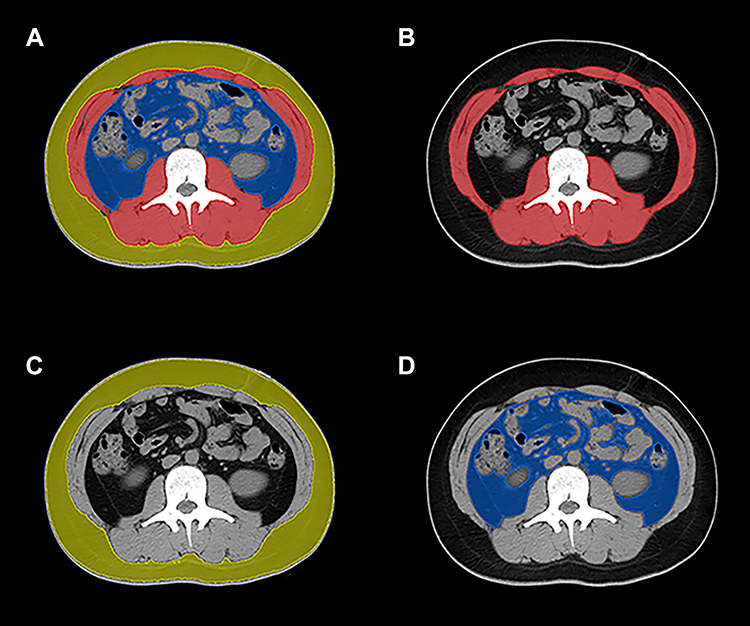 |
Figure 1 CT quantify body composition at the level of L3 vertebral (A). Abdominal muscle area is highlighted in red (B), SAT area in yellow (C), and VAT area in blue (D). |
Statistical Analyses
Statistical analyses were performed using SPSS (version 26.0; IBM Corp., Armonk, NY, USA). We used the Kolmogorov–Smirnov test to assess whether the variables were normally distributed. Student’s-test and the nonparametric Mann–Whitney U-test were used for comparisons of continuous variables. Categorical variables were analyzed using Pearson’s chi-square and Fisher’s exact tests. Continuous variables are expressed as mean± standard deviation, and categorical variables are presented as percentages. Logistic regression analysis was used to identify the risk factors. Probability values at P < 0.05 indicated statistical significance.
Results
Characteristics of Subjects
A total of 196 patients were considered eligible for the study (158 men and 38 women; mean age, 40.52±9.72 years). Men accounted for 80.6% of all patients. The average LOS was 15.83±10.02 days. The recurrence rate of HTGP was 36.7%. According to predefined sex-specific cutoff values,28 53 patients (27%) were sarcopenic. The baseline demographic characteristics, clinical characteristics, and body composition of patients with HTGP are summarized in Table 1.
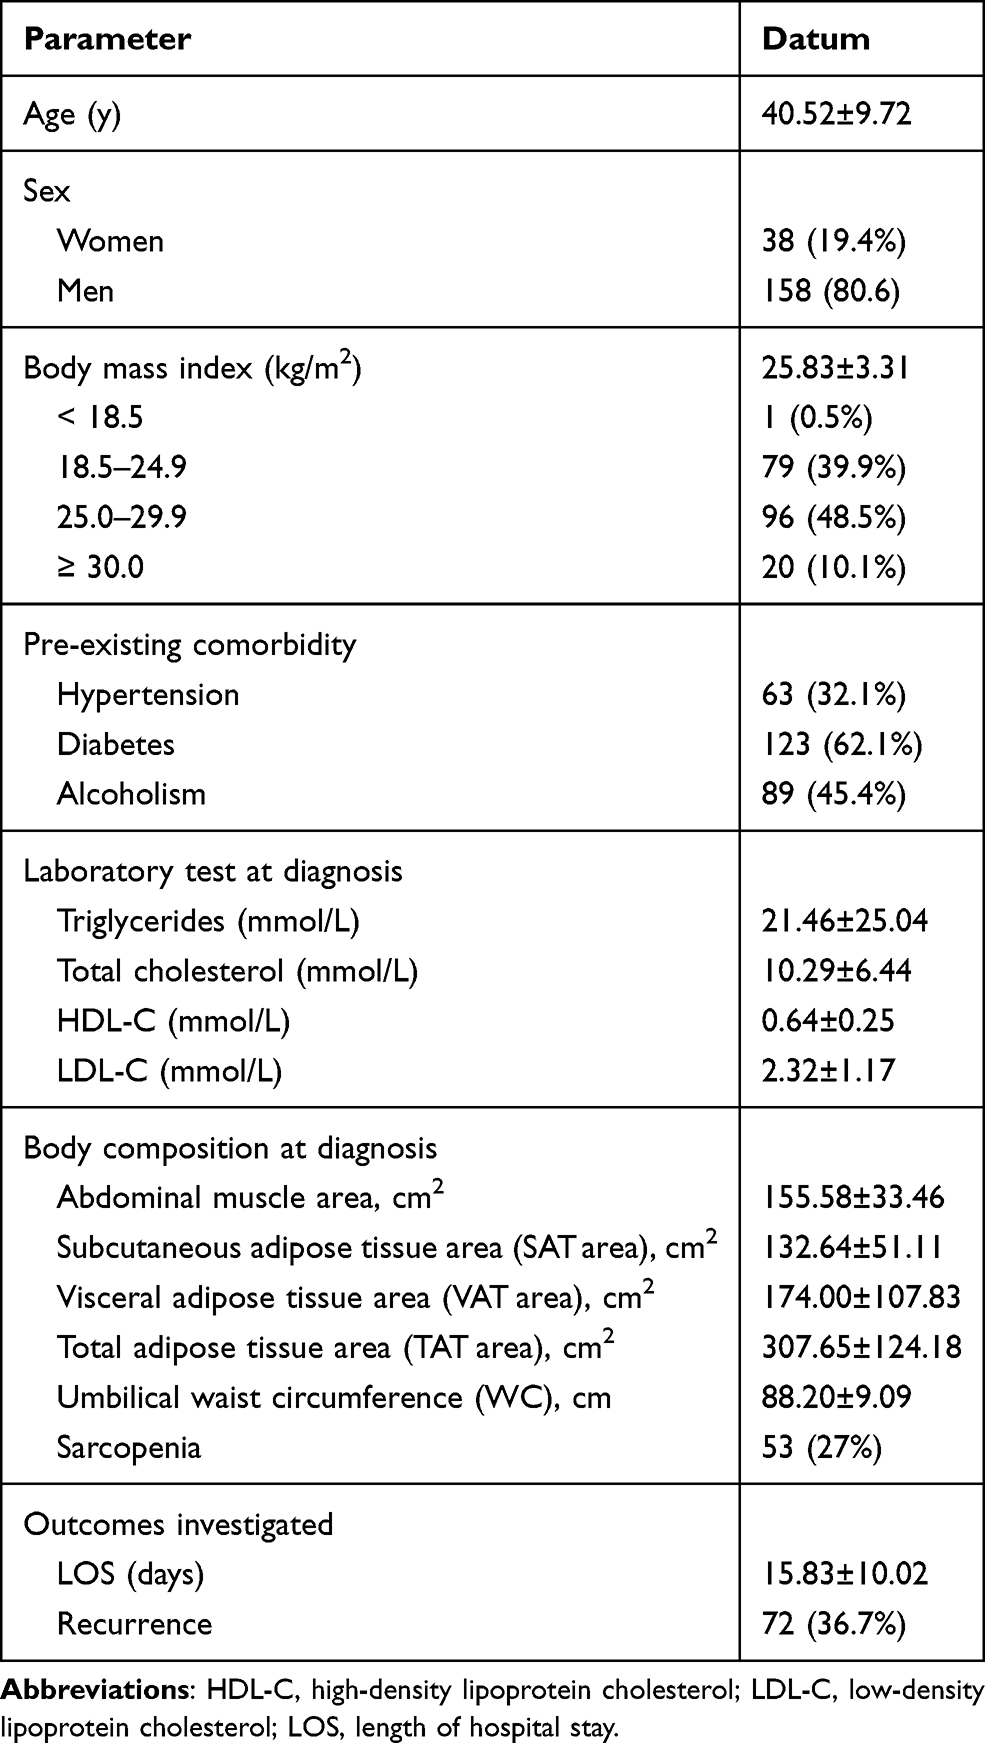 |
Table 1 Baseline Demographic and Characteristics of 196 Patients Who Underwent CT for HTGP |
Comparisons of Characteristics According to LOS
The LOS was dichotomized at 14 days, based on the median LOS of the entire population. Patients in the short LOS group (≤14 days) and those in the long LOS group (>14 days) were compared to evaluate the association between LOS and demographic characteristics, clinical characteristics, and body composition (Table 2). The short and long LOS groups comprised 94 and 102 patients, respectively. No statistical difference was observed with respect to age, sex, BMI, and pre-existing comorbidity (hypertension, diabetes mellitus, or alcoholism) between the two groups (all p>0.05). Patients in the long LOS group presented higher total cholesterol (11.15±7.00 vs 9.36±5.66 mmol/L, p=0.043) and TG (24.76±27.20 vs 17.87±22.5 mmol/L, p=0.021). The mean HDL-C level of patients with long LOS was lower than that of patients with short LOS (0.57±0.24 vs 0.72±0.24 mmol/L, p < 0.001) (Figure 2A). A significant association between LOS and individual SAT area was observed. SAT area was significantly higher in the long LOS group than in the short LOS group (142.77±50.57 vs 121.64±49.65 p=0.001) (Figure 2B). Other body composition parameters, including abdominal muscle area, VAT, Total adipose tissue area (TAT area), Umbilical waist circumference (WC), and sarcopenia, were also similar between the two groups (all p>0.05). Multivariate analysis with multiple linear regression suggested that SAT area (p=0.019) and HDL-C (p=0.001) were independently associated with the LOS for HTGP after adjusting for age and sex (Table 3).
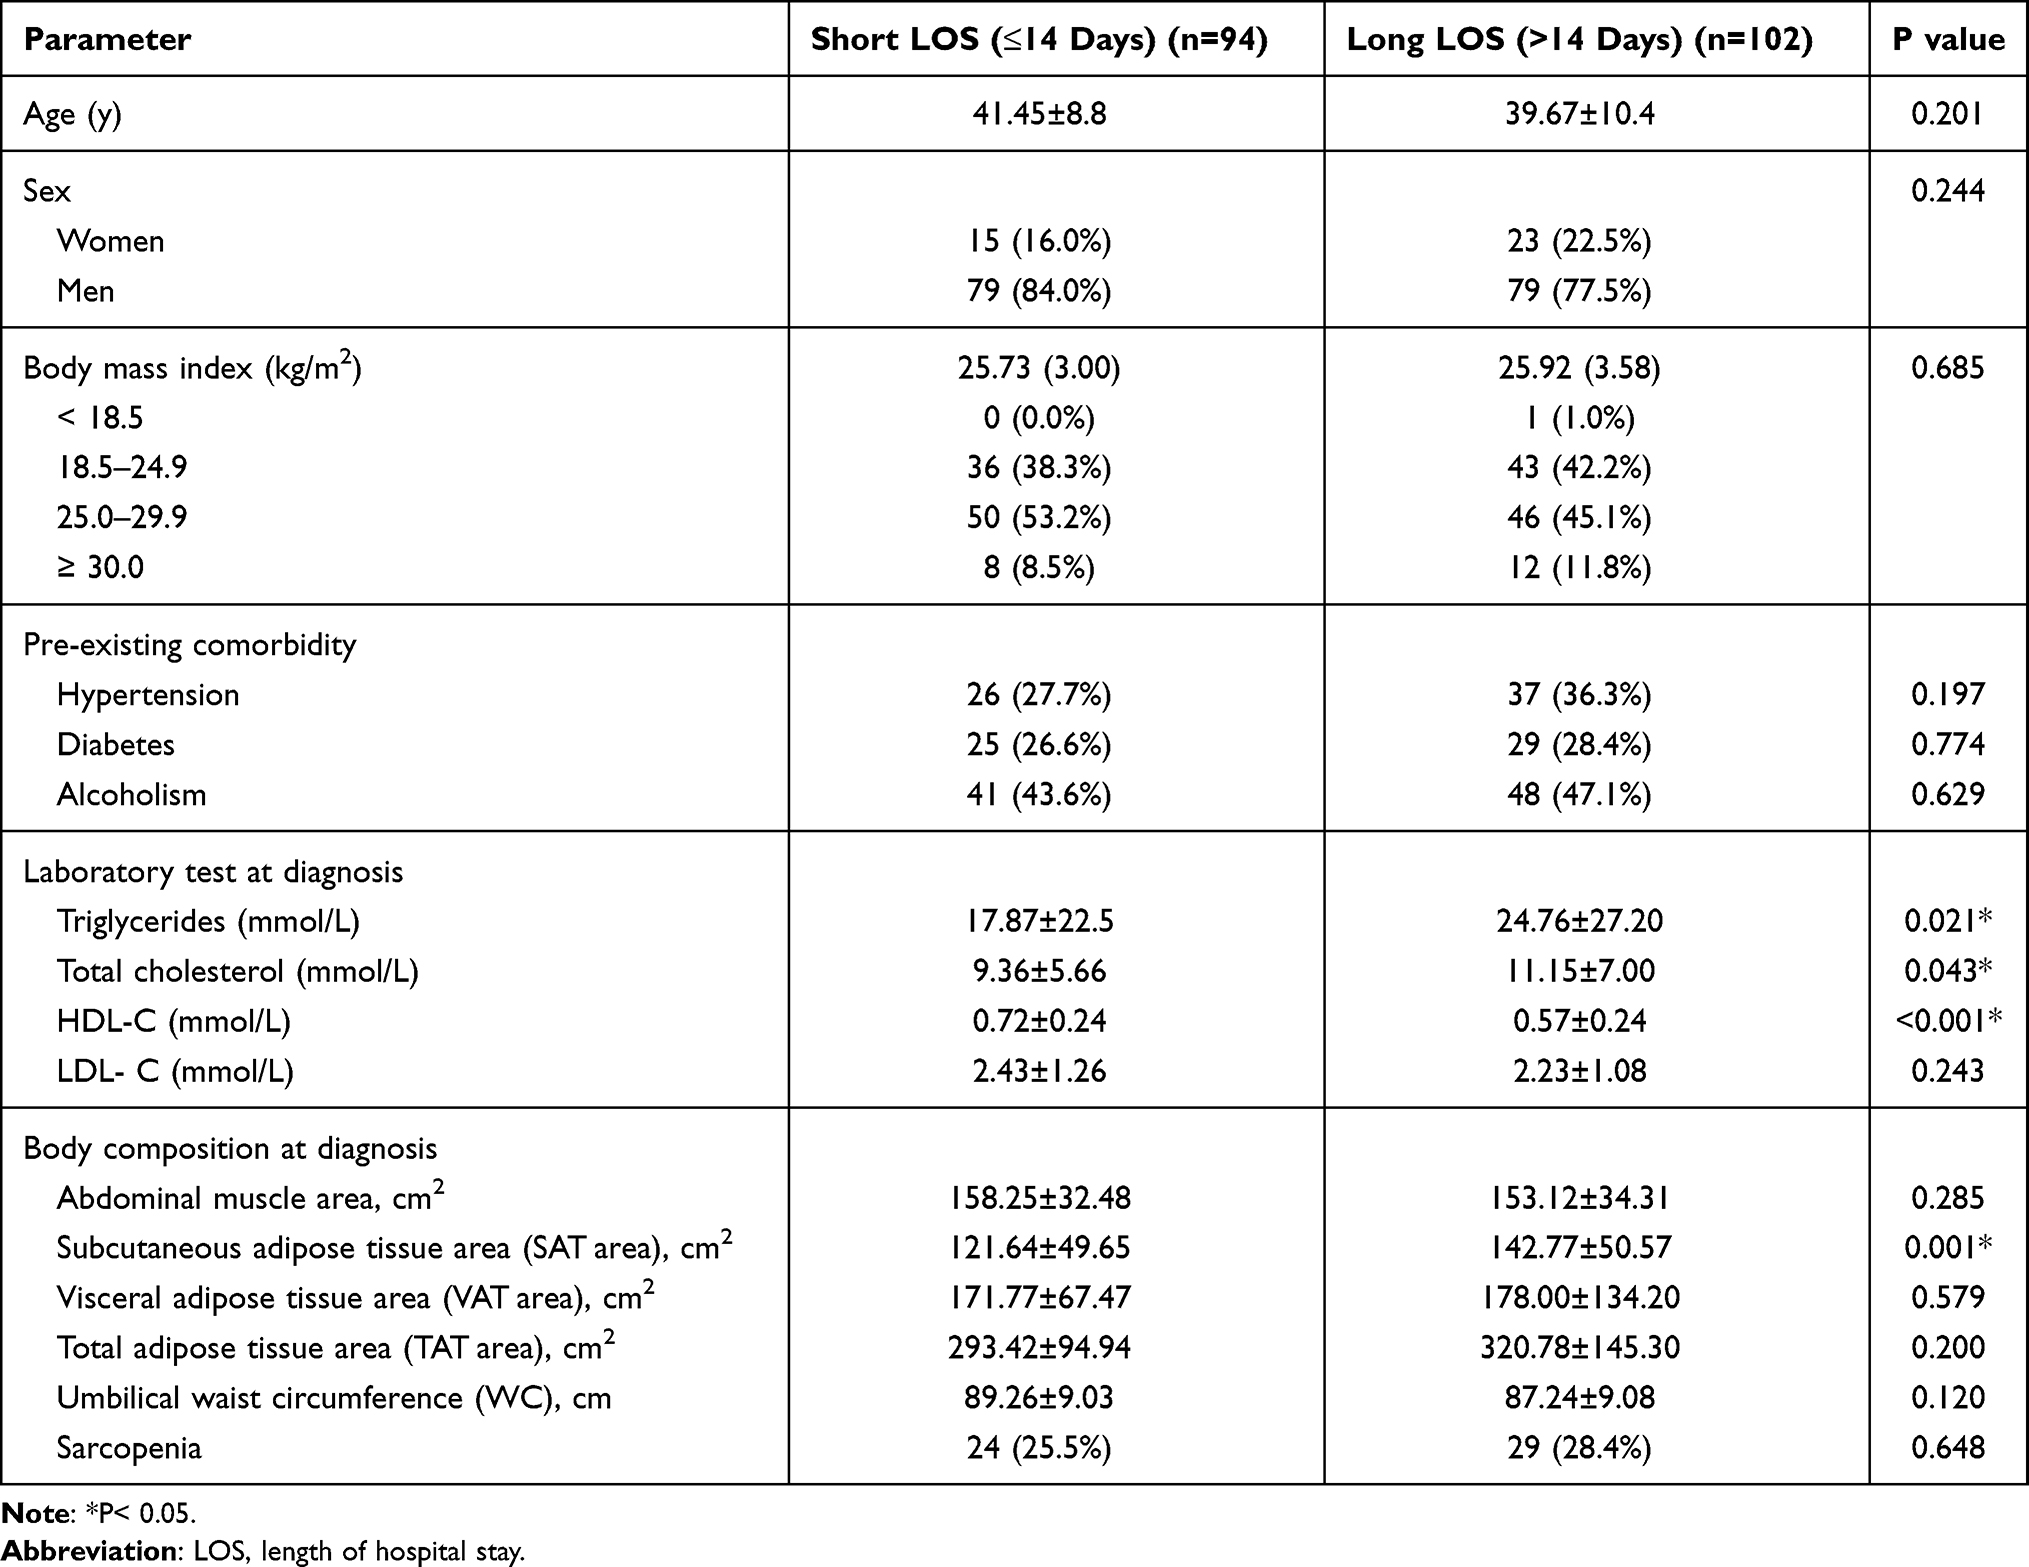 |
Table 2 Comparison of Baseline Characteristics Between Short LOS (≤14 Days) and Long LOS (>14 Days) Groups |
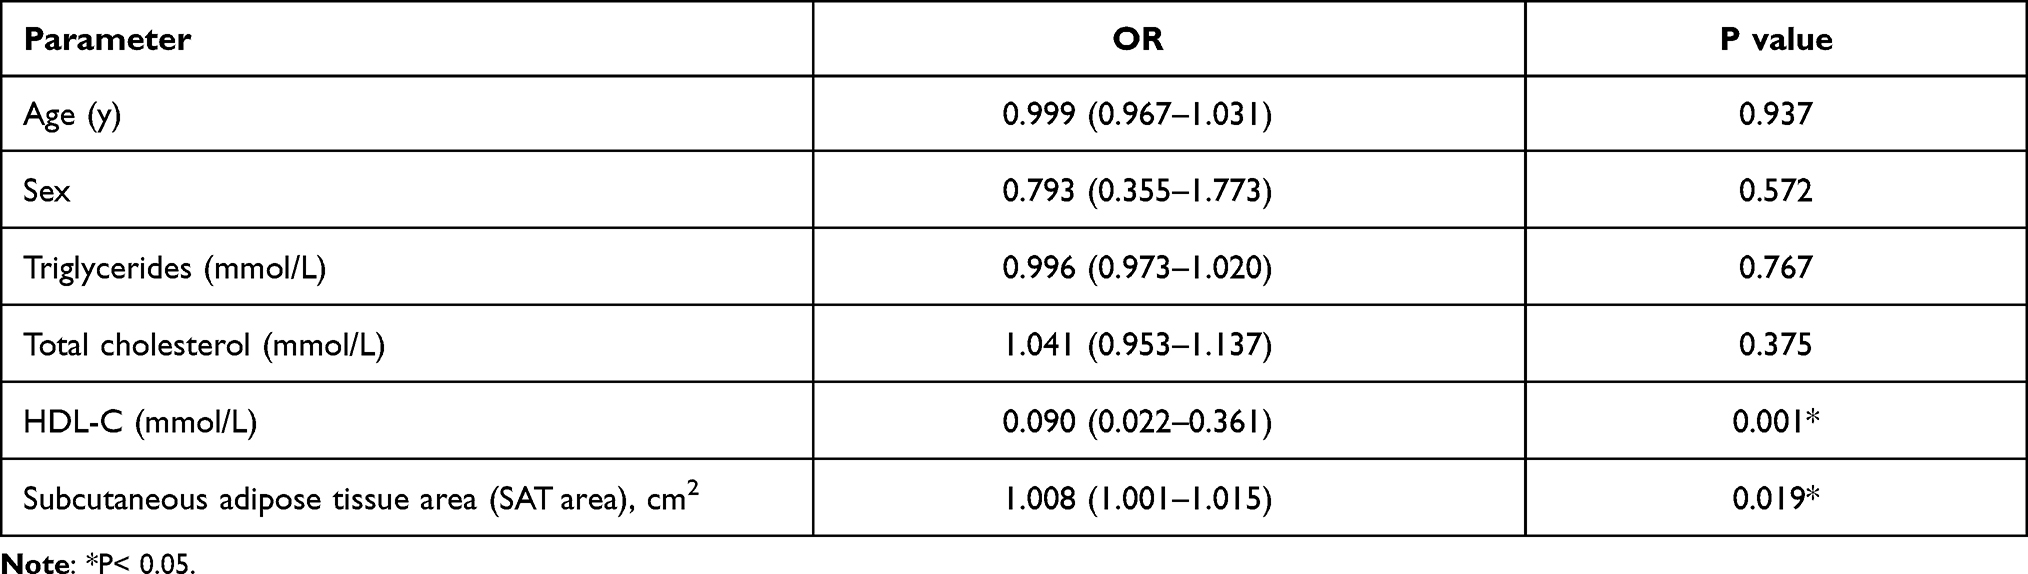 |
Table 3 Multivariate Analyses of Risk Factors for LOS of HTGP |
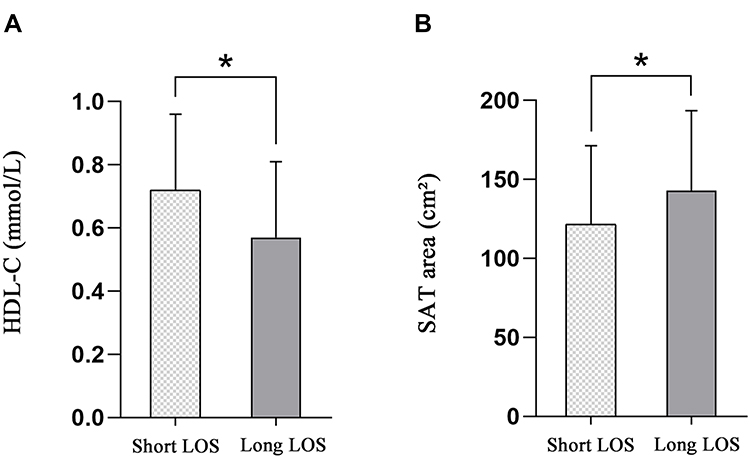 |
Figure 2 HDL-C is significantly lower in the long LOS group compared to the short LOS group(A). SAT area is significantly higher in the long LOS group compared to the short LOS group (B).*P< 0.05. |
Comparisons of Characteristics According to AP Recurrence
No significant differences were observed between the AP and RAP groups in age, sex, BMI, and pre-existing comorbidity (hypertension, diabetes mellitus, or alcoholism). The laboratory test values for TG, total cholesterol, HDL-C, and LDL-C were not significantly different between the two groups. The body composition parameters abdominal muscle area, SAT, VAT and TAT, as well as WC and sarcopenia, were not significantly different between the two groups (all p>0.05) (Table 4).
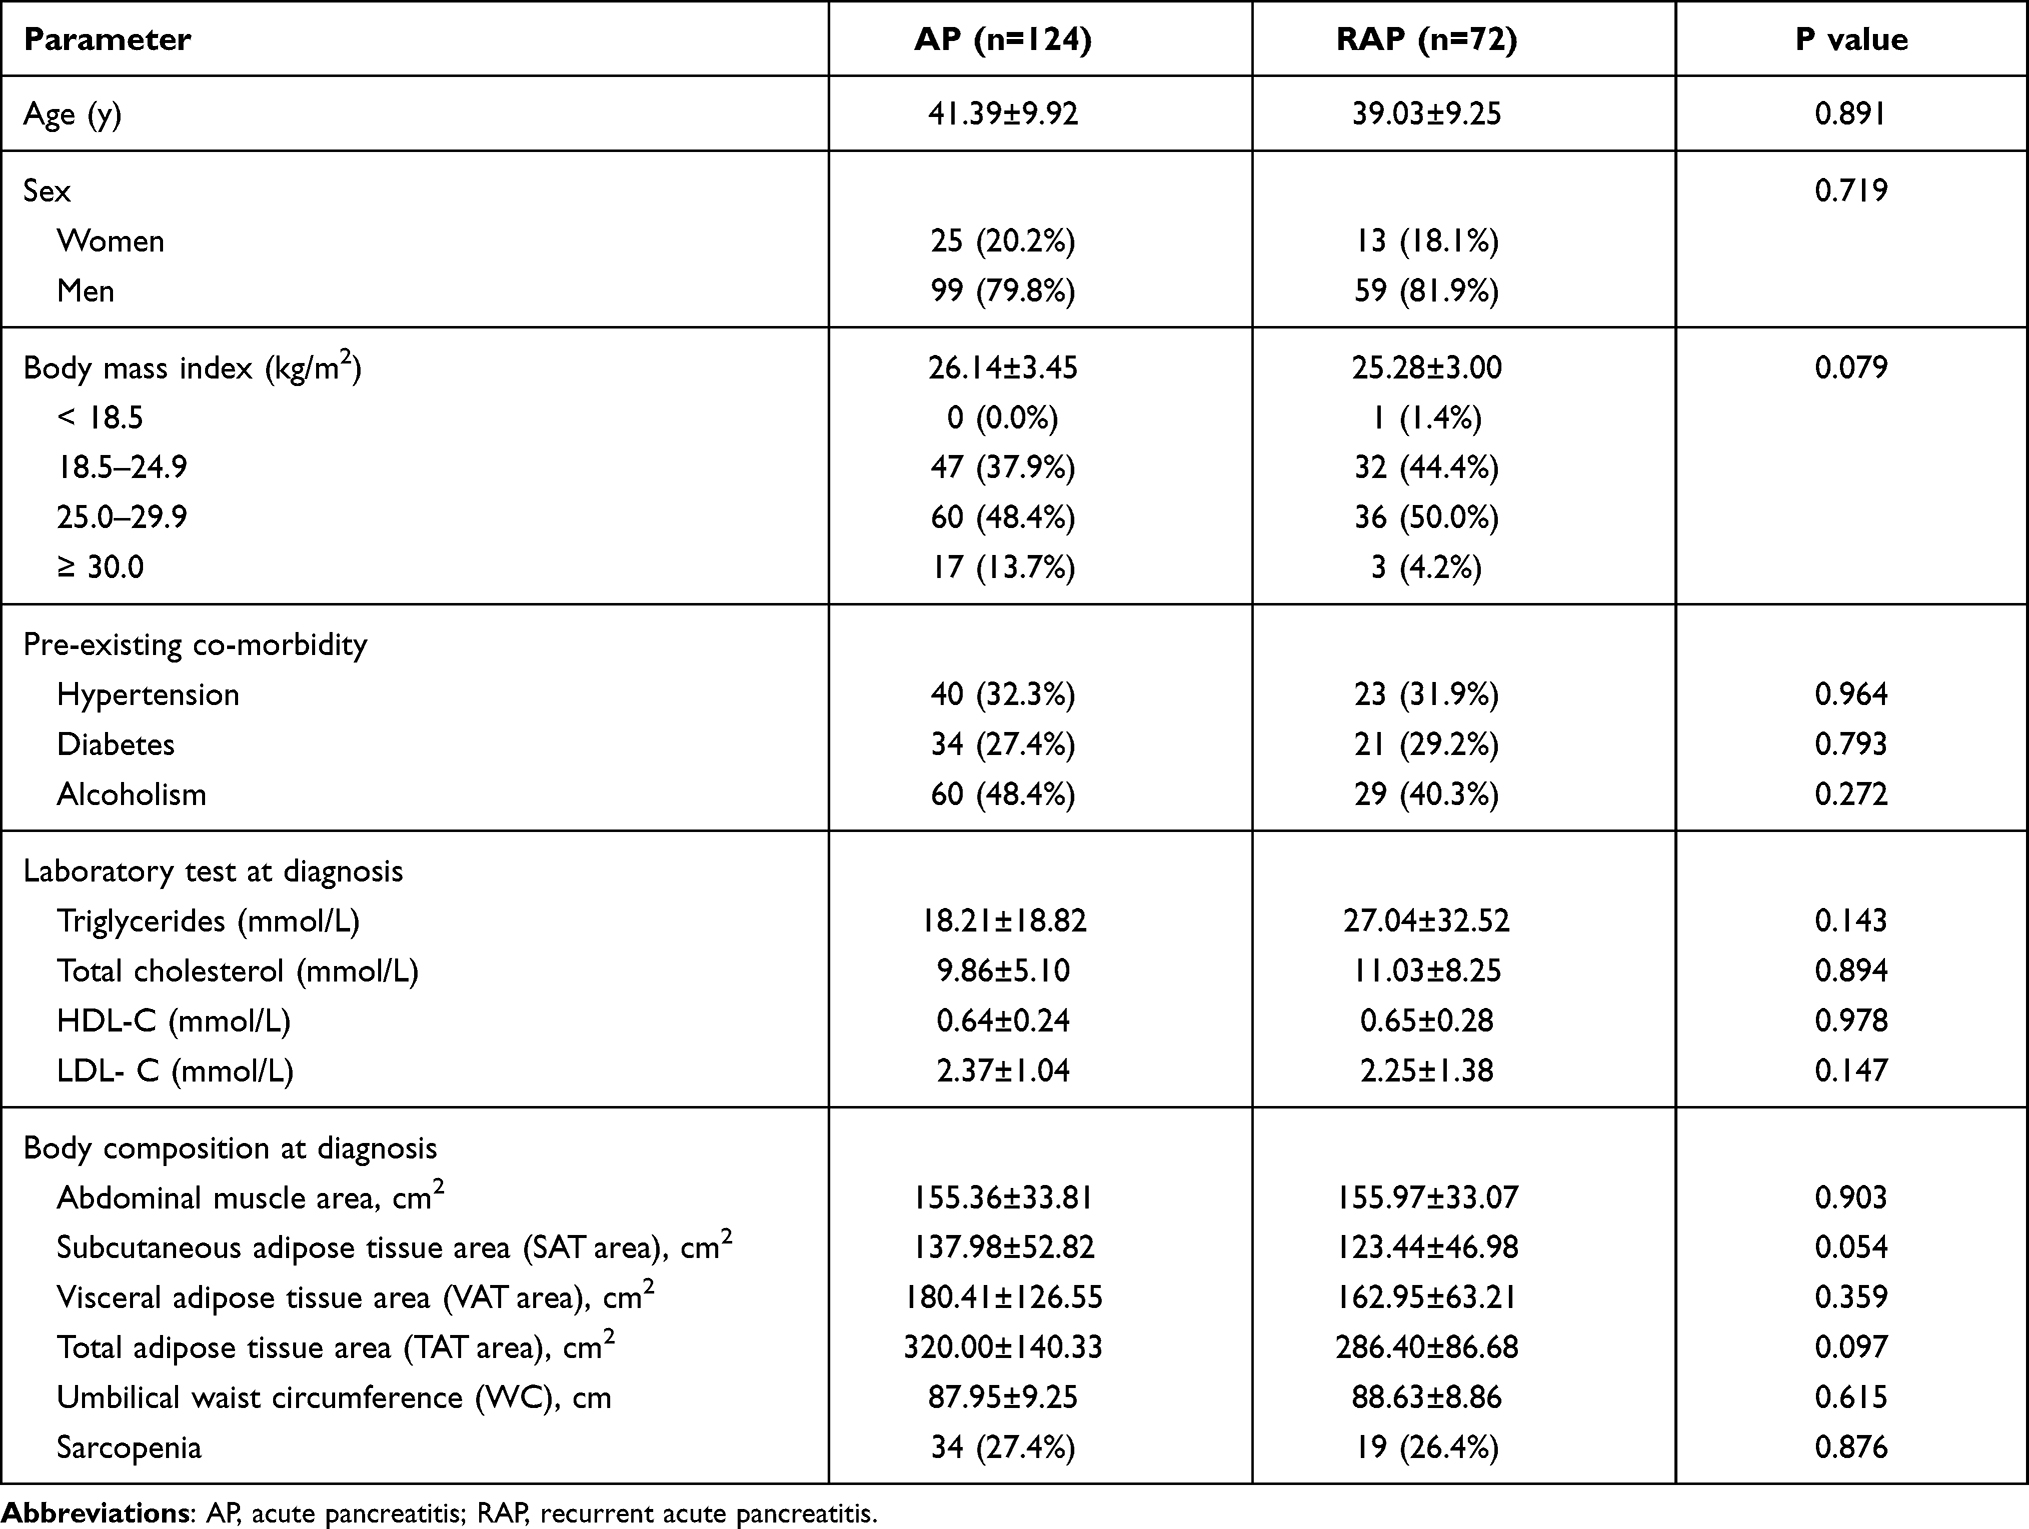 |
Table 4 Comparison of Baseline Characteristics Between AP and RAP Groups |
Discussion
AP is a common disease of the abdomen necessitating emergency department visits.3,29,30 Biliary tract stones and alcoholism are the most common etiologies of AP.2 Recent reports have indicated an increasing prevalence of HTGP in Asia.3,6 Jin et al showed that from 2001 to 2016, the prevalence of HTGP increased from 14.0% to 34.0%.3 These changes may be related to caloric intake and an increasing incidence of diabetes.31 Notably, HTGP now ranked as the third leading cause for AP.8 The treatment of HTGP diagnosed as mild acute pancreatitis is mainly fasting, acid inhibition, enzyme inhibition and fluid replacement. Fluid replacement only needs to supplement daily physiological requirements, generally no enteral nutrition is needed, and fenofibrate capsules can be taken at the same time to regulate blood lipids. For moderately severe acute pancreatitis and severe acute pancreatitis diagnosed, it is necessary to maintain organ function, use inhibitors to inhibit pancreatic exocrine and pancreatin, early enteral nutrition, rational use of antibiotics, treatment of local and systemic complications, and analgesia.32 At the same time, intensive insulin therapy or plasma exchange therapy can reduce blood lipid for hyperlipidemia. The patients discharged from hospital should take fenofibrate capsules and pancreatin enteric-coated capsules for a long time, and regularly monitor blood lipid and hematuria amylase.33
A plethora of clinical and experimental data have identified obesity as a risk factor for AP.4,15–20 Hansen et al studied 118,000 patients with AP, and confirmed that BMI is an independent factor of AP.16 Blaszczak et al reported that class III obesity seems to have an adverse mortality effect in patients with AP.18 A recent study by Thavamani et al suggested that morbid obesity is an independent risk factor for clinical outcomes in pediatric AP.19 However, most studies did not distinguish between VAT and SAT depots. The study of fat distribution is crucial to understanding the metabolic implications of excess adiposity. More and more researchers have realized that the study of fat distribution is important in obesity research.22–25 CT imaging is a reliable method for the analysis of fat distribution and the measurement of adipose tissues.26 The axial CT image at L3 is known to represent muscle tissues and fat distribution.26,34 Pankaj Gupta et al have combined modified CT severity index (MCTSI) with adipose tissue features to propose a fat-modified CT severity index (FMCTSI) and have found that FMCTSI is a better CT index than MCTSI for predicting the severity and clinical outcomes of AP and FMCTSI based on TAT or VAT has different efficacy.35 Blaszczak et al conducted a study in 68,158 individuals, among whom 424 developed AP, and demonstrated that greater abdominal adiposity is associated with a higher severity of AP.36 However, many studies have suggested that VAT is not significantly associated with AP.37–39 Duarte-Rojo et al have shown that both SAT and VAT independently predict a severe outcome of AP.40 The differences in results across different studies may be explained by several factors. First, the studies involved a heterogeneous population of patients, including those from Southeast Asia, Europe, and North America. Second, different software programs were used to analyze body composition, which may be an additional confounding factor. Third, most studies did not classify the etiological patterns of AP, which may be mainly because of the different proportions of the etiological patterns in previous studies. Therefore, studies on the etiologies of AP are needed. To our knowledge, this is the first study on the impact of body composition on LOS and recurrence in patients with HTGP.
Our results revealed that SAT area and HDL-C were independent predictors of LOS. Patients in the long LOS group (>14 days), based on the median LOS of the entire sample, had higher SAT area than patients in the short LOS group (≤14 days). Previous studies have also determined that patients with LOS >14 days have more severe pancreatitis.36 Szentesi et al studied 1257 individuals with AP, and reported that obese patients had longer LOS than non-obese patients.41 Murata et al showed a similar finding in pediatric AP.42 However, they did not conduct further analysis on fat distribution and etiological classification. Fujisawa et al suggested that SAT may be an especially important factor related to the incidence of post-endoscopic retrograde cholangiopancreatography pancreatitis;43 however, they did not investigate its relationship with LOS. Many studies have found that adiponectin, secreted by adipose tissue, is play an important role in exerting anti-inflammatory effect through the inhibition of proinflammatory signaling and NF-kappa B, which is decreased in obesity. The serum adiponectin level correlates with SAT and obesity might decrease adiponectin from SAT that could affect inflammatory effect of AP43–47.
Few studies have been conducted on the correlation between obesity and the recurrence of pancreatitis. Shimonov et al found that higher amounts of VAT and abdominal muscle area were significantly associated with a lower recurrence rate of AP in 158 patients;48 however, in our study, there was no significant association between body composition and the recurrence of HTGP. HTGP may be different from other etiologies of pancreatitis in terms of the effect of body composition. The doctor’s medical advice for TG control after discharge may be another reason because the body composition of the patients after 1 year may be different from that at the first hospitalization. Dynamic changes in body composition may be the direction of future research. In addition, many studies have shown that alcoholism, cigarette smoking, hypertriglyceridemia, and local complications are risk factors for recurrent pancreatitis.49,50 However, our study showed no significant association between hypertriglyceridemia and recurrence of HTGP.
This study had some limitations. First, the number of patients with HTGP within categories by pancreatitis type was small; thus, studies with larger sample sizes are required. Second, as our study results were derived from a retrospective single-center analysis, further prospective and multicenter studies should be conducted in the future. Finally, the outcome of recurrence was assessed within 1 year after discharge, which may not reflect the long-term outcome of patients.
Conclusion
In the present study, we found that SAT area and HDL-C are associated with LOS in patients with HTGP. The CT-defined body composition may help identify patients at a high risk of long-term hospitalization and assist in treatment decision making. In addition, we found that the body composition of patients at the first symptom onset of HTGP cannot predict the recurrence of the disease. Future studies should investigate strategies focusing on dynamic change in body composition.
Ethics Approval and Consent to Participate
The study protocol was approved by the ethics committee of the First Affiliated Hospital of Wenzhou Medical University (KY2019–011). The ethics committee did not require patients to consent to review their medical records due to the retrospective nature of the study and the study poses a very low risk to the patients. This study was conducted in accordance with the declaration of Helsinki 1975, revised Hong Kong 1989. And the confidentiality and anonymity of the data was also ensured.
Funding
This research was partially funded by a grant from Wenzhou Science and Technology Planning Project (CN), project number: 2019Y0062.
Disclosure
The authors have no conflicts of interest to declare.
References
1. Piwinski S. Severe acute pancreatitis. JAMA. 2004;292(11):1305. doi:10.1001/jama.292.11.1305-a
2. M O, L S, B B, et al. Acute pancreatitis: extrapancreatic necrosis volume as early predictor of severity. Radiology. 2015;276(1):119–128. doi:10.1148/radiol.15141494
3. Jin M, Bai X, Chen X, et al. A 16-year trend of etiology in acute pancreatitis: the increasing proportion of hypertriglyceridemia-associated acute pancreatitis and its adverse effect on prognosis. J Clin Lipidol. 2019;13(6):947–953.e1. doi:10.1016/j.jacl.2019.09.005
4. Krishna SG, Hinton A, Oza V, et al. Morbid obesity is associated with adverse clinical outcomes in acute pancreatitis: a propensity-matched Study. Am J Gastroenterol. 2015;110(11):1608–1619. doi:10.1038/ajg.2015.343
5. Xiang JX, Hu LS, Liu P, et al. Impact of cigarette smoking on recurrence of hyperlipidemic acute pancreatitis. World J Gastroenterol. 2017;23(47):8387–8394. doi:10.3748/wjg.v23.i47.8387
6. Zheng Y, Zhou Z, Li H, et al. A multicenter study on etiology of acute pancreatitis in Beijing during 5 years. Pancreas. 2015;44(3):409–414. doi:10.1097/MPA.0000000000000273
7. Valdivielso P, Ramírez-Bueno A, Ewald N. Current knowledge of hypertriglyceridemic pancreatitis. Eur J Intern Med. 2014;25(8):689–694. doi:10.1016/j.ejim.2014.08.008
8. Pothoulakis I, Paragomi P, Archibugi L, et al. Clinical features of hypertriglyceridemia-induced acute pancreatitis in an international, multicenter, prospective cohort (APPRENTICE consortium). Pancreatology. 2020;20(3):325–330. doi:10.1016/j.pan.2020.02.010
9. Yadav D, Lowenfels AB. Trends in the epidemiology of the first attack of acute pancreatitis: a systematic review. Pancreas. 2006;33(4):323–330. doi:10.1097/01.mpa.0000236733.31617.52
10. Diehl AK, Holleman DR
11. Havel RJ. Pathogenesis, differentiation and management of hypertriglyceridemia. Adv Intern Med. 1969;15:117–154.
12. Tai WP, Lin XC, Liu H, et al. A retrospective research of the characteristic of hypertriglyceridemic pancreatitis in Beijing, China. Gastroenterol Res Pract. 2016;2016:6263095. doi:10.1155/2016/6263095
13. Goyal H, Smith B, Bayer C, et al. Differences in severity and outcomes between hypertriglyceridemia and alcohol-induced pancreatitis. N Am J Med Sci. 2016;8(2):82–87. doi:10.4103/1947-2714.177307
14. Subramanian S, Chait A. Hypertriglyceridemia secondary to obesity and diabetes. Biochim Biophys Acta. 2012;1821(5):819–825. doi:10.1016/j.bbalip.2011.10.003
15. Martínez J, Johnson CD, Sánchez-Payá J, et al. Obesity is a definitive risk factor of severity and mortality in acute pancreatitis: an updated meta-analysis. Pancreatology. 2006;6(3):206–209. doi:10.1159/000092104
16. Hansen SEJ, Madsen CM, Varbo A, et al. Body mass index, triglycerides, and risk of acute pancreatitis: a population-based Study of 118 000 individuals. J Clin Endocrinol Metab. 2020;105(1):105. doi:10.1210/clinem/dgz059
17. Dobszai D, Mátrai P, Gyöngyi Z, et al. Body-mass index correlates with severity and mortality in acute pancreatitis: a meta-analysis. World J Gastroenterol. 2019;25(6):729–743. doi:10.3748/wjg.v25.i6.729
18. Blaszczak AM, Krishna SG, Hart PA, et al. Class III obesity rather than metabolic syndrome impacts clinical outcomes of acute pancreatitis: a propensity score weighted analysis. Pancreatology. 2020;20(7):1287–1295. doi:10.1016/j.pan.2020.08.011
19. Thavamani A, Umapathi KK, Roy A, et al. The increasing prevalence and adverse impact of morbid obesity in paediatric acute pancreatitis. Pediatr Obes. 2020;15(8):e12643. doi:10.1111/ijpo.12643
20. Pérez S, Rius-Pérez S, Finamor I, et al. Obesity causes PGC-1α deficiency in the pancreas leading to marked IL-6 upregulation via NF-κB in acute pancreatitis. J Pathol. 2019;247:48–59. doi:10.1002/path.5166
21. Chen SM, Xiong GS, Wu SM. Is obesity an indicator of complications and mortality in acute pancreatitis? An updated meta-analysis. J Dig Dis. 2012;13(5):244–251. doi:10.1111/j.1751-2980.2012.00587.x
22. Sorimachi H, Obokata M, Takahashi N, et al. Pathophysiologic importance of visceral adipose tissue in women with heart failure and preserved ejection fraction. Eur Heart J. 2020.
23. Navaneethan SD, Kirwan JP, Remer EM, et al. Adiposity, physical function, and their associations with insulin resistance, inflammation, and adipokines in CKD. Am J Kidney Dis. 2020.
24. Fernandes RA, Li C, Wang G, et al. Discovery of surrogate agonists for visceral fat Treg cells that modulate metabolic indices in vivo. Elife. 2020;9:9. doi:10.7554/eLife.58463
25. Anderson WD, Soh JY, Innis SE, et al. Sex differences in human adipose tissue gene expression and genetic regulation involve adipogenesis. Genome Res. 2020;30(10):1379–1392. doi:10.1101/gr.264614.120
26. Klopfenstein BJ, Kim MS, Krisky CM, et al. Comparison of 3 T MRI and CT for the measurement of visceral and subcutaneous adipose tissue in humans. Br J Radiol. 2012;85(1018):e826–30. doi:10.1259/bjr/57987644
27. Banks PA, Bollen TL, Dervenis C, et al. Classification of acute pancreatitis–2012: revision of the Atlanta classification and definitions by international consensus. Gut. 2013;62(1):102–111. doi:10.1136/gutjnl-2012-302779
28. Prado CM, Lieffers JR, McCargar LJ, et al. Prevalence and clinical implications of sarcopenic obesity in patients with solid tumours of the respiratory and gastrointestinal tracts: a population-based study. Lancet Oncol. 2008;9(7):629–635. doi:10.1016/S1470-2045(08)70153-0
29. Bhatia M, Wong FL, Cao Y, et al. Pathophysiology of acute pancreatitis. Pancreatology. 2005;5(2–3):132–144. doi:10.1159/000085265
30. Peery AF, Dellon ES, Lund J, et al. Burden of gastrointestinal disease in the United States: 2012 update. Gastroenterology. 2012;143(5):1179–1187.e3. doi:10.1053/j.gastro.2012.08.002
31. Scherer J, Singh VP, Pitchumoni CS, et al. Issues in hypertriglyceridemic pancreatitis: an update. J Clin Gastroenterol. 2014;48(3):195–203. doi:10.1097/01.mcg.0000436438.60145.5a
32. Li J, Chen J, Tang W. The consensus of integrative diagnosis and treatment of acute pancreatitis-2017. J Evid Based Med. 2019;12(1):76–88. doi:10.1111/jebm.12342
33. Filippatos T, Milionis HJ. Treatment of hyperlipidaemia with fenofibrate and related fibrates. Expert Opin Investig Drugs. 2008;17(10):1599–1614. doi:10.1517/13543784.17.10.1599
34. Kim SI, Kim TM, Lee M, et al. Impact of CT-determined sarcopenia and body composition on survival outcome in patients with advanced-stage high-grade serous ovarian carcinoma. Cancers (Basel). 2020;12.
35. Gupta P, Dawra S, Chandel K, et al. Fat-modified computed tomography severity index (CTSI) is a better predictor of severity and outcome in patients with acute pancreatitis compared with modified CTSI. Abdom Radiol (NY). 2020;45(5):1350–1358. doi:10.1007/s00261-020-02473-y
36. Sadr-Azodi O, Orsini N, Andrén-Sandberg Å, et al. Abdominal and total adiposity and the risk of acute pancreatitis: a population-based prospective cohort study. Am J Gastroenterol. 2013;108(1):133–139. doi:10.1038/ajg.2012.381
37. Monreal-Robles R, Kohn-Gutiérrez AE, Sordia-Ramírez J, et al. Peritoneal cavity circumference on computed tomography predicts outcomes in acute pancreatitis. Eur J Radiol. 2020;132:109327. doi:10.1016/j.ejrad.2020.109327
38. Sternby H, Mahle M, Linder N, et al. Mean muscle attenuation correlates with severe acute pancreatitis unlike visceral adipose tissue and subcutaneous adipose tissue. United European Gastroenterol J. 2019;7(10):1312–1320. doi:10.1177/2050640619882520
39. Hall TC, Stephenson JS, Jones MJ, et al. Is abdominal fat distribution measured by axial CT imaging an indicator of complications and mortality in acute pancreatitis? J Gastrointest Surg. 2015;19(12):2126–2131. doi:10.1007/s11605-015-2972-3
40. Duarte-Rojo A, Sosa-Lozano LA, Saul A, et al. Methods for measuring abdominal obesity in the prediction of severe acute pancreatitis, and their correlation with abdominal fat areas assessed by computed tomography. Aliment Pharmacol Ther. 2010;32(2):244–253. doi:10.1111/j.1365-2036.2010.04321.x
41. Szentesi A, Párniczky A, Vincze Á, et al. Multiple hits in acute pancreatitis: components of metabolic syndrome synergize each other’s deteriorating effects. Front Physiol. 2019;10:1202. doi:10.3389/fphys.2019.01202
42. Murata A, Ohtani M, Muramatsu K, et al. Impact of obesity on outcomes of paediatric acute pancreatitis based on a national administrative database. Pediatr Obes. 2016;11(3):174–180. doi:10.1111/ijpo.12041
43. Fujisawa T, Kagawa K, Hisatomi K, et al. Obesity with abundant subcutaneous adipose tissue increases the risk of post-ERCP pancreatitis. J Gastroenterol. 2016;51(9):931–938. doi:10.1007/s00535-016-1160-x
44. Chandrasekar B, Boylston WH, Venkatachalam K, et al. Adiponectin blocks interleukin-18-mediated endothelial cell death via APPL1-dependent AMP-activated protein kinase (AMPK) activation and IKK/NF-kappaB/PTEN suppression. J Biol Chem. 2008;283(36):24889–24898. doi:10.1074/jbc.M804236200
45. Folco EJ, Rocha VZ, López-Ilasaca M, et al. Adiponectin inhibits pro-inflammatory signaling in human macrophages independent of interleukin-10. J Biol Chem. 2009;284(38):25569–25575. doi:10.1074/jbc.M109.019786
46. Araki H, Nishihara T, Matsuda M, et al. Adiponectin plays a protective role in caerulein-induced acute pancreatitis in mice fed a high-fat diet. Gut. 2008;57(10):1431–1440. doi:10.1136/gut.2007.135665
47. Wade TE, Mathur A, Lu D, et al. Adiponectin receptor-1 expression is decreased in the pancreas of obese mice. J Surg Res. 2009;154(1):78–84. doi:10.1016/j.jss.2008.05.006
48. Shimonov M, Abtomonova Z, Groutz A, et al. Associations between body composition and prognosis of patients admitted because of acute pancreatitis: a retrospective study. Eur J Clin Nutr. 2020. doi:10.1038/s41430-020-00789-y
49. Ahmed Ali U, Issa Y, Hagenaars JC, et al. Risk of recurrent pancreatitis and progression to chronic pancreatitis after a first episode of acute pancreatitis. Clin Gastroenterol Hepatol. 2016;14(5):738–746. doi:10.1016/j.cgh.2015.12.040
50. Cho JH, Jeong YH, Kim KH, et al. Risk factors of recurrent pancreatitis after first acute pancreatitis attack: a retrospective cohort study. Scand J Gastroenterol. 2020;55(1):90–94. doi:10.1080/00365521.2019.1699598
 © 2021 The Author(s). This work is published and licensed by Dove Medical Press Limited. The full terms of this license are available at https://www.dovepress.com/terms.php and incorporate the Creative Commons Attribution - Non Commercial (unported, v3.0) License.
By accessing the work you hereby accept the Terms. Non-commercial uses of the work are permitted without any further permission from Dove Medical Press Limited, provided the work is properly attributed. For permission for commercial use of this work, please see paragraphs 4.2 and 5 of our Terms.
© 2021 The Author(s). This work is published and licensed by Dove Medical Press Limited. The full terms of this license are available at https://www.dovepress.com/terms.php and incorporate the Creative Commons Attribution - Non Commercial (unported, v3.0) License.
By accessing the work you hereby accept the Terms. Non-commercial uses of the work are permitted without any further permission from Dove Medical Press Limited, provided the work is properly attributed. For permission for commercial use of this work, please see paragraphs 4.2 and 5 of our Terms.