")
Back to Journals » Diabetes, Metabolic Syndrome and Obesity » Volume 13
Assessment of Cell-Free Long Non-Coding RNA-H19 and miRNA-29a, miRNA-29b Expression and Severity of Diabetes
Authors Alfaifi M, Verma AK, Alshahrani MY, Joshi PC , Alkhathami AG, Ahmad I, Hakami AR, Beg MMA
Received 23 July 2020
Accepted for publication 8 September 2020
Published 14 October 2020 Volume 2020:13 Pages 3727—3737
DOI https://doi.org/10.2147/DMSO.S273586
Checked for plagiarism Yes
Review by Single anonymous peer review
Peer reviewer comments 3
Editor who approved publication: Prof. Dr. Juei-Tang Cheng
Mohammed Alfaifi,1,* Amit Kumar Verma,2,* Mohammad Yahya Alshahrani,1 Prakash C Joshi,2 Ali G Alkhathami,1 Irfan Ahmad,1 Abdulrahim Refdan Hakami,1 Mirza Masroor Ali Beg3,4
1Department of Clinical Laboratory Sciences, College of Applied Medical Sciences, King Khalid University, Abha, Saudi Arabia; 2Department of Zoology and Environmental Sciences, GKV, Haridwar, India; 3Department of Medical Elementology and Toxicology, Jamia Hamdard, New Delhi, India; 4Department of Biochemistry, Maulana Azad Medical College, New Delhi, India
*These authors contributed equally to this work
Correspondence: Mirza Masroor Ali Beg
Department of Medical Elementology and Toxicology, Jamia Hamdard, New Delhi, India
Tel +917827655616
Email [email protected]
Background: Type 2 diabetes mellitus [T2DM] has been one of the common diseases and is characterized by increased blood glucose levels and suggested that cell-free non-coding RNAs and microRNAs (miRNAs) have been demonstrated to serve as important diagnostic/prognostic biomarkers in diabetes.
Materials/Methods: The present study included clinically confirmed newly diagnosed 200 cases of T2DM and 200 healthy subjects, and all the parameters were taken care in diagnosis. Blood samples collected in plain vials were used for cell-free total RNA extraction and after that 100ng of total RNA was used to synthesize the cDNA for cell-free lncRNA H19, miRNA-29a, and miRNA-29b expression using quantitative real-time PCR method. Serum Biochemical parameters were analyzed after collection of the sample to observe the changes among T2DM cases and healthy controls.
Results: It was observed that type 2 diabetic patients had decreased [0.59 fold] lncRNA H19 expression while increased miRNA-29a [5.62 fold] and miRNA-29b [5.58 fold] expression. Decreased expression of lncRNA H19 was observed to be associated with gender [p=0.004], hypertension [p< 0.0001], weight loss [p=0.02] and fatigue [p=0.02]. Increased miRNA29a expression was linked with hypertension [p< 0.0001], alcoholism [p=0.04], and smoking [p< 0.0001] as well as miRNA-29b expression was associated with hypertension [p=0.0001], weight loss [p=0.002], smoking [p=0.0002], alcoholism [p< 0.0001]. Low [≤ 1 fold] and high [> 1 fold] expression of lncRNA H19 expression was linked with miRNA-29a [p=0.005] and miRNA-29b [p< 0.0001] expression. lncRNA H19 expression showed negative correlation with miRNA-29a expression [r= − 27, p< 0.0001] and miRNA-29b [r= − 47, p< 0.0001].
Conclusion: The present study concluded that lower lncRNA H19 expression, and increased miRNA-29b, a miRNA-29b expression associated with the severity of T2DM patients. Decreased lncRNA H19 expression, and increased miRNA-29b, miRNA-29b expression observed to be interrelated with clinicopathological findings of T2DM patients could involve in pathogenesis disease.
Keywords: diabetes, lncRNA, microRNA, gene expression, cell-free system
Introduction
Type 2 diabetes mellitus [T2DM] is strongly associated with impaired glucose level, which developed due to the inability of the pancreas to secret enough insulin as well as insulin resistance. Hyperglycemia causes injury to major organs such as blood vessels, liver, brain, heart, kidneys, eyes, and can heavily contribute to the health and financial burden associated with the disease. The liver is particularly involved in maintaining blood glucose levels and excessive hepatic glucose production [HGP] contributing hyperglycemia in T2DM patients.1,2 Numerous long non-coding RNAs [lncRNAs] have been identified, and projects like ENCODE have focused on the identification and characterization of lncRNAs. ENCODE project revealed that there are at least 9640 human loci lncRNAs, and the number grows continuously.3 LncRNAs play a significant role in regulation at transcriptional and, post-transcriptional levels, and the organization of chromatin.4 Studies suggested that LncRNAs also play a vital role in tumorigenesis.5 LncRNAs and microRNAs [miRNAs] have different functions and participate in translational repression by targeting the genes, thereby shifting the nature of disease states. LncRNAs have been involved in multiple cellular processes and emerged as potent genetic regulators. LncRNAs serve as a negative regulator of miRNAs and contribute to inhibit the level of expression.6 Inc RNA H19 is positioned on chromosome number 11p15.5, about 100 kb distal of insulin-like growth factor 2 [IGF2], and simultaneously H19 and IGF2 are transcribed from a conserved embossed gene cluster.7 In T2DM patients, approximately 5 times lower H19 levels were observed in skeletal muscle compared to healthy individuals.8 Considerable attention received on multiple genes linked to epigenetic regulation of path-physiology of diabetes. miRNAs are a group of short sequence about 22 nucleotides and target the multiple mRNAs that regulate protein-coding genes expression9 and have been predicted that miRNAs regulate over 60% of all coding genes in mammals.10 Several miRNAs have been associated with impairment of glycemic homeostasis and the diabetes progression.11,12
The human miRNA-29 family abides miRNA-29a, miRNA-29b, and located and transcribed at chromosome 7 [7q32.3], whereas miRNA-29c is transcribed from chromosome 1 [1q32.2].13 Clusters of miRNA-29 transcribed together as polycistronic primary transcripts.14 Increased miRNA29 family was observed in diabetic rodent models tissues such as liver, β-cells, kidney cells, skeletal muscle cells, and adipose tissue.14
lncRNA H19 could bind to miRNA-29a competitively following miRNA response elements (MREs) of miRNA-29a.15 Zhong et al revealed that that lncH19 sponge the miRNA-29b and affect its expression16 and Lv et al also have been stated that H19 could directly bind to miR-29b reduces its expression.17 Therefore, the present research work aimed to investigate the clinical relevance of cell-free lncRNA H19, miRNA-29a, miRNA-29b expression level, and their association with clinical features/variables in T2DM patients in Indian population.
Materials and Methods
Sample Collection
This study included a total of 400 study subjects, 200 were newly diagnosed untreated type 2 diabetes mellitus patients and, 200 were healthy subjects. Three milliliters of blood samples were withdrawn from all the study subjects and collected in plain vials. Fasting as well as postprandial samples collected in fluoride vials from all the 200 T2DM subjects and 1 mL blood in EDTA vials for Hba1c. All the criteria were followed, such as fasting blood glucose [glucose level ≥126 mg/dL] and postprandial glucose [2-hour blood glucose ≥200 mg/dL] were monitored for diagnosis of T2DM disease. T2DM patients with Hypertension (BP ≥140 or ≥90 mm Hg), Nephropathy (polyurea by physical examination as well as 8, 12 and 24hrs urine test), weight loss (>4 kg weight loosed in last 3 to 6 months), fatigue, wound healing, retinopathy (Fundus/fluorescein angiography), loss of appetite, smoking, alcoholism were subjective data recorded for analysis.
Blood samples were centrifuged at 1500 rpm to collect the serum and stored at −80°C for further process. The ethical committee board ethically approved this research study and informed written consent was obtained from all the participants before the study commenced. The present study was ethically approved and the study was conducted at the Department of Zoology, Gurukula Kangri University, Haridwar, India.
Total RNA Extraction
Stored serum samples of T2DM cases and healthy controls were thawed, and total cell-free RNA extraction was done by kit [mirVana total RNA isolation kit, Thermo Fisher Scientific]. All samples are then stored at −70°C in 2mL nuclease-free Eppendorf tubes. The concentration and quality of cell-free RNA were checked by the A260/280 ratio using Nano-drop.
cDNA Synthesis and QRT-PCR for lncH19 Expression Study
A 100 ng of the total cell-free extracted RNA from T2DM patients and healthy controls were used to synthesize cDNA using kit [Verso, Thermo scientific, USA] following kit provided protocol. Expression of cell-free lncRNA H19 was done by quantitative real-time PCR using SYBR green dye using forward primer sequence 5ʹ-ATCGGTGCCTCAGCGTTCGG-3ʹ and reverse primer sequence 5ʹ-CTGTCCTCGCCGTCACACCG-3ʹ and β-actin were used as internal control, and the forward primer sequence 5ʹ-CGACAACGGCTCCGGCATGTGC-3ʹ, reverse primer sequence 5ʹ-GTCACCGGAGTCCATCACGATGC-3ʹ. The program followed as qRT-PCR for lncRNA H19 and β-actin was performed for 40 cycles; initial denaturation was at 94°C for 40 seconds, annealing temperature was at 60°C for 40 seconds, extension at 72°C for 40 seconds and 20 µl reaction volume was used. Ending additional step at 72°C for 5 minutes to end up reaction and melting curve examined between the ranges 35°C to 90°C to confirm the target amplification. A control without cDNA was included in each experiment, and every reaction was done in duplicate. The relative quantification by 2− [ΔΔCT] method was used to compute the lncRNA H19 level expression.
Polyadenylation, cDNA Synthesis for miRNA-29a, and miRNA-29b Expression Study
A total of 100ng RNA was taken to polyadenylate and cDNA synthesis by miRNA Reverse transcription kit [TaqMan, Thermo Fisher Scientific] by following kit protocol. Essential reagents such as reverse transcriptase enzyme and other reagents were added to switch in poly [A] – tail and then into cDNA using a universal RT primer provided with the kit.
QRT-PCR for miRNA-29a, and miRNA-29b Expression
Quantitative real-time PCR [qPCR] was performed to compute the expression level of cell-free miRNA-29a and miRNA-29b. qPCR was done by advanced Taqman master mix [4,444,556], Taqman probes for miRNA-29a [478587_mir], and miRNA-29b [478369_mir] for quantification and miRNA-16 [477860_mir] were used as internal control as normalizer to calculate the level of expression.
Statistical Analysis
All the statistical testing was done using Graph Pad Prism software version 6.05 and SPSS 20.0 version. Mann Whitney U-test was used to calculate the differences in biochemical parameters among T2DM subjects and healthy controls. QRT-PCR outcome analysis was done by the relative cycle threshold [Ct] method to compute the LncRNA H19, miRNA-29a, and miRNA-29b expression levels by the relative quantification method using the 2–[ΔΔCt]. The Mann–Whitney U-test was done to calculate the differences in lncRNA H19, miRNA29a, miRNA29b expression level among the subjective variables. Results more than or less than one were considered to specify up-regulation or down-regulation of expression.
Spearman correlation analysis was performed to check the degree of association by calculating the r-value of lncRNA H19 with miRNA-29a and miRNA-29b. Regression analysis was performed to calculate the R2 and beta coefficient to check the effect of lncRNA H19 and biochemical parameters on miRNA-29a and miRNA-29b expression.
All values were normalized relative to the control values, which were depicted as a value of 1. P-value of less than 0.05 was considered statistically significant.
Results
Demographic and Clinical Characteristics of T2DM Patients and Healthy Controls
In brief, the present study included 200 cases of type 2 diabetes mellitus and 200 healthy control subjects [Table 1]. Among the T2DM cases, 68% of patients were males, and 32% were females while in healthy controls, 70% were males, and 30% were females, more details are mentioned in Table 1.
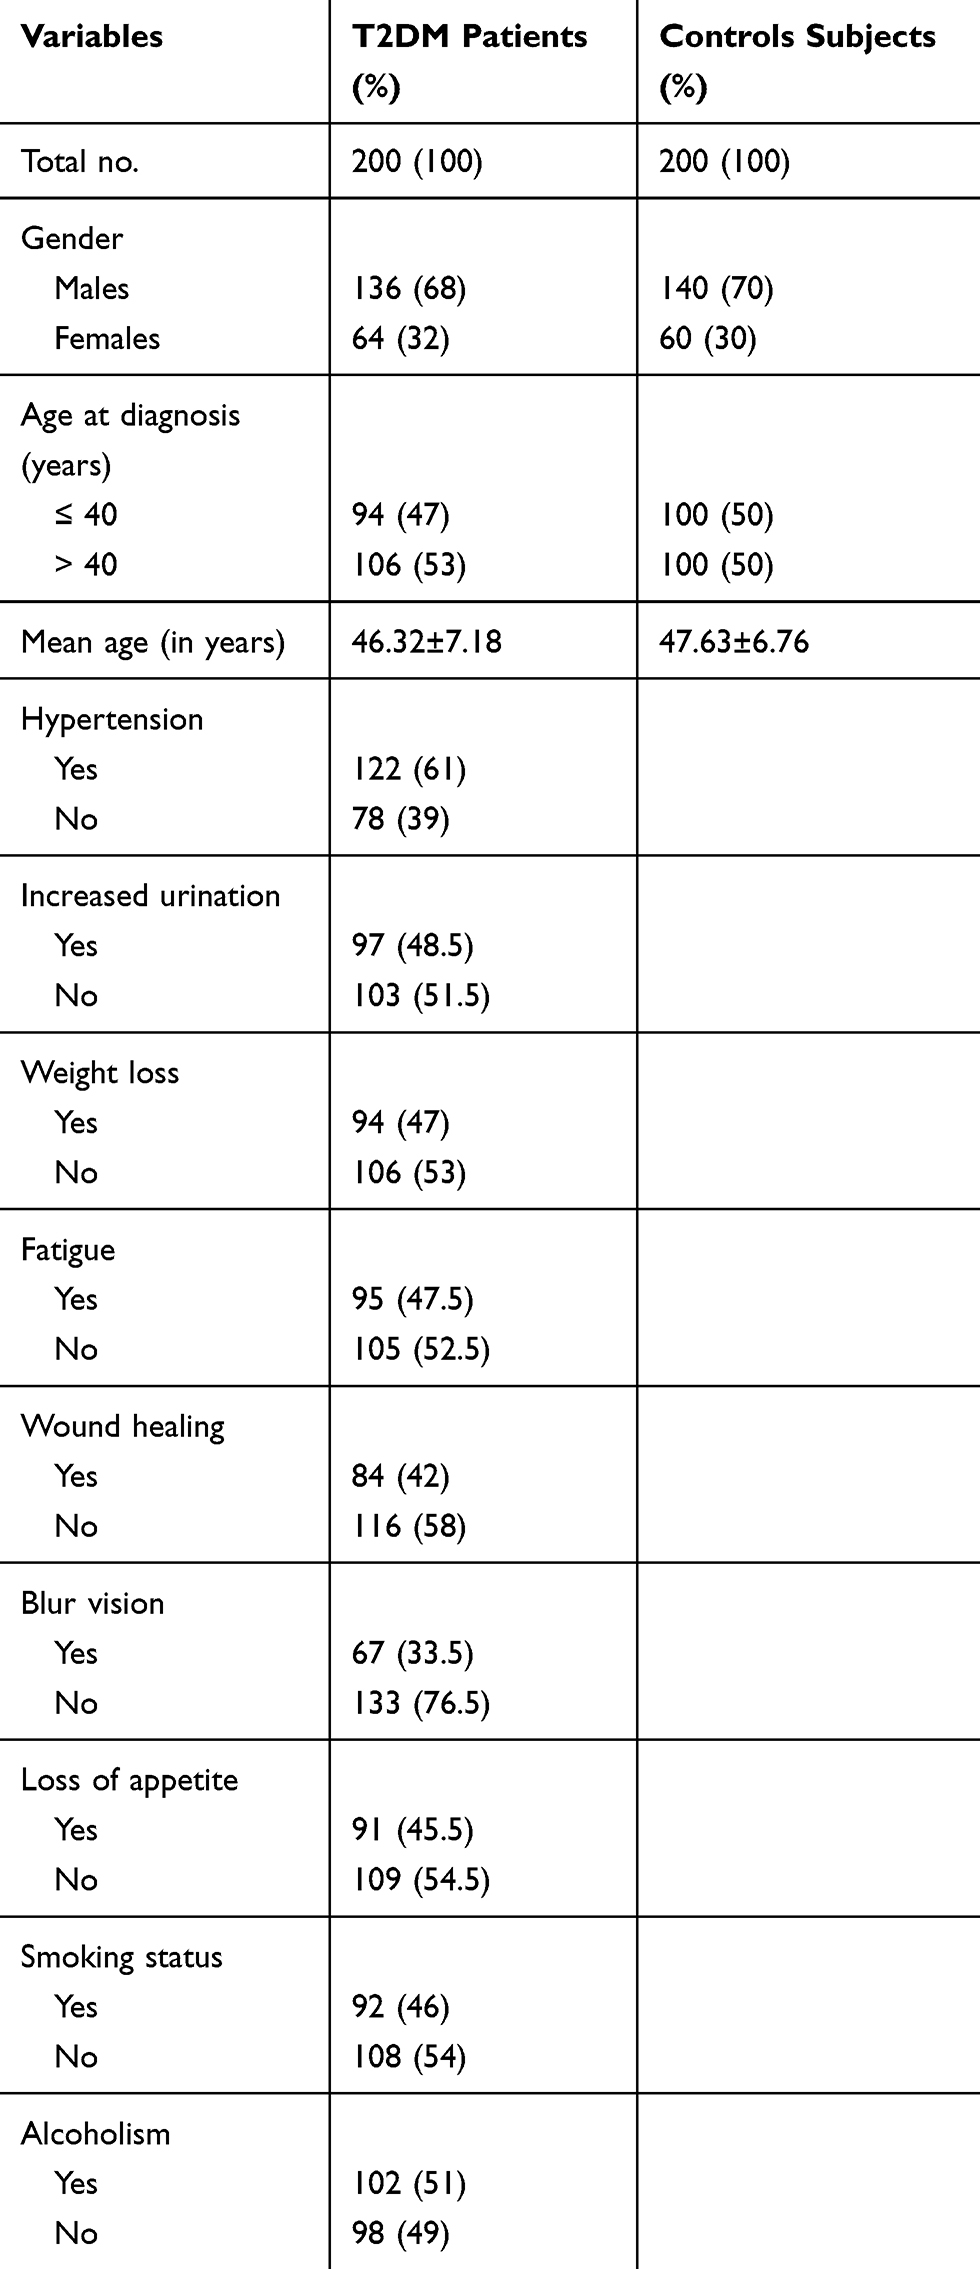 |
Table 1 Demographic and Clinical Characteristics of Enrolled Patients with Type 2 Diabetes Mellitus and Healthy Controls |
Association of Anthropometric Data and Biochemical Parameters Among T2DM and Healthy Subjects
Study recorded anthropometric data and biochemical data and depicted in Table 2. In T2DM, Hip, waist, and body mass index (BMI) were 35.97, 32.61, and 29.0 while in healthy subjects, 34.87, 31.65, and 24.82 and differences among them were observed to be statistically significant (p=0.004, p=0.02, p<0.0001) respectively. Blood glucose parameters such as fasting, postprandial, and Hba1c were tested and differences among T2DM and healthy subjects were observed to be significant (p<0.0001, p<0.0001, p<0.0001).
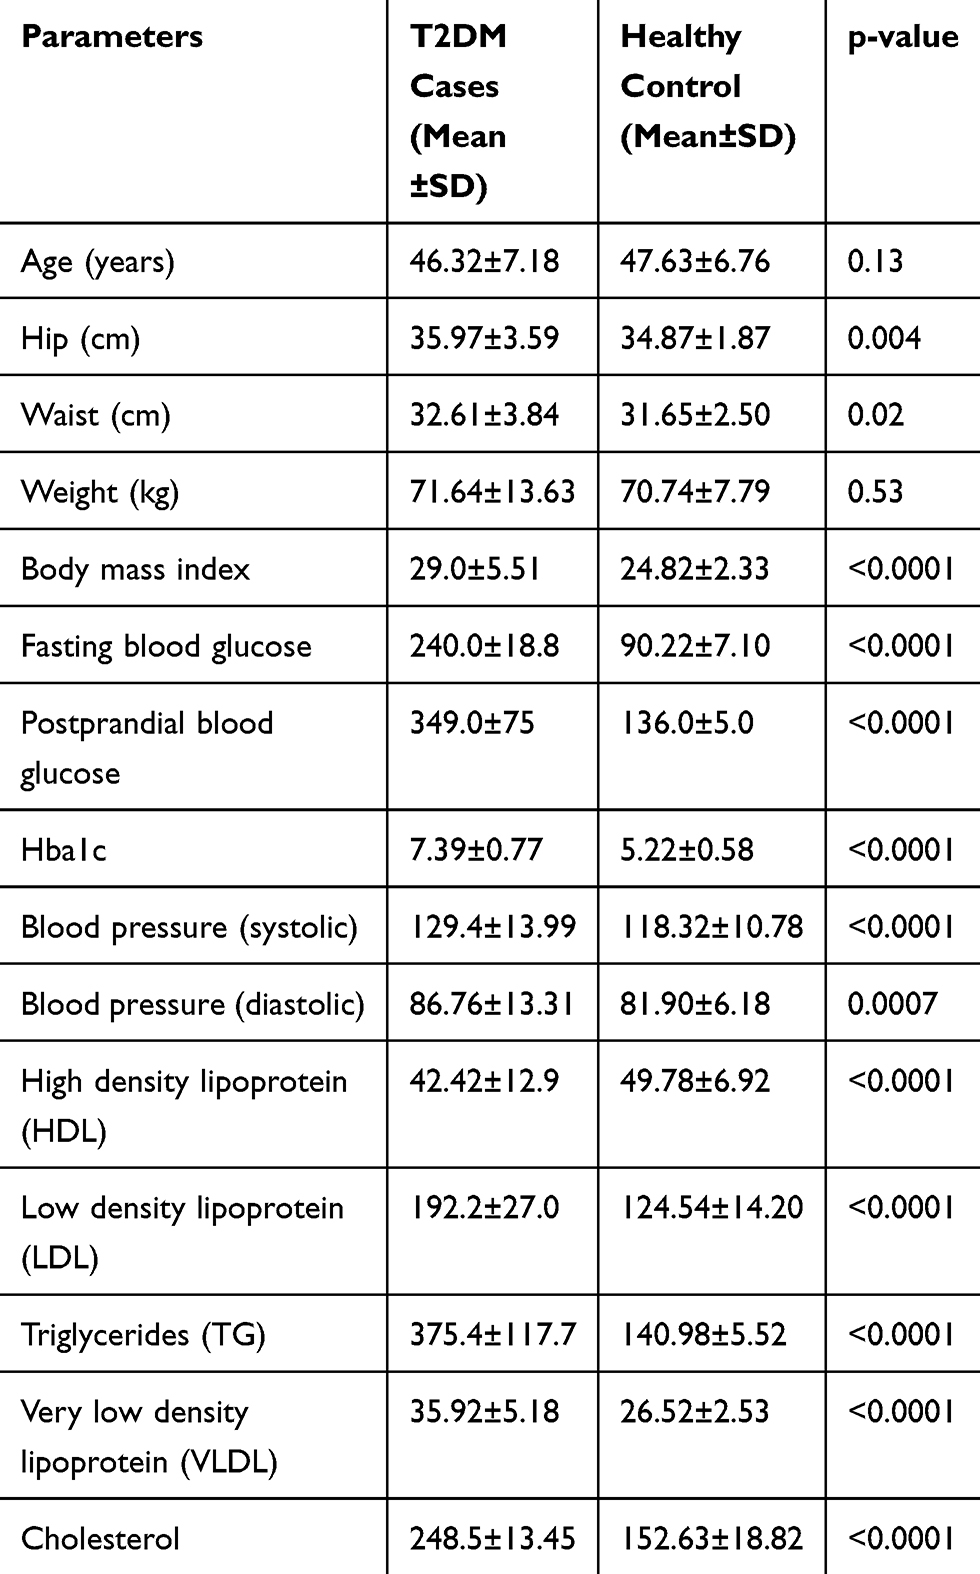 |
Table 2 Comparison of Anthropometric Data and Biochemical Parameters Among T2DM and Healthy Subjects |
Systolic and diastolic blood presser differences among T2DM and healthy subjects were statistically significant (p<0.0001, p=0.0007). Lipid profile analysis such as high-density lipoprotein (HDL), low-density lipoprotein (LDL), triglycerides (TG), very low-density lipoprotein (VLDL), cholesterol showed significant differences among T2DM and healthy control subjects (p<0.0001, p<0.0001, p<0.0001, p<0.0001, p<0.0001) respectively.
LncRNA H19 Expression in T2DM Patients
It was found that T2DM patients had an overall 0.59-fold expression of lncRNA H19 compared to healthy controls [Table 3]. Among the T2DM patients, a significant difference in lncRNA H19 expression was observed between males and females [P=0.004]. Males showed 0.70-fold lncRNA H19 expression while females had 0.56-fold lncRNA H19 expression. Hypertensive T2DM patients, had 0.41 fold changes in lncRNA H19 expression, while non-hypertensive patients showed 0.88 fold lncRNA H19 expression, and statistical differences between them were observed to be significant [P<0.0001]. T2DM patients with weight-loss showed 0.41 fold lncRNA H19 expression, while patients without weight loss showed 0.79 fold lncRNA H19 expression [P=0.02]. Besides, T2DM patients who had fatigue showed 0.47 fold lncRNA H19 expression, while patients with no fatigue showed 0.73 fold lncRNA H19 expression [P=0.02].
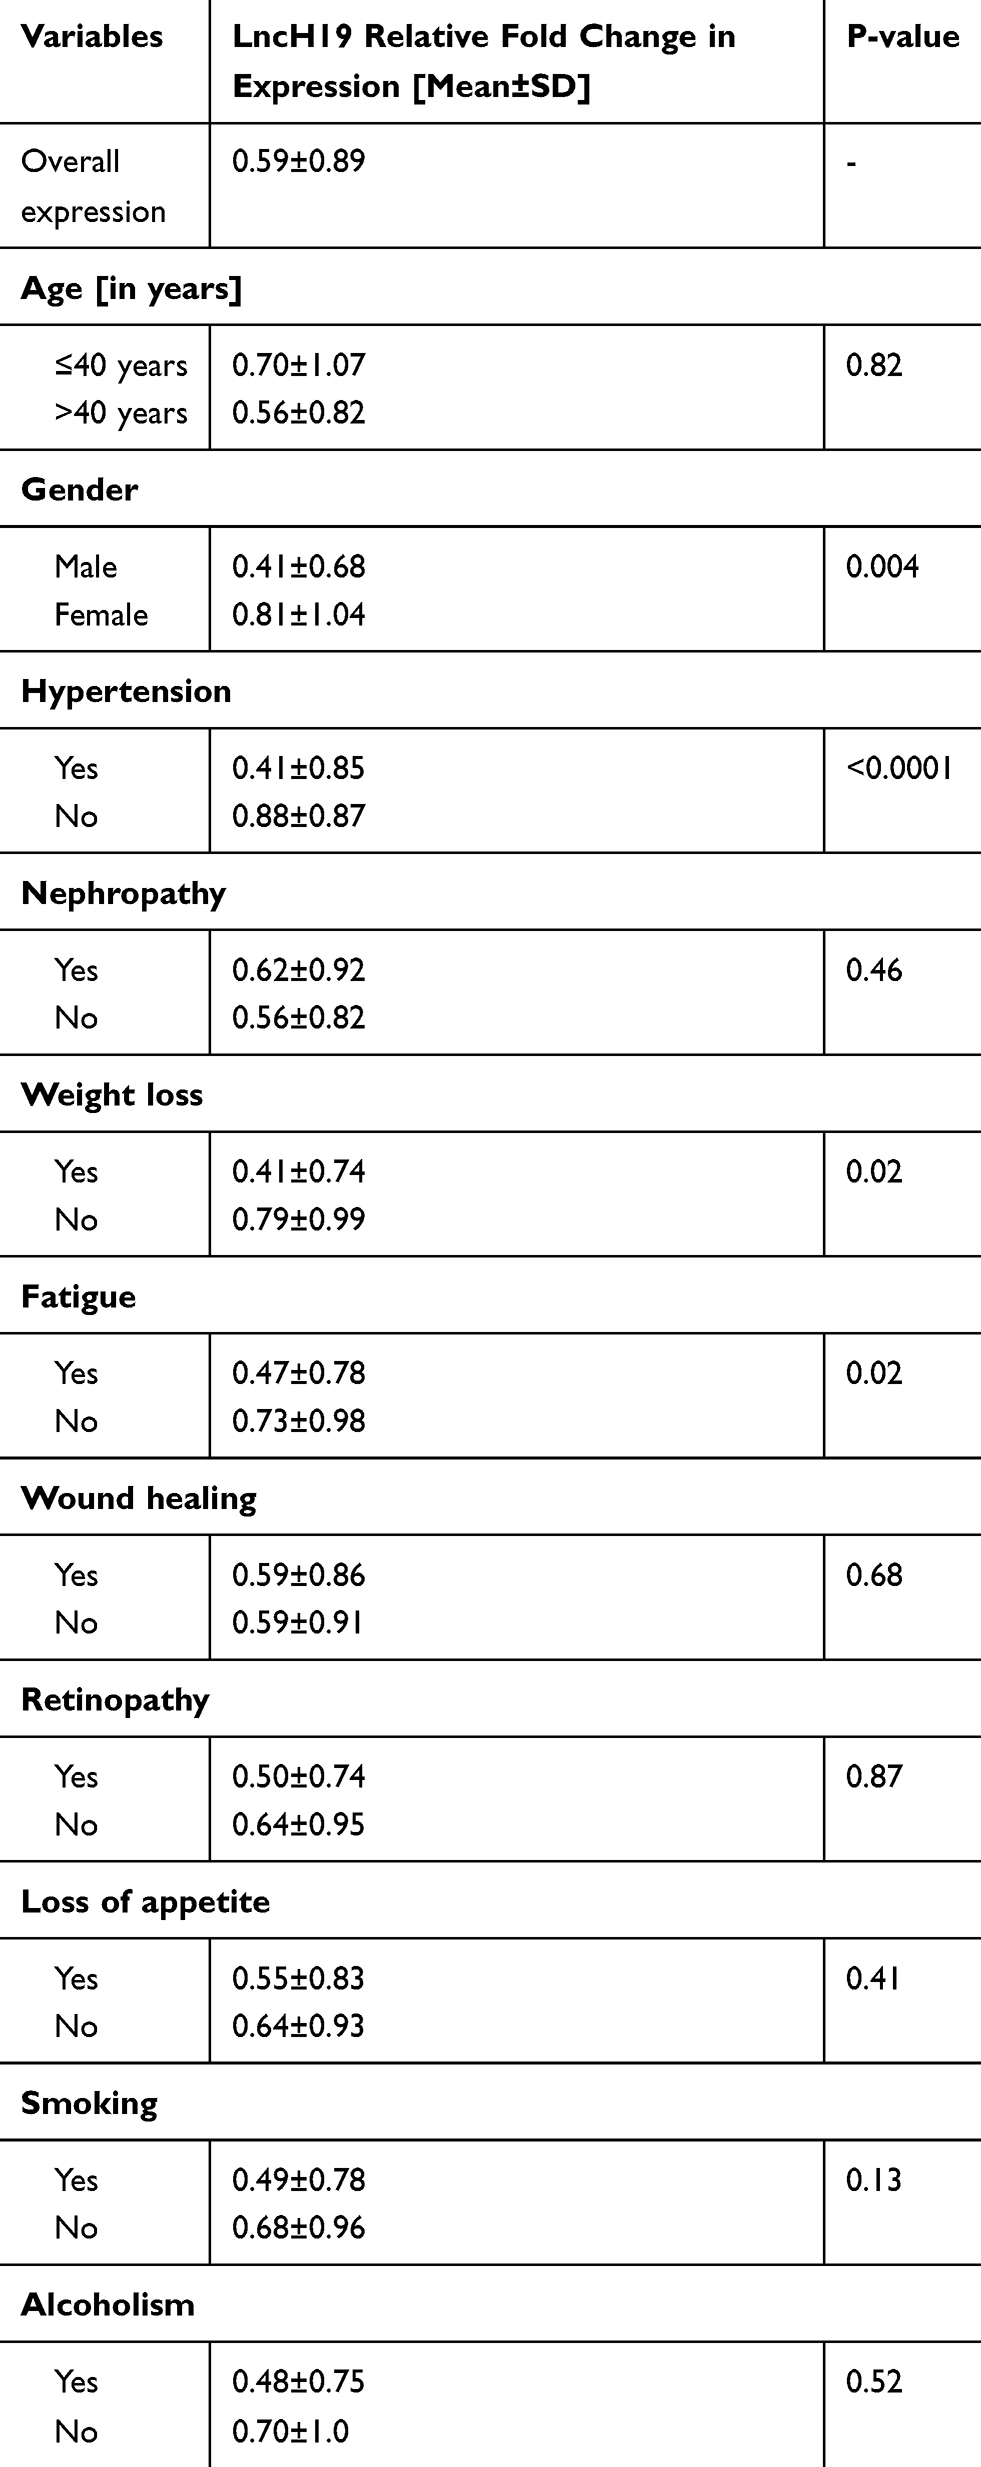 |
Table 3 Long Non-Coding RNA H19 Expression in Type 2 Diabetes Mellitus Subjects |
Association of microRNA-29a Among T2DM Patients
T2DM patients showed an overall 5.62 mean fold expression of miRNA-29a compared to healthy controls [Table 4]. T2DM patients who were hypertensive showed 5.96-fold miRNA-29a expression, whereas non-hypertensive reported having 5.09-fold miRNA-29a expression. Besides, the differences between diabetic smoker and non-smoker patients in H19 expression were observed to be statistically significant [P<0.0001]. We also studied whether cigarette smoking has an impact on miRNA-29a expression. We observed that the T2DM patients with smoking habit showed 5.98-fold miRNA-29a expression, and non-smokers showed 5.24-fold miRNA-29a expression [P=0.04]. T2DM subjects with the habit of alcohol consumption showed 6.17-fold miRNA-29a expression, while non-alcoholic T2DM patients showed 5.04-fold miRNA-29a expression. Furthermore, a statistically significant correlation was observed in H19 expression between alcoholic and non-alcoholic diabetic patients [P<0.0001]. Our observations illustrated that miRNA-29a expression in T2DM patients is directly associated with hypertension and alcohol consumptions.
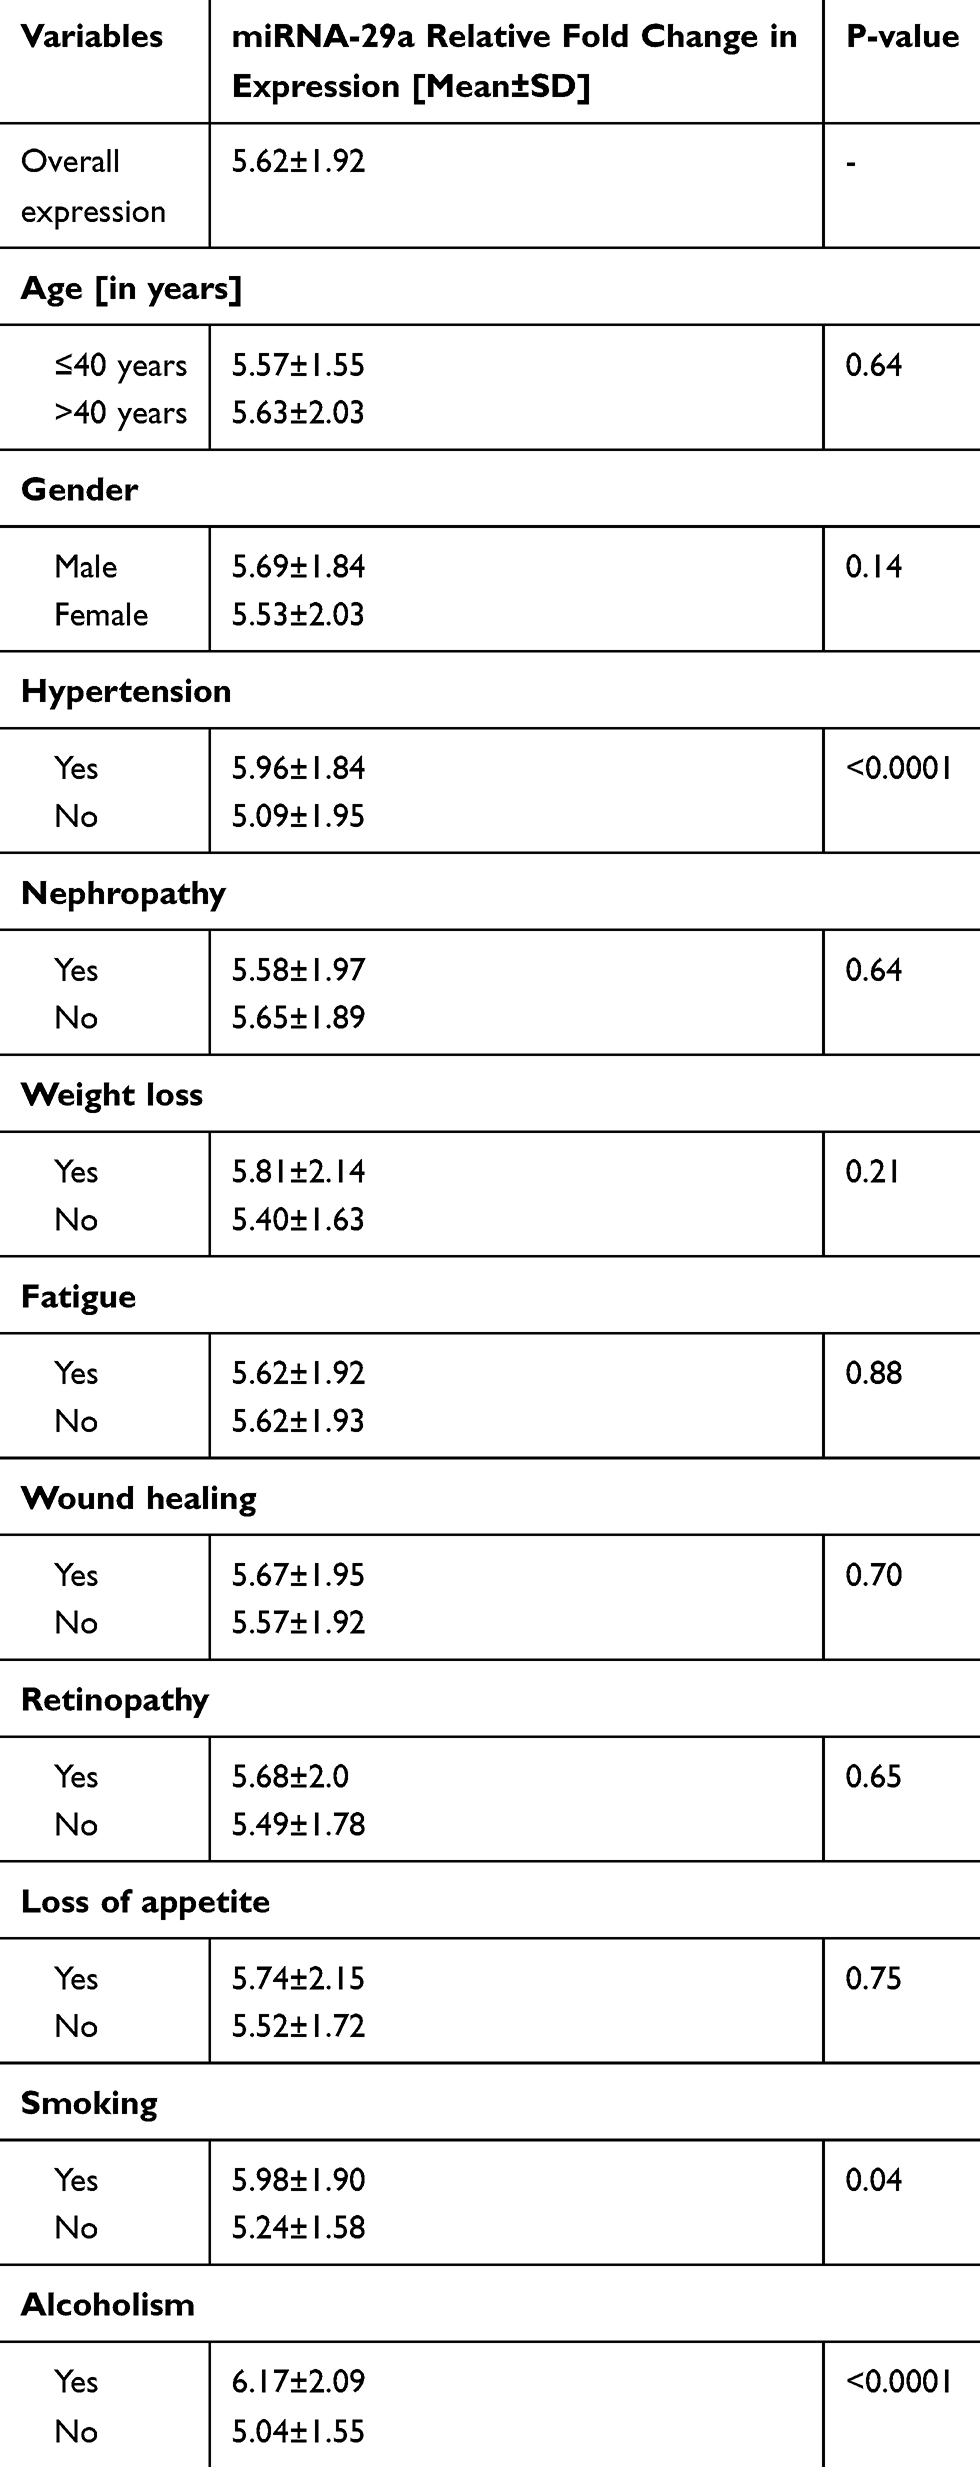 |
Table 4 miR-29a Expression in Subjects with Type 2 Diabetes Mellitus |
Association of microRNA-29b Expression Among T2DM Patients
T2DM patients showed an overall 5.58 mean fold expression of miRNA-29b compared to healthy controls [Table 5]. T2DM patients who were hypertensive showed 5.85-fold miRNA-29b expression while non-hypertensive showed 5.17-fold miRNA-29b expression. Statistical analyses revealed differences between analyzed groups [P=0.0001]. Furthermore, T2DM patients who had weight-loss showed 5.91-fold miRNA-29b expression, while those who did not show weight loss had 5.21-fold miRNA-29b expression [P=0.002]. Smoker T2DM patients showed 6.16-fold miRNA-29b expression, while non-smokers showed 5.10-fold miRNA-29b expression [P=0.0002]. Alcoholic T2DM patients showed 6.11-fold miRNA-29b expression, while non-alcoholic T2DM patients showed 5.04-fold miRNA-29b expression [P<0.0001].
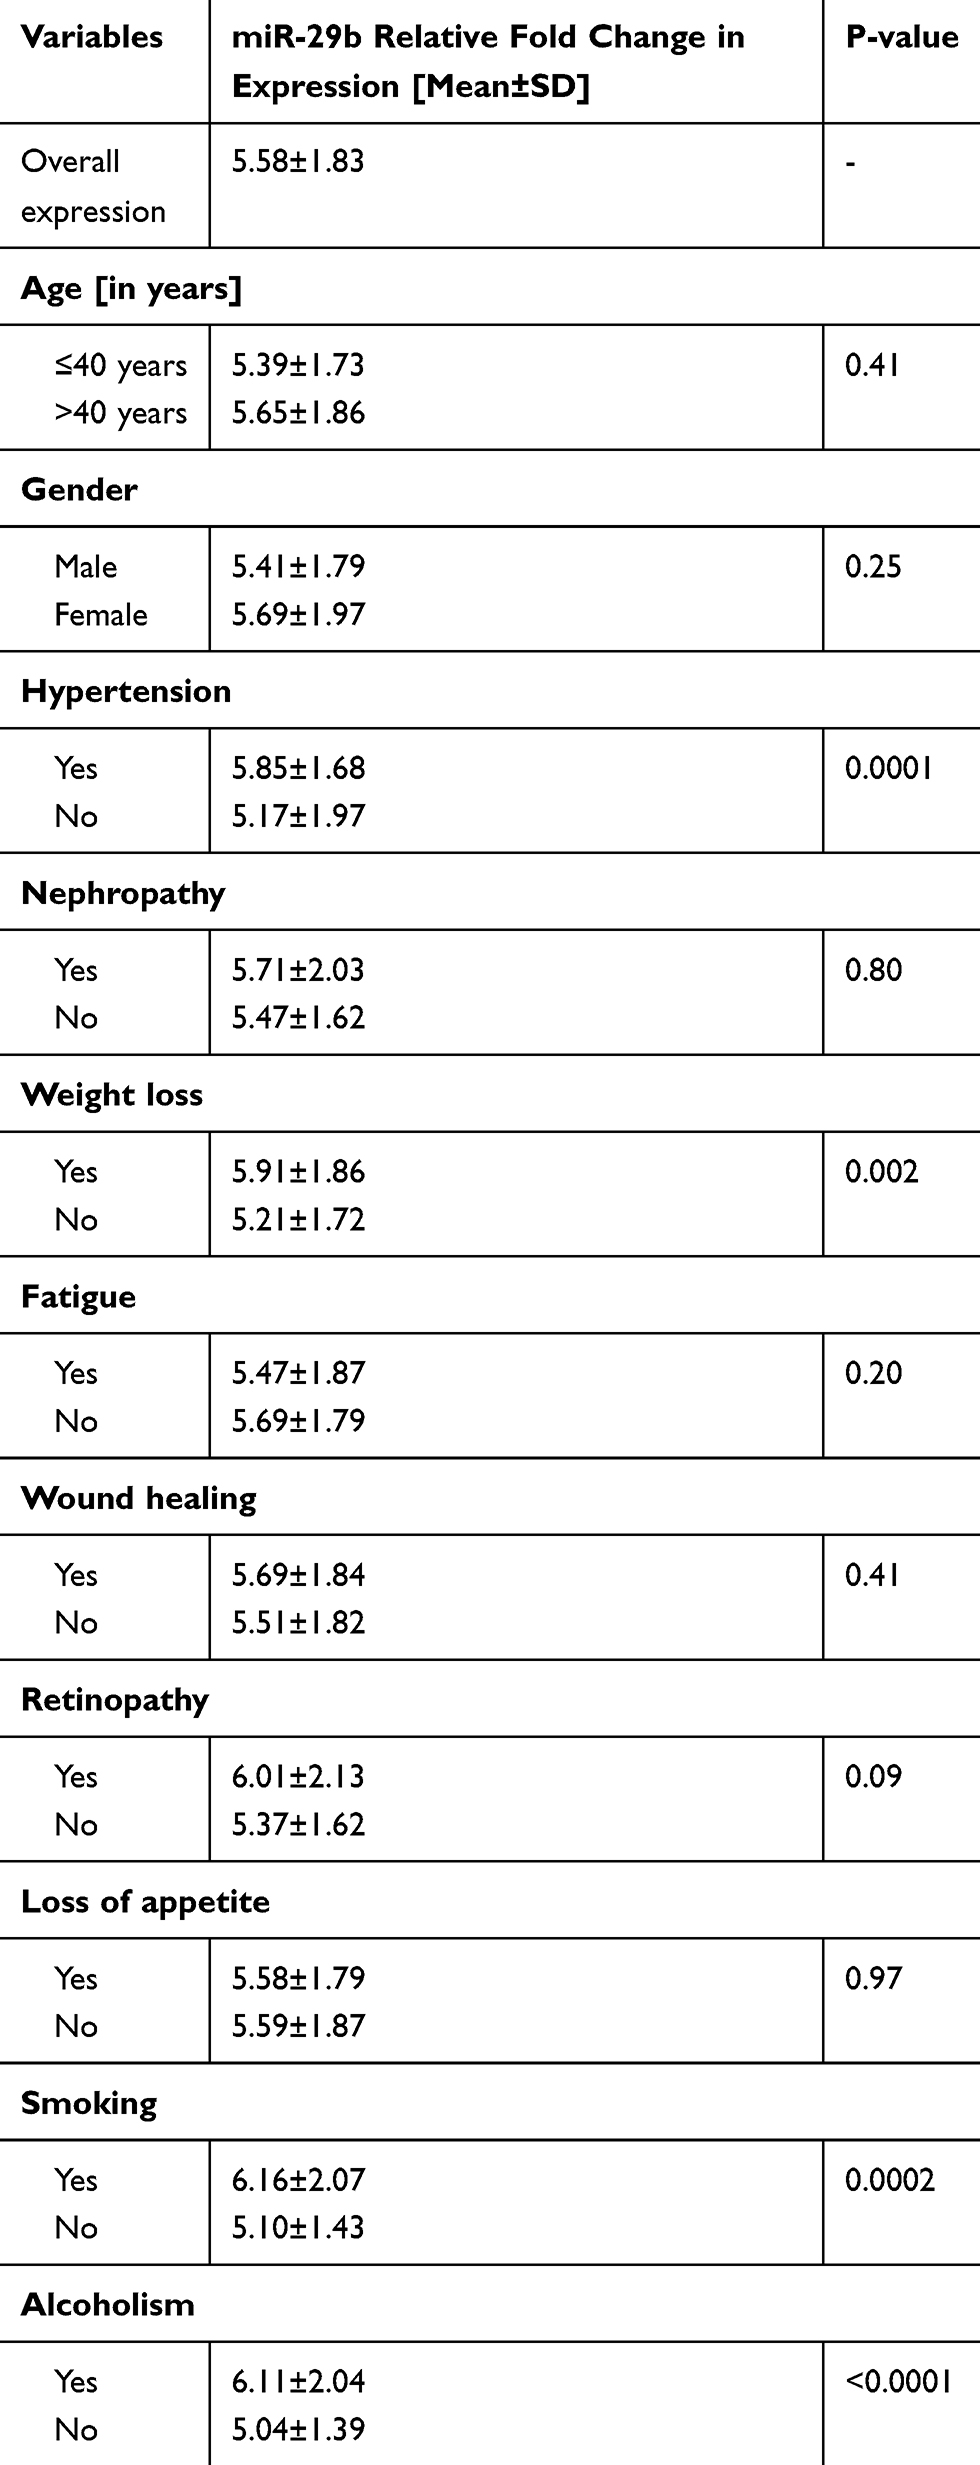 |
Table 5 miR-29b Expression in Type 2 Diabetes Mellitus Patients |
lncRNA H19, miRNA-29a, and miRNA-29b Relative Fold Changes in Expression and Biochemical Parameters with Among T2DM Patients
Regression analysis was done to check the effect of all the parameters such as H19, VLDL, PPG, FPG, BP (Diastolic), Cholesterol, BP (systolic), Hba1c, HDL, TG, LDL with miRNA29a, miRNA29b relative fold changes in expression, and the observed R2 value was 0.13 (p=0.003) and 0.14 (p=0.001) (Table 6). The beta coefficient was also calculated and the observed beta value for lncH19 to miRNA-29a was −0.298 (p<0.0001) and concerning miRNA-29a was −0.28 (p<0.0001) (Table 7).
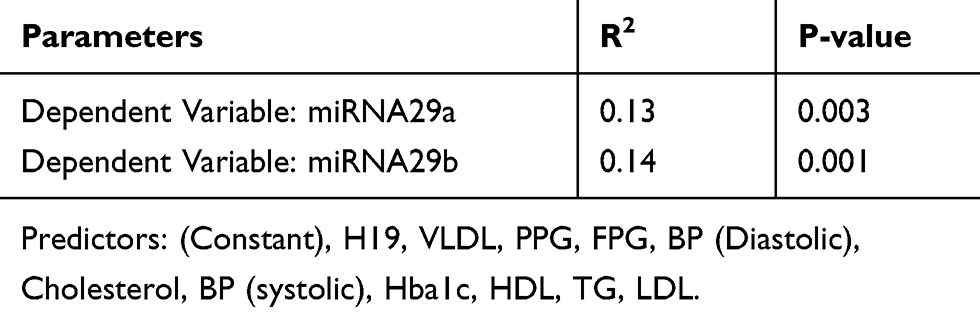 |
Table 6 Association of lncRNA H19 with miRNA29a and miRNA29b |
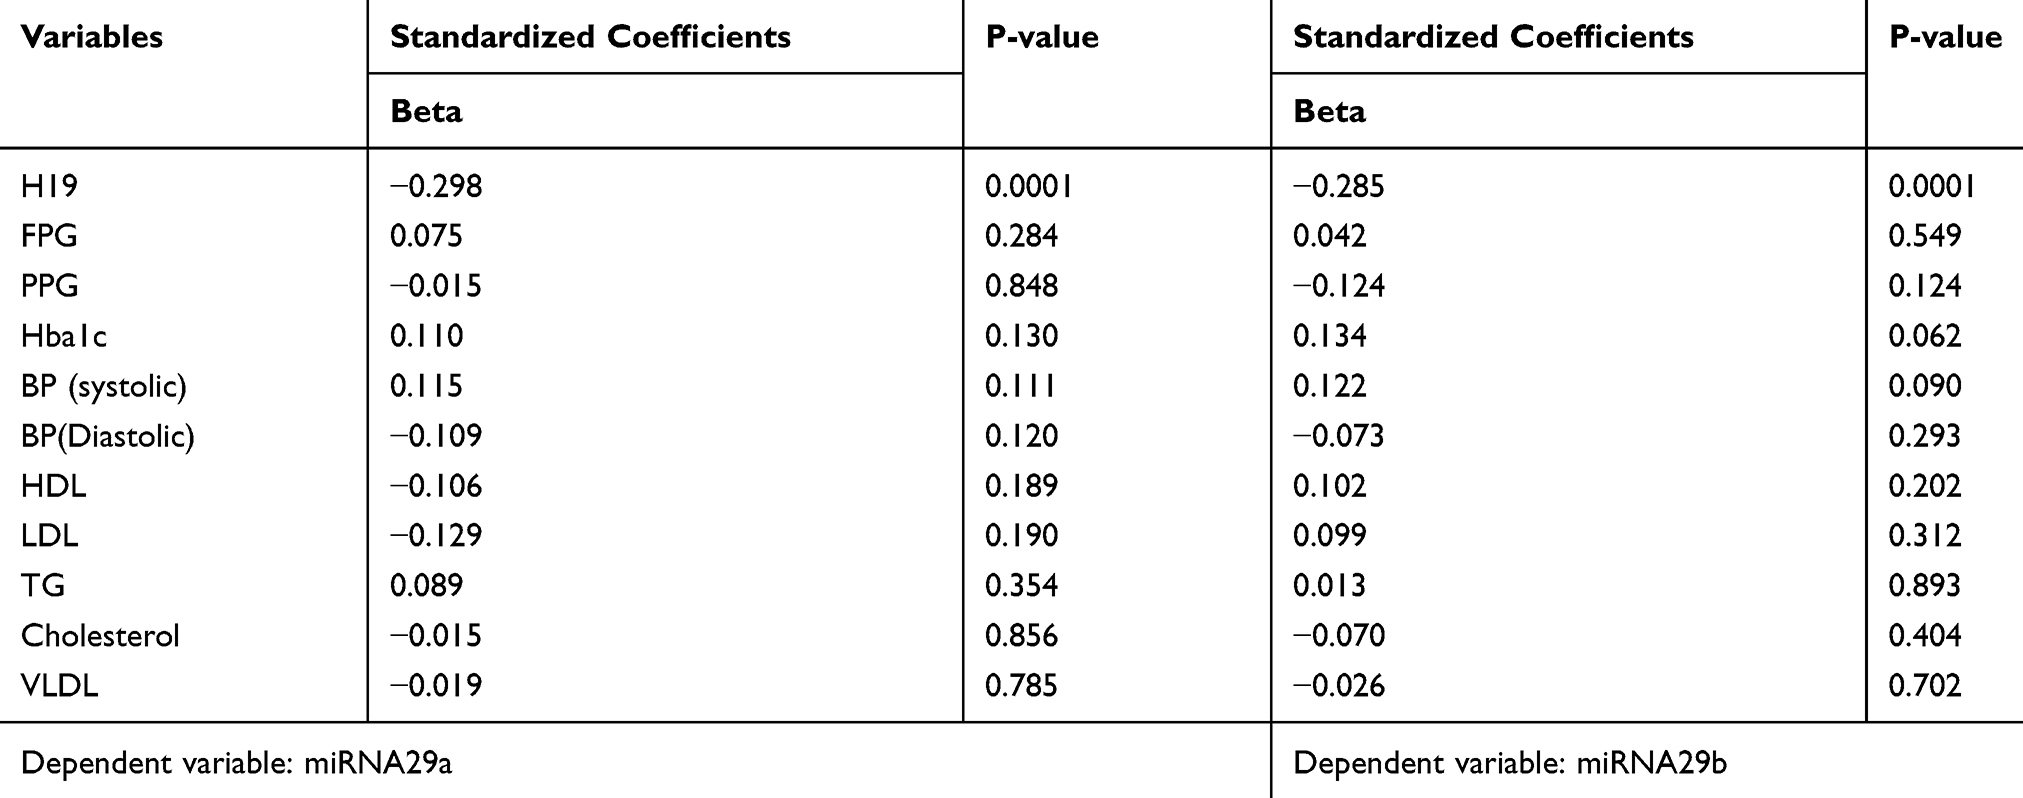 |
Table 7 Association of lncRNA H19 and Biochemical Parameters with miRNA29a and miRNA29b |
Association of IncRNA H19 with miRNA-29a and miRNA-29b
A significant association of low [≤1 fold] and high [>1 fold] expression of lncRNA H19 with miRNA29a and miRNA29b is observed [Figure 1]. It was analyzed that the T2DM patients who had low expression of lncRNA H19 showed 5.91-fold miRNA-29a expression and high expression of lncRNA H19 showed 4.60 fold changes in miRNA-29a expression and difference among them was found to be statistically significant [P=0.005]. T2DM patients who had low expression of lncRNA H19 showed 7.21-fold miRNA-29b expression and high expression of lncRNA H19 showed 4.69-fold miRNA-29b expression was observed [P<0.0001].
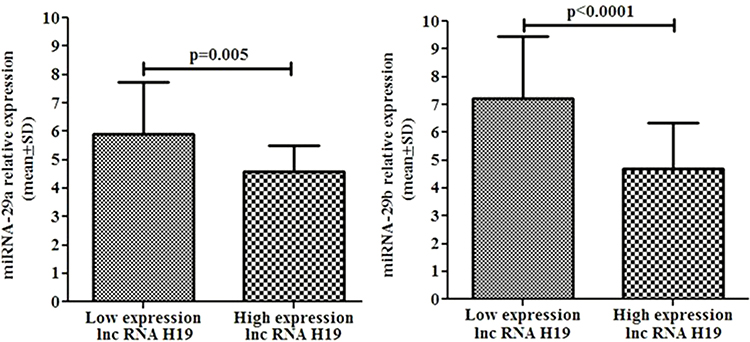 |
Figure 1 Association of lncRNA H19 expression with miRNA29a and miRNA29b expression. |
Correlation of lncRNA H19 with miRNA-29a and miRNA-29b
Spearman correlation was done to check the association of lncRNA H19 with miRNA-29a and miRNA-29b [Figure 2]. Analysis showed a negative correlation of lncRNA H19 expression with miRNA-29a [r= −0.27, P<0.0001] as well as negative correlation with miRNA-29b [r= −0.47, P<0.0001] was observed. Suggesting a possible interaction that decreased in lncRNA H19 expression may influence an increased expression of miRNA-29a and miRNA-29b.
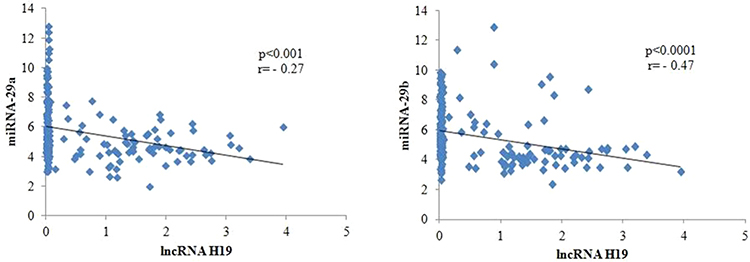 |
Figure 2 Correlation of lncRNA H19 with miRNA-29a and miRNA-29b. |
Discussion
Diabetes mellitus is a metabolic disorder that developed due to insufficient insulin secretion from β-cells of the pancreas.18 The frequency of T2DM has increased in a few decades and to date affects more than 300 million lives worldwide due to increased sedentary life and easy access to fast foods.19 The pathogenesis of T2DM is associated with a genetic disposition, environmental exposures, and multiple causes.20 Long non-coding RNA H19 is a multifunctional long noncoding RNA that is functionally involved in the nucleus and the cytoplasm.7 In T2DM patients, five times lower H19 expression was observed in skeletal muscle compared to healthy individuals.8 Zhuo et al have shown that diabetic rats had decreased expression of H19 as well as in high glucose exposed to neonatal cardiomyocytes.21
A downregulation of cell-free lncRNA H19 was observed in diabetes,22 and in the same way, the present study revealed decreased cell-free lncRNA H19 expression associated with gender, hypertension, weight loss, and fatigue. Male T2DM patients showed 0.40-fold down-regulation, hypertensive T2DM patients showed 0.47-fold down-regulation, T2DM patients who had weight-loss showed 0.38-fold down-regulation, T2DM patients who had fatigue showed 0.26-fold down-regulation of lncRNA H19 expression compared to its counterpart. Increased cell-free miRNA-29a and miRNA-29b expressions were observed among T2DM patients. It has revealed that the cell-free miRNA-29a expression was linked with hypertension and alcoholism. miRNA-29b expression was linked with hypertension, weight loss, smoking, and alcoholism. Increased expression of the miRNA-29 family recorded in different tissues such as the liver23 and β cells of diabetic rodent models and humans.24
Essentially, an increase in miRNA-29 expression level in the serum of children diagnosed with T1DM and adult T2DM patients was observed.25 Hyperglycemia is the primary situation of diabetes mellitus and leads to up-regulates the expression of miRNA-29a and miRNA-29b.26 Roggli et al revealed that patients treated with proinflammatory cytokine induce the miRNA-29 family members’ expression level in human beings and mouse pancreatic cells. Moreover, an increase in the expression of miRNA-29 family miRNAs is associated with the early step of diabetes in mice.27 It has been shown that miRNA-29 suppression by using anti-miRNA-29 oligomers decreases the expression and protects the patients against diabetic nephropathy.26
Pancreatic islets showed upregulation of miRNA-29a and miRNA-29b and involved in β-cell death, initiation of diabetes, and suggested to be the reliable diabetic marker.24 Dahlman has revealed that the T2DM patient’s skeletal muscles showed increased expression of miRNA-29 family members compared to the non-diabetic person.28 miRNA-29b was over-expressed in diabetic rat’s muscle cells and correlated with the negative GLUT4 expression, and miRNA-29a has previously been validated as repressors of GLUT4, increased miRNA-29a expression was observed in vastus lateralis muscle T2DM, and GLUT4 protein expression was observed to decrease in mice skeletal muscle over-expressing miRNA-29a,29 as well as in C2C12 muscle cells.30 Expression of GLUT4 level has been reported to decrease in 3T3-L1 adipocytes over-expressing miRNA-29a, miRNA-29b.31
This study observed the T2DM patients who had expression level ≤1 fold of lncRNA H19 showed higher expression while >1 fold of lncRNA H19 had lower expression comparatively. It was also found that the lncRNA H19 expression had a negative correlation with miRNA-29a and miRNA-29b. This suggested that decreased lncRNA H19 expression showed to increased expression of miRNA-29a and miRNA-29b. In support of the present study, Hee et al in 2007 and Karolina et al in 2011 also revealed that the miRNA-29 family was increased in several tissues, skeletal muscle, derived from diverse rat models of T2DM.32,33 It has also been revealed that miRNA-29a and miRNA-29b were up-regulated in T2DM patients’ skeletal muscle tissue28 study done by Zhang et al in 2020, indicated that lncRNAs are important regulators of DM and are thus likely to serve as important diagnostic and therapeutic targets for this disorder.34 Increased miRNA-29a expression was observed in T2DM and the present study provides support for the exploration of miR-29a antagonists as a potential therapeutic approach for T2DM treatment and the associated metabolic complications.35 Huang et al revealed that lncRNA H19 could bind to miRNA-29a competitively following miRNA response elements (MREs) of miRNA-29a and affects the expression.15 Zhong et al said that lncH19 sponge the miRNA-29b,16 and Lv et al also stated that H19 could directly bind to miR-29b and reduces its expression.17 Over-expression of miR-29a levels was positively associated with metabolic disorders and demonstrated to have a potential value as biomarkers in disease prognosis36 as well as a study by Ying et al in 2018, stated that increased miRNAs miR-29b was observed in T2DM patients.37 A study was done by Massart et al in 2017 and revealed that miR-29 acts as an important regulator of insulin-stimulated glucose metabolism and showed relevance in type 2 diabetes.29
Conclusions
The present study observed decreased expression of cell-free lncRNA H19 and increased expression of miRNA-29a as well as miRNA-29b in T2DM patients, Decreased expression was linked with hypertension, weight loss, and fatigue. Increased cell-free miRNA-29a expression was linked with hypertension, smoking, and alcoholism while miRNA-29b expression was linked with hypertension, weight loss, smoking, and alcoholism. This suggested that decreased expression of cell-free lncRNA H19, increased expression of miRNA-29a and miRNA-29b may be associated with the worseness of disease and involved in the pathogenesis of the disease. miRNA-29a and miRNA-29b expression alteration observed to link with mainly smoking and alcoholism and this would be a factor to increase the severity of the disease. This data shed light on this gene interaction may be an essential factor for disease occurrence and worseness of disease. LncRNA H19, miRNA-29a, and miRNA-29b expression pattern information for the diagnosis/prognosis and management of T2DM cases. Further investigations are warranted to derive the difference in gene expression among T2DM cases.
Data Sharing Statement
The datasets used and analyzed during the present study would be available from the corresponding author.
Ethics Approval and Consent to Participate
The study has been conducted only after the due clearance and approval from the Ethics committee of GKV (vide Proposal No. 14/08/2015/GKC/IEC/2015) has. As part of a mandatory standardized ethical norm, a written with signed informed consent was taken from the particular person before inclusion in the research work, and all the ethical principles regarding human experimentation were followed and the study was conducted in accordance with the Declaration of Helsinki.
Acknowledgment
The authors extend their appreciation to the Deanship of Scientific Research at King Khalid University for funding this work through the General Research Project under grant number [G.R.P- 298]. We gratefully acknowledge the study subjects who were part of this study.
Funding
Deanship of Scientific Research at King Khalid University for funding this work through the General Research Project under grant number [G.R.P-298].
Disclosure
The authors report no conflicts of interest for this work.
References
1. Rines AK, Sharabi K, Tavares CD, Puigserver P. Targeting hepatic glucose metabolism in the treatment of type 2 diabetes. Nat Rev Drug Discov. 2016;15(11):786–804.
2. Hatting M, Tavares CDJ, Sharabi K, et al. Insulin regulation of gluconeogenesis. Ann N Y Acad Sci. 2018;1411(1):21–35.
3. Bernstein BE, Birney E, Dunham I, et al. An integrated encyclopedia of DNA elements in the human genome. Nature. 2012;489:57–74.
4. Mercer TR, Dinger ME, Mattick JS. Long non-coding RNAs: insights into functions. Nat Rev Genet. 2009;10:155–159. doi:10.1038/nrg2521
5. Tsai MC, Spitale RC, Chang HY. Long intergenic noncoding RNAs: new links in cancer progression. Cancer Res. 2011;71:3–7. doi:10.1158/0008-5472.CAN-10-2483
6. Simion V, Haemmig S, Feinberg MW. LncRNAs in vascular biology and disease. Vascul Pharmacol. 2018;114:145–156. doi:10.1016/j.vph.2018.01.003
7. Gabory A, Jammes H, Dandolo L. The H19 locus: role of an imprinted non-coding RNA in growth and development. Bioessays. 2010;32:473–480. doi:10.1002/bies.200900170
8. Gao Y, Wu F, Zhou J, et al. The H19/let-7 double-negative feedback loop contributes to glucose metabolism in muscle cells. Nucleic Acids Res. 2014;42:13799–13811. doi:10.1093/nar/gku1160
9. Bartel DP. MicroRNAs: genomics, biogenesis, mechanism, and function. Cell. 2004;116:281–297.
10. Friedman RC, Farh KK, Burge CB, et al. Most mammalian mRNAs are conserved targets of microRNAs. Genome Res. 2009;19:92–105. doi:10.1101/gr.082701.108
11. Guay C, Roggli E, Nesca V, et al. Diabetes mellitus, a microRNA-related disease? Transl Res. 2011;157:253–264.
12. Park SY, Jeong HJ, Yang WM, et al. Implications of microRNAs in the pathogenesis of diabetes. Arch Pharm Res. 2013;36:154–166. doi:10.1007/s12272-013-0017-6
13. Kriegel AJ, Liu Y, Fang Y, et al. The miR-29 family: genomics, cell biology, and relevance to renal and cardiovascular injury. Physiol Genomics. 2012;44:237–244. doi:10.1152/physiolgenomics.00141.2011
14. Eyholzer M, Schmid S, Wilkens L, et al. The tumor-suppressive miR-29a/b1 cluster is regulated by CEBPA and blocked in human AML. Br J Cancer. 2010;103:275–284. doi:10.1038/sj.bjc.6605751
15. Huang M, Zhong Z, Lv M, Shu J, Tian Q, Chen J, Comprehensive analysis of differentially expressed profiles of lncRNAs and circRNAs with associated co-expression and ceRNA networks in bladder carcinoma.
16. Zhong M, Chen Y, Zhang G, Xu L, Ge W, Wu B. LncRNA H19 regulates PI3K–Akt signal pathway by functioning as a ceRNA and predicts poor prognosis in colorectal cancer: integrative analysis of dysregulated ncRNA‑associated ceRNA network. Cancer Cell Int. 2019;19(148). doi:10.1186/s12935-019-0866-2
17. Lv Mengxin, Zhong Z, Huang M, Tian Q, Jiang R, Chen J. lncRNA H19 regulates epithelial-mesenchymal transition and metastasis of bladder cancer by miR-29b-3p as competing endogenous RNA. Biochim Biophys Acta Mol Cell Res. 2017;1864(10):1887–1899. doi:10.1016/j.bbamcr.2017.08.001
18. DeFronzo RA, Abdul-Ghani M. Type 2 diabetes can be prevented with early pharmacological intervention. Diabetes Care. 2011;34(Suppl. 2):S202–S209. doi:10.2337/dc11-s221
19. Danaei G, Finucane MM, Lu Y, et al. National, regional, and global trends in fasting plasma glucose and diabetes prevalence since 1980: systematic analysis of health examination surveys and epidemiological studies with 370 country-years and 2.7 million participants. Lancet. 2011;378:31–40. doi:10.1016/S0140-6736(11)60679-X
20. Berends LM, Ozanne SE. Early determinants of type-2 diabetes. Best Pract Res Clin Endocrinol Metab. 2012;26:569–580. doi:10.1016/j.beem.2012.03.002
21. Zhuo C, Jiang R, Lin X, et al. lncRNA H19 inhibits autophagy by epigenetically silencing of DIRAS3 in diabetic cardiomyopathy. Oncotarget. 2017;8:1429–1437. doi:10.18632/oncotarget.13637
22. Moran VA, Perera RJ, Khalil AM. Emerging functional and mechanistic paradigms of mammalian long non-coding RNAs. Nucleic Acids Res. 2012;40:6391–6400. doi:10.1093/nar/gks296
23. Arnold N, Koppula P, Gul R, et al. Regulation of cardiac expression of the diabetic marker microRNA miR-29. PLoS One. 2014;25:e103284. doi:10.1371/journal.pone.0103284
24. Bagge A, Clausen TR, Larsen S, et al. MicroRNA-29a is up-regulated in beta-cells by glucose and decreases glucose-stimulated insulin secretion. Biochem Biophys Res Commun. 2012;426:266–272. doi:10.1016/j.bbrc.2012.08.082
25. Kong L, Zhu J, Han W, et al. Significance of serum microRNAs in prediabetes and newly diagnosed type 2 diabetes: a clinical study. Acta Diabetol. 2011;48:61–69. doi:10.1007/s00592-010-0226-0
26. Long J, Wang Y, Wang W, et al. MicroRNA-29c is a signature microRNA under high glucose conditions that targets sprouty homolog 1, and its in vivo knockdown prevents progression of diabetic nephropathy. J Biol Chem. 2011;286:11837–11848. doi:10.1074/jbc.M110.194969
27. Roggli E, Gattesco S, Caille D, et al. Changes in microRNA expression contribute to pancreatic beta-cell dysfunction in prediabetic NOD mice. Diabetes. 2012;61:1742–1751. doi:10.2337/db11-1086
28. Dahlmans D, Houzelle A, Jörgensen JA, et al. Evaluation of muscle microRNA expression in relation to human peripheral insulin sensitivity: a cross-sectional study in metabolically distinct subject groups. Front. Physiol. 2017;8:711. doi:10.3389/fphys.2017.00711
29. Massart J, Sjogren RJO, Lundell LS, et al. Altered miR-29 expression in type 2 diabetes influences glucose and lipid metabolism in skeletal muscle. Diabetes. 2017;66:1807–1818. doi:10.2337/db17-0141
30. Zhou Y, Gu P, Shi W, et al. MicroRNA-29a induces insulin resistance by targeting PPARd in skeletal muscle cells. Int J Mol Med. 2016;37:931–938. doi:10.3892/ijmm.2016.2499
31. Song H, Ding L, Zhang S, et al. MiR-29 family members interact with SPARC to regulate glucose metabolism.MiR-29 family members interact with SPARC to regulate glucose metabolism. Biochim Biophys Res Commun. 2018;497:667–674. doi:10.1016/j.bbrc.2018.02.129
32. He A, Zhu L, Gupta N, et al. Overexpression of micro ribonucleic acid 29, highly up regulated in diabetic rats, leads to insulin resistance in 3T3-L1 adipocytes. Mol Endocrinol. 2007;21:2785–2794. doi:10.1210/me.2007-0167
33. Karolina DS, Armugam A, Tavintharan S, et al. MicroRNA 144 impairs insulin signaling by inhibiting the expression of insulin receptor substrate 1 in type 2 diabetes mellitus. PLoS One. 2011;6:e22839. doi:10.1371/journal.pone.0022839
34. Pengyu Z, Yan Y, Xiying F, et al. The differential expression of long noncoding RNAs in Type 2 diabetes mellitus and latent autoimmune diabetes in adults. Int J Endocrinol. 2020;Article ID 9235329.
35. Peng W, Wang Q, Jiang C, Chen C, Liu Y, ChenY, et al. MicroRNA-29a is involved lipid metabolism dysfunction and insulin resistance in C2C12 myotubes by targeting PPARδ. Mol Med Rep. 2018;17:8493–8501.
36. Lin X, Luo C, Dongjuan H, et al. Urinary miRNA-29a-3p levels are associated with metabolic parameters via regulation of IGF1 in patients with metabolic syndrome. Biomed Rep. 2019;10:250–258.
37. Zhi Liang Y, Li J, Xiao H, He Y, Zhang L, Yan Y. Identification of stress‐related microRNA biomarkers in type 2 diabetes mellitus: A systematic review and meta‐analysis. Journal of Diabetes. 2020;12(9):633–644. doi:10.1111/1753-0407.12643
 © 2020 The Author(s). This work is published and licensed by Dove Medical Press Limited. The full terms of this license are available at https://www.dovepress.com/terms.php and incorporate the Creative Commons Attribution - Non Commercial (unported, v3.0) License.
By accessing the work you hereby accept the Terms. Non-commercial uses of the work are permitted without any further permission from Dove Medical Press Limited, provided the work is properly attributed. For permission for commercial use of this work, please see paragraphs 4.2 and 5 of our Terms.
© 2020 The Author(s). This work is published and licensed by Dove Medical Press Limited. The full terms of this license are available at https://www.dovepress.com/terms.php and incorporate the Creative Commons Attribution - Non Commercial (unported, v3.0) License.
By accessing the work you hereby accept the Terms. Non-commercial uses of the work are permitted without any further permission from Dove Medical Press Limited, provided the work is properly attributed. For permission for commercial use of this work, please see paragraphs 4.2 and 5 of our Terms.