")
Back to Journals » Clinical Interventions in Aging » Volume 15
Assessment of Age-Induced Changes in Body Fat Percentage and BMI Aided by Bayesian Modelling: A Cross-Sectional Cohort Study in Middle-Aged and Older Adults
Authors Macek P , Terek-Derszniak M , Biskup M , Krol H , Smok-Kalwat J, Gozdz S , Zak M
Received 19 August 2020
Accepted for publication 10 November 2020
Published 8 December 2020 Volume 2020:15 Pages 2301—2311
DOI https://doi.org/10.2147/CIA.S277171
Checked for plagiarism Yes
Review by Single anonymous peer review
Peer reviewer comments 4
Editor who approved publication: Dr Richard Walker
Pawel Macek,1,2 Malgorzata Terek-Derszniak,3 Malgorzata Biskup,1,3 Halina Krol,1,4 Jolanta Smok-Kalwat,5 Stanislaw Gozdz,1,5 Marek Zak1
1Institute of Health Sciences, Collegium Medicum, The Jan Kochanowski University, Kielce, Poland; 2Department of Epidemiology and Cancer Control, Holycross Cancer Centre, Kielce, Poland; 3Department of Rehabilitation, Holycross Cancer Centre, Kielce, Poland; 4Research and Education Department, Holycross Cancer Centre, Kielce, Poland; 5Clinical Oncology Clinic, Holycross Cancer Centre, Kielce, Poland
Correspondence Marek Zak
The Institute of Health Sciences, Collegium Medicum, The Jan Kochanowski University, Ul. Zeromskiego 5, Kielce 25-369, Poland
Tel (+48) 41 349 69 09
Fax (+48) 41 349 69 16
Email [email protected]
Background: Loss of fat-free mass (FFM) and gain in body fat (BF) are the key disability risk factors, also instrumental in perpetuating already existing functional disorders. Obesity construed in terms of body mass index (BMI) values, in view of undesirable gain in BF, is a risk factor for cardio-metabolic disorders. Both detrimental processes clearly evidence a scope of involutionary changes characteristic of an aging population, also standing for one of its greatest burdens.
Purpose: The present study aimed to assess the changes in body composition (BC), in conjunction with the relationship between BF% and BMI, for defining overweight and obesity status in middle-aged and older adults, against the select indicator variables under study.
Materials and Methods: The study involved 4799 individuals (33.7% men), PONS Project participants, aged 43– 64 years. BF% was measured with the aid of bioelectrical impedance analysis (BIA) method. Age-induced changes in BC were determined against BF%, fat mass (FM), FFM, BMI, fat mass index (FMI), and fat-free mass index (FFMI). The relationship between BF% and BMI was established with the aid of Bayesian regression models, adjusted for gender and age.
Results: In both genders, BF% increased with age at a similar annual rate. The reduction of FFM was noted mainly in men, which in conjunction with BF% gain ensured BMI stability. The increase in BF% in women with stable FFM affected an increase in BMI. Regardless of the BMI threshold, the anticipated (predicted) BF% increased with age in both genders.
Conclusion: Monitoring of BC is of particular importance in older adults, in view of appreciably better characteristics of both the short- and long-term health predictors, as well as overall potential for developing specifically targeted, effective health interventions.
Keywords: age, body fat percentage, body mass index, body composition, obesity, public health
Introduction
Demographic trends indicate a steadily rising prevalence of obesity in older adults, ie another risk factor for health loss in this population group, especially for chronic diseases, directly associated with an increased risk of death.1–5 Obesity is defined as an excessive and health-threatening accumulation of body fat (BF). According to the World Health Organization (WHO), prevalence of obesity in a global population boasts an epidemic character, accounting for more deaths than an underweight status.6 Obesity is most often diagnosed on the basis of body mass index (BMI), even though this indicator leaves a lot to be desired in terms of its accuracy.7–10 BMI calculation formula does not allow for the differences in body composition (BC) related to, eg age, gender, ethnic origin, and race.11,12 Despite existing doubts, BMI is a widely accepted, simple and convenient measure, showing strong and stable associations with BF% and death from all causes.13–15 Some investigators strongly believe that in line with clinical definition of obesity, assessment of the actual percentage of BF would offer a far better indicator, given wide availability of advanced measuring methods.15
Age-related changes in BC result from the coincidence of genetic, behavioural and environmental factors.16,17 They are related, inter alia, to hormonal status, nutrition, physical activity, ethnicity, and an incidence of diseases.18 Awareness of the factors instrumental in inducing changes in BC and, above all, the very nature of these changes, is essential in terms of current assessment of individual health status, prediction of the actual risk of its deterioration/loss, and a scope of preventive actions to be undertaken.19 Age-induced changes in BC increase both the risk of cardiometabolic disorders and disability.20 The appropriate contribution of fat mass (FM) and fat-free mass (FFM) to body weight makes an essential risk indicator of major issues in public health services at large.21 Under physiological conditions, skeletal muscle mass accounts for about half of FFM.22 Age-dependent deficit of FFM combined with stable or growing BF promotes sarcopenic development of obesity.23,24 This particular type of obesity is one of the risk factors for disability in old age, or a factor perpetuating already existing disorders in the locomotor system.25,26 On the other hand, obesity construed in terms of BMI≥30 kg/m2, in conjunction with excessive accumulation of BF, regardless of the changes in FFM, has for years been deemed one of the major risk factors for cardio-metabolic disorders.27,28
The present study aimed therefore to assess specific changes in BC, in conjunction with gaining an insight into the relationship between BF% and BMI in the middle-aged and older adults, with a view to defining overweight and obesity against the select indicator variables under study.
Materials and Methods
The Polish-Norwegian Study (PONS)
The PONS Project, ie “Establishment of infrastructure for population health research in Poland,” pursued in collaboration with Norwegian researchers, aimed at collecting population data, with a view to assessing the main determinants of individual health, and generally addressing the causes of morbidity and mortality in Poland. Within the period spanning 2010–2011, all men and women aged 45–64 (n=110,000), residents of a single region were invited to attend the PONS study. Ultimately, 13,172 individuals out of the target population were recruited, including 4799 city residents. The study protocol embraced an individual Health Status Questionnaire, medical examination, basic anthropometric measurements, and biological blood and urine sampling. More detailed information on the recruitment for the PONS study may be found in our previously published paper.5
The Authors of the present study are permanently authorised to access the source data sets of the PONS study subjects, as some of those subjects also happen to have been embraced by the HEALTHY KIELCE (Zdrowe Kielce) Project, part of the PONS Project. Proprietary rights to those data sets are held by the Holycross Cancer Centre (HCC), and therefore the Authors, as the staff members of HCC, may freely access them at any time for research purposes, on a free-of-charge basis.
Otherwise, the above-referenced body of data is not publicly accessible, in full compliance with the European Union General Data Protection Regulation (EU GDPR) constraints, and other statutory restrictions in place in Poland. This notwithstanding, the Authors may make a certain part of those data sets available to academic researchers, following their prior conversion into an anonymised format, when approached with a reasonable request, care of the First Author.
Data Verification
In pursuance of the statutory right to access personal data, the present study made use of pertinent data on PONS participants, ie permanent Kielce residents. Based on the assessment of the data completeness, all cases (n=4799; 33.7% of men) were pronounced eligible, as they presented all data required for a detailed assessment of the BC variables under study.
Anthropometric Measurements
Application of models, while assessing body composition, facilitates indirect assessment of the respective compartments within the body. In the present study, whilst making use of bioelectrical impedance analysis methods, the simplest two-compartments (2C) model was applied, effectively dividing the body into an FM compartment, and an FFM compartment, respectively.29 Body weight with an accuracy of up to 0.1 kg, and percentage of body fat percentage (BF%) was assessed with the aid of TANITA S.C.-240 MA tetra polar BC analyser. Due to the unavailability of pertinent data on the FM and FFM in the source database, the missing information on BC components was calculated based on the available information. After verifying the calculation methods of the Tanita S.C.-240 MA analyser on 15 volunteers with full BC measurements, FM was calculated based on the available information on body weight and BF% (BF% was the percentage of FM within the body weight). FFM was calculated as the difference between the body weight and FM. Both FM and FFM were expressed in kilograms.30 Body height in the upright position was measured with an accuracy of 0.1 cm with the aid of SECA height measure. BMI, fat mass index (FMI) and fat-free mass (FFM) index were calculated as the quotient of body mass (kg), FM (kg), FFM (kg), respectively, divided by the height in metre square (kg/m2). In line with WHO recommendations, overweight and obesity were classified as BMI ≥25 kg/m2 and ≥30 kg/m2, respectively.31,32 Pertinent details on the scaling of FM and FFM to body height square are addressed in the Statistical analysis section.
The Individual Health Status Questionnaire
Moderate to vigorous physical activity in leisure (MVPA) was estimated against the International Physical Activity Questionnaire (long version). MVPA was calculated based on the number of days and duration of physical activity in leisure time. Smoking status and alcohol consumption were divided into two broad categories: never (never or former) and current smoker or drinker.
Statistical Analysis
Basic statistics are presented as mean ± standard deviations or absolute number and proportion, depending on the actual type of variable under study. Statistical differences between men and women were estimated by t-test (equal variance), Welch test (unequal variance), or chi-square test (categorical variables). Equal variance was checked by F-test. Statistical differences between 5-year age groups were estimated by Kruskal–Wallis one-way analysis of variance by ranks. The significance of differences between respective age groups was investigated by pairwise comparison test with the Benjamini and Hochberg P value adjustment method. The distribution of BF% and BMI variables according to respective age range groups and gender was estimated by cumulative distribution function. The BMI calculation formula is based on two assumptions, ie (1) the adult body weight is scaled approximately to the square of its height, (2) after adjusting the body weight by the square of its height, adults, regardless of gender, have the same proportion of FM, regardless of body height. The second assumption implies that both FM and the associated FFM, much like BMI, scale up to the square of body height. Several published reports on this particular subject prompted us to have the second assumption critically reviewed. To this end, the approach proposed by Benn33 and Heymsfield34 was applied in which R-squared values were calculated for regression of BMI and FM/heightβ, or BMI and FFM/heightβ. β values varied incrementally from 0.5 to 3.0, in 0.5 increments. R-squared values as a function of β were plotted and, after visual inspection, β values associated with the maximum correlation were selected for FMI and FFMI formulae. Maximum correlations expressed as R-squared between BMI and FM/heightβ or FFM/heightβ in men were similarly observed for β=2.0. Maximum correlations between BMI and FM/heightβ or FFM/heightβ in women were reported for β within the range 2.0–3.0 and 1.5–2.0, respectively. In men, the choice of power equal 2 for height seemed obvious, whereas in women the correlation ranges indicated small differences in the choice of the indicators with power ≈2 for height (Supplementary Figure S1). The correlation between BF% and BMI between gender group and within each age-gender group was examined with the aid of Spearman’s rank correlation coefficients. The significance of the difference between two correlation coefficients was examined using Fisher’s r-to-z transformation with the Bonferroni correction, and P values<0.01 were considered statistically significant. Based on the exploratory analysis, an appropriate function for modelling the posterior probability distribution of BF% was defined. It was established that the relationship between BF% and BMI was best described by the formula BF% = α + β1 x Sex + β2 x Age + β3 x BMI, in which α (intercept) and β (regression coefficient) were estimated against the data actually yielded. The parameters of the linear regression model were estimated with the aid of the Markov Chain Monte Carlo method, by using the MCMC package. MCMC takes advantage of the Gibbs sampling to generate a sample from the posterior distribution of a linear regression, with a view to estimating the linear regression parameters. All statistical analyses were completed in R (version 3.5.3). P values <0.05 were deemed statistically significant.
Sensitivity Analysis
The sensitivity analysis for the association of BF% and BMI, stratified by age and gender, was carried out. All cases (n=2.321) with self-reported comorbidities were deleted from the study database (Figure 1). Then Bayesian regression models were fitted making use of the same set of variables as in the main analysis.
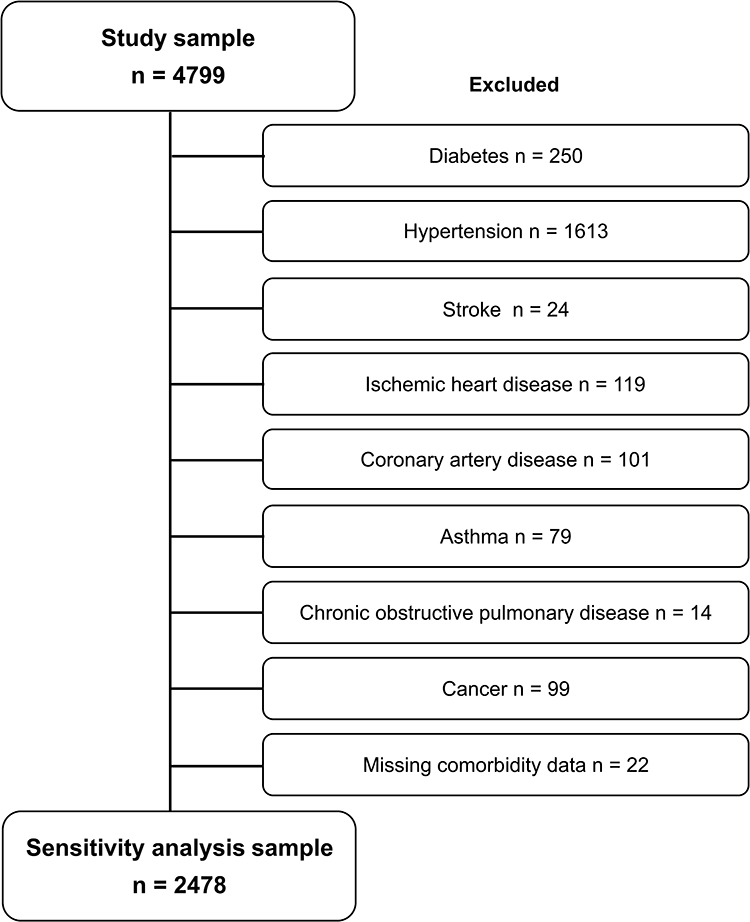 |
Figure 1 Flow diagram of the selection process in the sensitivity analysis. |
Results
The study protocol covered 4799 individuals aged 43–64 years (mean age 55.1 years); men accounting for 33.7% of the population sample (Table 1). The most numerous group was persons aged 55–59y (30.8%), the least numerous - the ones aged 40–44y (3.0). Average height, body weight, BMI, FFM, FFMI, and incidence of overweight and obesity, as well as alcohol consumption were significantly higher in men than in women. Based on BF%, FM, and FMI, significantly higher levels of body fat mass were observed in women, as opposed to men. No significant differences in smoking frequency and MVPA were encountered, neither in men, nor in women.
 |
Table 1 Basic Characteristics of the Study Group Total, Stratified by Gender |
BMI not less than 30 kg/m2 (obesity) was established to be on a par in 25% of men and women (Figure 2). In both genders, BMI increased with age, although in women the dynamics of change was higher than in men. Depending on age, in 25% of men BMI showed a slight range of variability not less than ≈30 kg/m2 to ≈31 kg/m2, while in 25% of women not less than ≈28 kg/m2 to ≈31 kg/m2.BF content not lesser than 30% was noted in 25% of men and 75% of women. In both genders, BF% increased with age, although in all age groups in men it was ≈10% lesser, as compared to women. In 25% of men, BF showed a range of variability not lesser from ≈27% to ≈31%, whereas in 25% of women not lesser from ≈38% to ≈41%.
 |
Figure 2 Cumulative distribution of BMI and BF%, stratified by age groups and gender. BMI, body mass index for: (A) total group by gender; (B) men by age; (C) women by age; BF%, body fat percentage for: (D) total group by gender; (E) men by age; (F) women by age. |
Age-gender-specific differences in the measures of fat cover under study (except for FM in the 40–44y and 45–49y age groups, and BMI in the 60–64y age group) were significant (Supplementary Table S1). Age-specific differences with no gender stratification depended on the specific variable under study (Supplementary Table S2). In men, significant differences in age groups were observed mainly for BF%, FMI, and FFM, in women (except for FFM) the differences in the variables under study were more manifest and represented two paradigms. The first one showed significant differences between all study groups (except for the 40–44y and 45–49y age groups), the second one confirmed significant differences between respective study groups (except for the 40–44y, 45–49y, and 50–54y age groups). BF% in men and women increased with age at the same annual rate of 0.6% (Figure 3, Supplementary Table S1). In the 60–64 age group, BF% in men was 27.9% ± 6.1%, and was significantly lower than in women (37.4% ± 5.8%). After adjusting FM for body height square, FMI values in both genders continued to show a trend that increased with age at a similar annual rate to the one observed for BF%. In both genders, changes in FFM with age showed different patterns. In men, FFM decreased at a rate of 0.4%/year, whereas in women the fat-free mass remained relatively stable. Different patterns of changes were also observed for BMI. In the case of men, no changes in BMI were reported with age, whereas in women it increased at an annual rate of 0.5%.
 |
Figure 3 Changes in BC by age in men (red line) and women (green line). (A) BF%, body fat percentage; (B) FM, fat mass; (C) FFM, fat-free mass; (D) BMI, body mass index; (E) FMI, fat mass index; (F) FFMI, fat-free mass index. |
All BF% and BMI correlations under study, stratified by age and gender were significantly higher than zero (Table 2). In both men and women, the strength of BF% and BMI correlations decreased with age. In men, significant differences between the correlation coefficients were observed only in the 45–49y - 60–64y, and 55–59y - 60–64y age groups. In women, age had a more significant impact on the differences between the variables under study. The correlation coefficient in women aged 40–44y differed significantly from the ones in other age groups. Significant differences were also observed between the 55–59y - 60–64y age groups.
 |
Table 2 Spearman Correlation of BF% and BMI by Age Group and Gender |
Table 3 presents the results of a regression model probing the association between BF% and BMI. All the predictors taken into account made a significant contribution into the actual modelling. Based on the coefficient of determination values, it was established that inclusion of gender, age, and BMI into the model actually accounted for 76% of the BF% variation.
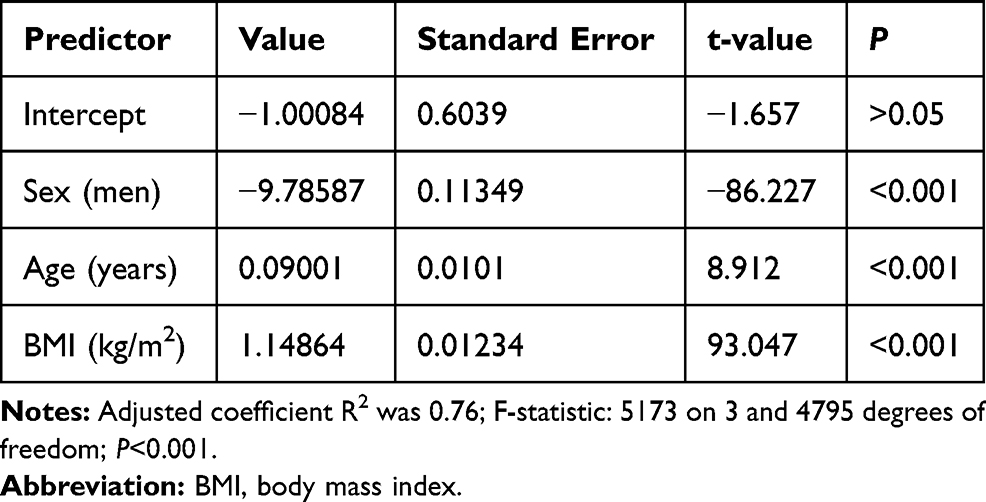 |
Table 3 Linear Regression Model Results |
Table 4 shows the means, standard deviations, and standard errors of the predictors under study, based on MCMC simulation. Taking into account age and BMI, men in comparison to women had their BF% lower by ≈10%, on average. Regardless of gender, an increase in age by 1 year was associated with a 0.09% rise in BF%.
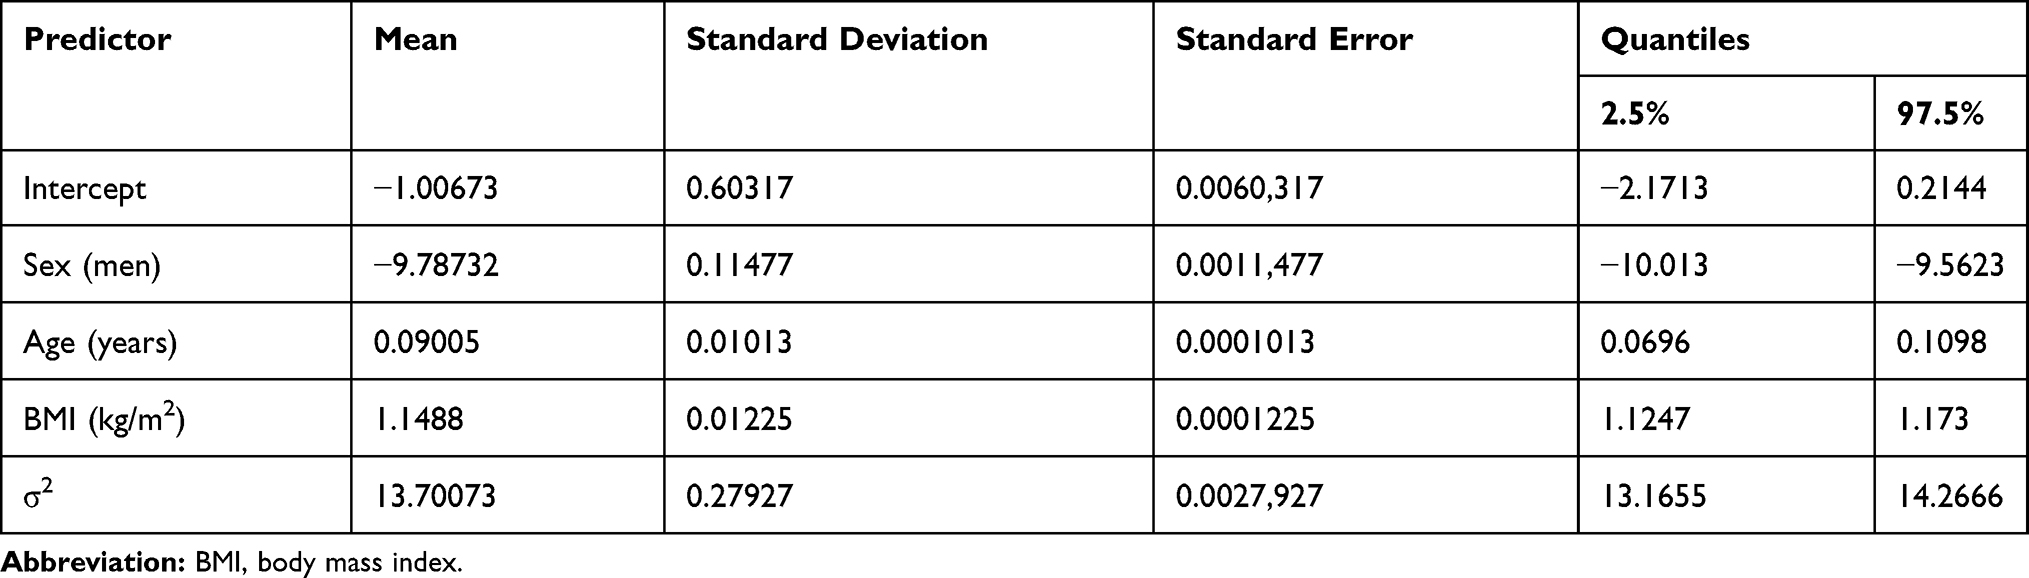 |
Table 4 Markov Chain Monte Carlo Simulation Results |
Based on Bayesian regression models, approximate gender-specific BF% cut-offs were estimated at five-year intervals (age range 40y - 65y) corresponding to BMI thresholds for normal weight, overweight, and obesity (Table 5). In both genders, regardless of the BMI cut-offs, BF% increase with age was predicted. Also, regardless of age and the adopted cut-off threshold for BMI, the predicted BF% cut-offs for men were ≈10% lower, as compared to women. In both genders, the highest BF% values were predicted in the age group of 65 years. For BMI=30kg/m2 they were 29.5% and 39.3% for men and women, respectively.
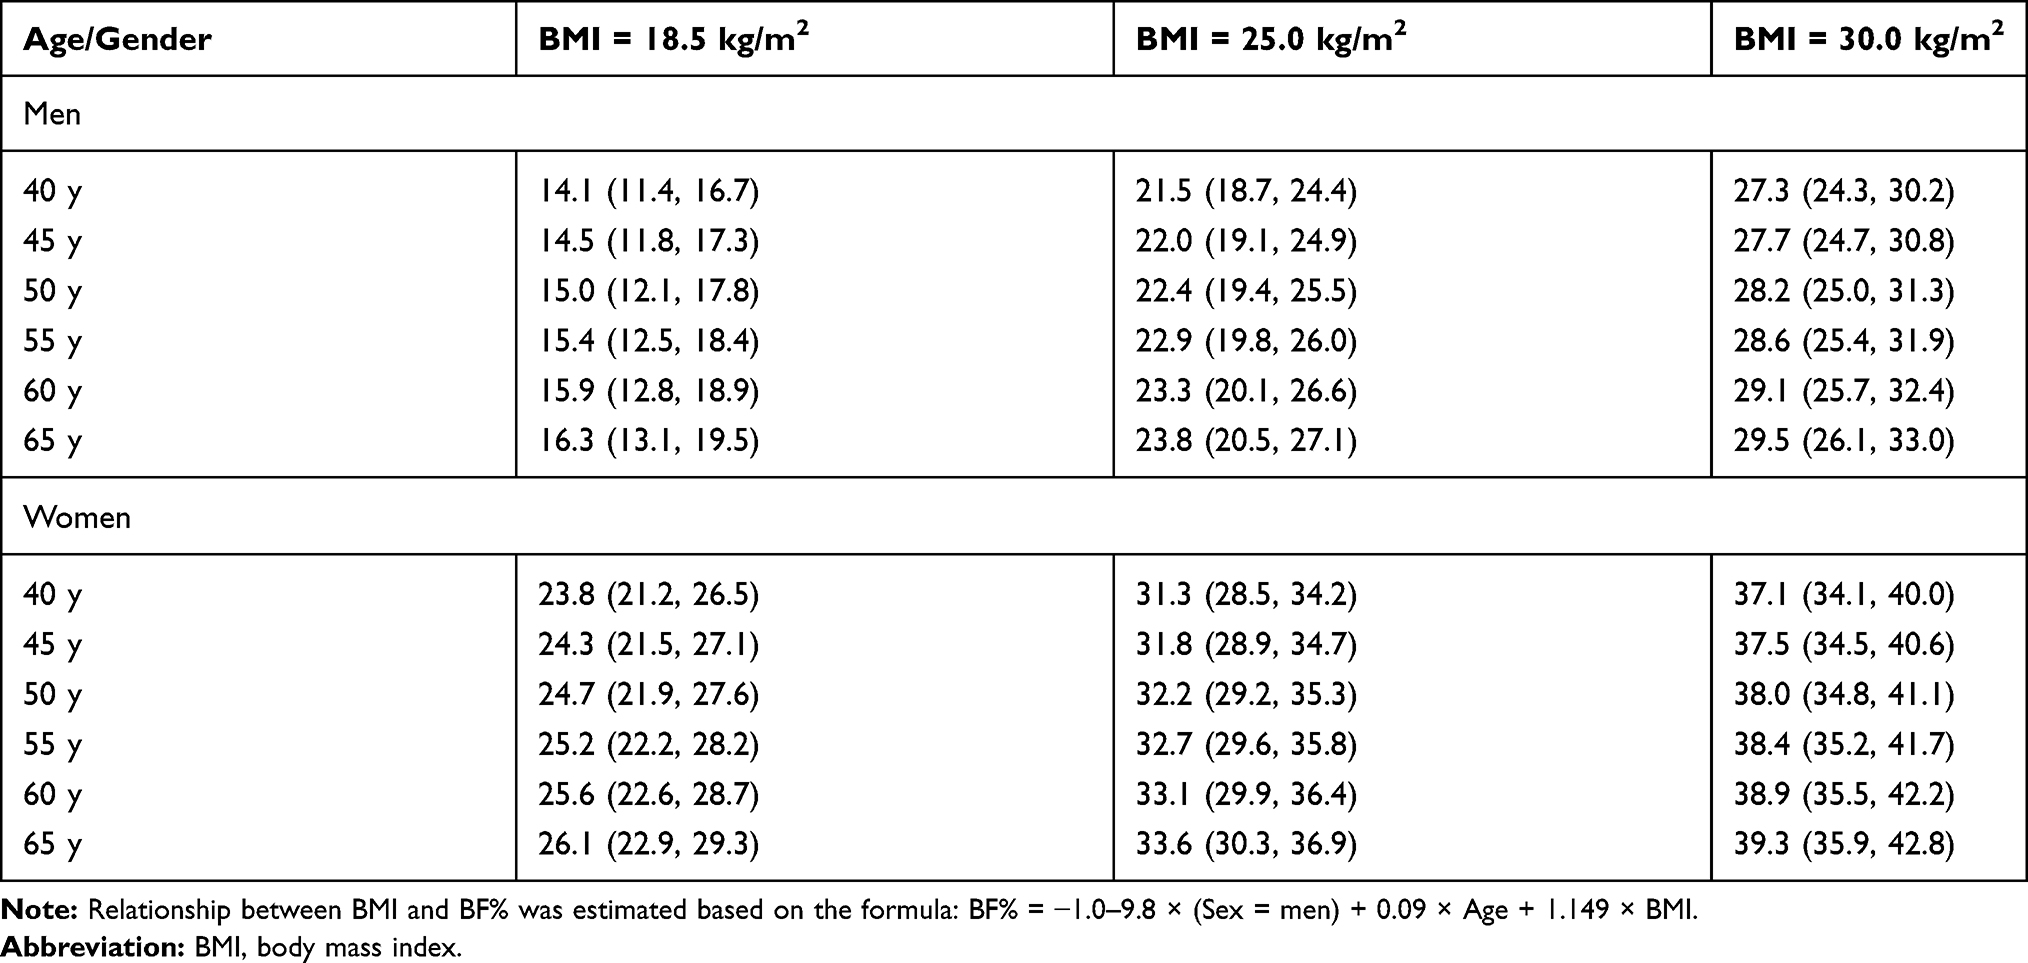 |
Table 5 Means and 95% Credible Intervals of Anticipated BF% Relative to BMI Cut-Offs, Stratified by Age and Gender |
The anticipated BF% values, as estimated through sensitivity analysis, did not differ significantly from those yielded in the main analysis (Supplementary Table S3). Regardless of gender, the differences in BF% estimates in the main analysis and sensitivity analysis showed a range of variability from −0.7% to 1.4%. The smallest differences were recorded for BMI=30.0 kg/m2 (range −0.7% to 0.1%), the largest ones for BMI=18.5 kg/m2 (range 0.5% to 1.4%).
Discussion
We investigated the effect of age on the changes in BC in the middle-aged and older adults. Although BF% in men was lower than in women, it increased with age in both genders at a similar annual rate. FFM decreased with age only in men, remaining relatively stable in women. In women, lack of changes in FFM and an increase in BF% in turn contributed to an increase in BMI. In men, BMI remained stable, most likely due to a specific change in body mass components consisting in gain in fat cover and simultaneous loss of muscle tissue. The relationship between BMI and BF% under study indicated gain in fat cover with age in both genders. Regardless of the BMI threshold, the predicted BF% values in men were ≈10% lower than in women, even though they increased with age in both genders.
As corroborated through a body of evidence yielded by large cross-sectional population studies, body weight and BMI increase during most of adult life, reaching the highest values in both genders in the sixth decade of life, and then gradually drop.35 Body weight reduction and BMI after reaching 60 years of age can be burdened by survival bias, resultant from premature mortality in obese individuals, both the young and the middle-aged ones.36 On the other hand, the results of longitudinal cohort studies indicate that body weight and BMI in older individuals are relatively stable, or subject to a slight reduction in the seventh decade of life.37 Changes in BF are dependent on the energy balance.38 An increase in energy intake, and mobility decreasing with age are the primary causes of BF accumulation.39 An onset of obesity exacerbates the deficits in muscle mass and strength as a secondary factor, impairs physical function, consequently leading to functional disability and reduced overall quality of life.40 Although obesity is widely acknowledged as appreciably instrumental in health loss, opinions regarding its treatment in older individuals remain discrepant. The underlying reason for the existing controversy is related to the potentially adverse effects of FFM loss in this population group.1 Relative weight loss due to individual dietary intake, in terms of its main components (FM and FFM), is irrespective of age in both genders, though.41,42
Age-induced changes in the BC, resultant from an unfavourable ratio of FFM to FM, affect the relationship between BMI and BF%.39 On the one hand, it is related to the loss of FFM, while on the other hand, to a decrease in body height as a result of degenerative changes within the vertebral bodies, and an increased physiological curvature of the spine.43 In the first case, the consequence of these changes is an underestimated BF%, whereas in the second one, its diagnostic overrating. Consequently, assessment of visceral fat in the elderly based on BMI alone may well be insufficient. Another essential argument highlighting a somewhat dubious value of BMI in assessing obesity consists in an altered pattern of fat distribution in older adults. Generally detrimental and health-threatening increase of visceral, intramuscular, and intrahepatic fat, in conjunction with a simultaneous reduction of FFM, may prompt the investigators to develop a much mistaken belief in a complete absence of any visceral fat deposits, or seem indicative of a low risk of such deposits, as in result of the above-referenced changes, the BMI values would not be subject to any significant alterations.44
The highlighted differences in male and female BCs are fully consistent with those reported by other authors.45 Boasting the same BMI values, men have higher FFM, whereas women have higher FM values, as compared to men. Even though men have more FFM than women, the muscle tissue loss observed in the process of involuntary changes is more frequently observed in men than in women.46 The results of the present study corroborate the age- and gender-specific BF% variation within the same BMI category. This in turn gives sufficient grounds to believe that BMI underrated the prevalence of obesity in women and older age groups, regardless of gender. These results are fully consistent with previous findings. According to Pasco et al,9 in order to improve FM estimates, pertinent BMI thresholds defining overweight and obesity should be made gender- and age-specific, taking into account physiological differences in male and female body structure, as well as the actual impact of age on BC. The results reported in the Ambrosi et al47 study indicate that making use in clinical practice of BMI only is bound to result in the actual underrating of both obesity and cardiometabolic risk associated with its incidence. The investigators postulate therefore to have the BC measurements incorporated into routine medical practice as a set of legitimate indicators. The rationale behind this recommendation is also grounded in the sex-specific FM distribution paradigms. The accumulation of FM in the trunk and abdomen area is more common in men, whereas in the hip and thigh area - in women.11 Physiological differences in men’s and women’s BC, accompanied by the resultant changes in BC during the ageing process stand for specific health implications. Even though obesity occurs in both men and women, the associated health risks seem to be different for each gender.48 Abdominal obesity characteristic of men is much closer related to cardiometabolic risk than buttock and thigh obesity characteristic of female gender.49
The findings of the present study should be construed in terms of strengths and weaknesses. The study was based on a large population sample, recruited in the way ensuring representativeness and external validity. Diverse statistical methods, as applied in the analyses, give extra credence to the results. Regretfully, a cross-sectional nature of the study made it unfeasible to draw any conclusions of causal character with regard to the relationship between BF% and BMI. The method recommended for assessing BC is dual energy X-ray absorptiometry, whereas in the present study, the second most frequently applied method based on measuring electrical bioimpedance was used. Relative scarcity of participants in the 40–44 years age range may well have ultimately accounted for some testing bias.
Conclusion
Age-induced changes in BC indicated an increase in body fat percentage in both genders, although to a greater extent in women, as well as a reduction in muscle mass, especially in men. BMI is not deemed an adequate indicator of obesity in older adults, as it fails to take into account the involutionary changes within the body mass components. Regular monitoring of BC in older adults therefore appears essential in terms of acknowledging appreciably better characteristics of short- and long-term health-loss predictors entailed. Diagnostic shortcomings of assessing obesity against BMI alone may well be mitigated by having it supplemented with regular monitoring of the key body mass components, ie fat and muscle tissue, therefore ensuring a comprehensive insight into the issue.
Data Sharing Statement
The Authors of the present study are permanently authorised to access the source data sets of the PONS study subjects, as some of those subjects also happen to have been embraced by the HEALTHY KIELCE (Zdrowe Kielce) Project, part of the PONS Project. Proprietary rights to those data sets are held by the Holycross Cancer Centre (HCC), and therefore the Authors, as the staff members of HCC, may freely access them at any time for research purposes, on a free-of-charge basis.
Otherwise, the above-referenced body of data is not publicly accessible, in full compliance with the European Union General Data Protection Regulation (EU GDPR) constraints, and other statutory restrictions in place in Poland. This notwithstanding, the Authors may make a certain part of those data sets available to academic researchers, following their prior conversion into an anonymized format, when approached with a reasonable request, care of the First Author.
Ethical Approval and Consent to Participate
The PONS study was approved by the Ethics Committee within the Cancer Centre, and by the Institute of Oncology in Warsaw, Poland. The present study was duly approved by a local Ethics Review Committee, Faculty of Health Sciences (Approval Ref. No. 25/2015), The Jan Kochanowski University (JKU) in Kielce, Poland. All study protocol procedures were carried out in accordance with the Helsinki Declaration, and a written informed consent was acquired from all study participants prior to the actual commencement of the study.
Acknowledgments
The authors are most grateful to all participants for their committed involvement in the study protocol, despite numerous inconveniences this may have caused them.
Author Contributions
All authors made substantial contributions to conception and design, acquisition of data, or analysis and interpretation of data; took part in drafting the article or revising it critically for important intellectual content; agreed to submit to the current journal; gave final approval of the version to be published; and agree to be accountable for all aspects of the work.
Funding
The research Project PONS – Polish-Norwegian Study (Ref. No PNRF-228- AI-1/07), named “Establishment of the infrastructure to facilitate studies on the health status of Poland’s population,” was financed out of the Polish-Norwegian Foundation Research Fund. The Project is supported under the programme established by the Minister of Science and Higher Education - “Regional Initiative of Excellence” - spanning the period 2019–2022; Project No 024/RID/2018/19; amount of financing allocated: PLN 11999 000.00.
Disclosure
The authors report no conflicts of interest in the present study.
References
1. Villareal DT, Apovian CM, Kushner RF, Klein S. Obesity in older adults: technical review and position statement of the american society for nutrition and NAASO, the obesity society. Obes Res. 2005;13(11):1849–1863. doi:10.1038/oby.2005.228
2. Ortega Loubon C, Fernández Molina M, Singh G, Correa R. Obesity and its cardiovascular effects. Diabetes Metab Res Rev. 2019;35(4):e3135. doi:10.1002/dmrr.3135
3. Nimptsch K, Konigorski S, Pischon T. Diagnosis of obesity and use of obesity biomarkers in science and clinical medicine. Metabolism. 2019;92:61–70. doi:10.1016/j.metabol.2018.12.006
4. Hawksworth G, Hales J, Martinez F, Hynes A, Hamilton A, Fernandez V. Pancreatic cancer trends in Europe: epidemiology and risk factors. Med Stud Med. 2019;35(2):164–171. doi:10.5114/ms.2019.86336
5. Macek P, Zak M, Terek-Derszniak M, et al. Age-dependent disparities in the prevalence of single and clustering cardiovascular risk factors: a cross-sectional cohort study in middle-aged and older adults. Clin Interv Aging. 2020;15:161–169. doi:10.2147/CIA.S238930
6. Krzysztoszek J, Laudańska-Krzemińska I, Bronikowski M. Assessment of epidemiological obesity among adults in EU countries. Ann Agric Environ Med. 2019;26(2):341–349. doi:10.26444/aaem/97226
7. Gutin I. In BMI we trust: reframing the body mass index as a measure of health. Soc Theory Health. 2018;16(3):256–271. doi:10.1057/s41285-017-0055-0
8. Rothman KJ. BMI-related errors in the measurement of obesity. Int J Obes. 2008;32(S3):S56–S59. doi:10.1038/ijo.2008.87
9. Pasco JA, Nicholson GC, Brennan SL, Kotowicz MA. Prevalence of obesity and the relationship between the body mass index and body fat: cross-sectional, population-based data. PLoS One. 2012;7(1):e29580. doi:10.1371/journal.pone.0029580
10. WHO Expert Consultation. Appropriate body-mass index for Asian populations and its implications for policy and intervention strategies. Lancet Oncol. 2004;363(9403):157–163. doi:10.1016/S0140-6736(03)15268-3.
11. Schorr M, Dichtel LE, Gerweck AV, et al. Sex differences in body composition and association with cardiometabolic risk. Biol Sex Differ. 2018;9(1). doi:10.1186/s13293-018-0189-3
12. Biskup M, Macek P, Król H, et al. The relationship between a sedentary lifestyle and human health in the light of the research of PONS-Healthy Kielce. Med Stud. 2018;34(1):25–40. doi:10.5114/ms.2018.74819
13. Winter JE, MacInnis RJ, Wattanapenpaiboon N, Nowson CA. BMI and all-cause mortality in older adults: a meta-analysis. Am J Clin Nutr. 2014;99(4):875–890. doi:10.3945/ajcn.113.068122
14. Vanavanan S, Srisawasdi P, Rochanawutanon M, Kumproa N, Kruthkul K, Kroll MH. Performance of body mass index and percentage of body fat in predicting cardiometabolic risk factors in Thai adults. Diabetes Metab Syndr Obes. 2018;11:241. doi:10.2147/DMSO.S167294
15. Ho-Pham LT, Lai TQ, Nguyen MTT, Nguyen TV. Relationship between body mass index and percent body fat in Vietnamese: implications for the diagnosis of obesity. PLoS One. 2015;10(5):e0127198. doi:10.1371/journal.pone.0127198
16. Lakerveld J, Mackenbach J. The upstream determinants of adult obesity. Obes Facts. 2017;10(3):216–222. doi:10.1159/000471489
17. Sahibdeen V, Crowther NJ, Soodyall H, et al. Genetic variants in SEC16B are associated with body composition in black South Africans. Nutr Diabetes. 2018;8(1). doi:10.1038/s41387-018-0050-0
18. Guo SS, Zeller C, Chumlea WC, Siervogel RM. Aging, body composition, and lifestyle: the fels longitudinal study. Am J Clin Nutr. 1999;70(3):405–411. doi:10.1093/ajcn/70.3.405
19. Tian S, Morio B, Denis J-B, Mioche L. Age-related changes in segmental body composition by ethnicity and history of weight change across the adult lifespan. Int J Environ Res Public Health. 2016;13(8):821. doi:10.3390/ijerph13080821
20. Ding J, Kritchevsky SB, Newman AB, et al. Effects of birth cohort and age on body composition in a sample of community-based elderly. Am J Clin Nutr. 2007;85(2):405–410. doi:10.1093/ajcn/85.2.405
21. Mioche L, Brigand A, Bidot C, Denis J-B. Fat-free mass predictions through a bayesian network enable body composition comparisons in various populations. J Nutr. 2011;141(8):1573–1580. doi:10.3945/jn.111.137935
22. Sepulveda PV, Bush ED, Baar K. Pharmacology of manipulating lean body mass. Clin Exp Pharmacol Physiol. 2015;42(1):1–13. doi:10.1111/1440-1681.12320
23. Henche SA, Torres RR, Pellico LG. An evaluation of patterns of change in total and regional body fat mass in healthy Spanish subjects using dual-energy X-ray absorptiometry (DXA). Eur J Clin Nutr. 2008;62(12):1440–1448. doi:10.1038/sj.ejcn.1602883
24. Yin Y-H, Liu JYW, Välimäki M. Effectiveness of non-pharmacological interventions on the management of sarcopenic obesity: a systematic review and meta-analysis. Exp Gerontol. 2020;135:110937. doi:10.1016/j.exger.2020.110937
25. Vincent HK, Raiser SN, Vincent KR. The aging musculoskeletal system and obesity-related considerations with exercise. Ageing Res Rev. 2012;11(3):361–373. doi:10.1016/j.arr.2012.03.002
26. Vincent HK, Mathews A. Obesity and mobility in advancing age: mechanisms and interventions to preserve independent mobility. Curr Obes Rep. 2013;2(3):275–283. doi:10.1007/s13679-013-0059-6
27. Grundy Scott M, Richard P, Philip G, Sidney S, Valentin F. Assessment of cardiovascular risk by use of multiple-risk-factor assessment equations. Circulation. 1999;100(13):1481–1492. doi:10.1161/01.CIR.100.13.1481
28. Wilson Peter WF, D’Agostino Ralph B, Daniel L, Belanger Albert M, Halit S, Kannel William B. Prediction of coronary heart disease using risk factor categories. Circulation. 1998;97(18):1837–1847. doi:10.1161/01.CIR.97.18.1837
29. Gallagher D, Chung S, Akram M. Body composition. In: Encyclopedia of Human Nutrition. Elsevier; 2013:191–199. doi:10.1016/B978-0-12-375083-9.00027-1
30. Delisle Nyström C, Henriksson P, Alexandrou C, Löf M. The tanita SC-240 to assess body composition in pre-school children: an evaluation against the three component model. Nutrients. 2016;8(6):371. doi:10.3390/nu8060371
31. Organization WH. Obesity: Preventing and Managing the Global Epidemic. World Health Organization; 2000.
32. Jensen B, Braun W, Geisler C, et al. Limitations of fat-free mass for the assessment of muscle mass in obesity. Obes Facts. 2019;12(3):307–315. doi:10.1159/000499607
33. Benn RT. Some mathematical properties of weight-for-height indices used as measures of adiposity. J Epidemiol Community Health. 1971;25(1):42–50. doi:10.1136/jech.25.1.42
34. Heymsfield SB, Gallagher D, Mayer L, Beetsch J, Pietrobelli A. Scaling of human body composition to stature: new insights into body mass index. Am J Clin Nutr. 2007;86(1):82–91. doi:10.1093/ajcn/86.1.82
35. Flegal KM, Carroll MD, Kit BK, Ogden CL. Prevalence of obesity and trends in the distribution of body mass index among US adults, 1999–2010. JAMA. 2012;307(5):491–497. doi:10.1001/jama.2012.39
36. Mehta NK, Chang VW. Mortality attributable to obesity among middle-aged adults in the United States. Demography. 2009;46(4):851–872. doi:10.1353/dem.0.0077
37. Grinker JA, Tucker K, Vokonas PS, Rush D. Body habitus changes among adult males from the normative aging study: relations to aging, smoking history and alcohol intake. Obes Res. 1995;3(5):435–446. doi:10.1002/j.1550-8528.1995.tb00173.x
38. Hall KD, Heymsfield SB, Kemnitz JW, Klein S, Schoeller DA, Speakman JR. Energy balance and its components: implications for body weight regulation123. Am J Clin Nutr. 2012;95(4):989–994. doi:10.3945/ajcn.112.036350
39. Kyle UG, Morabia A, Schutz Y, Pichard C. Sedentarism affects body fat mass index and fat-free mass index in adults aged 18 to 98 years. Nutrition. 2004;20(3):255–260. doi:10.1016/j.nut.2003.11.019
40. Kalyani RR, Corriere M, Ferrucci L. Age-related and disease-related muscle loss: the effect of diabetes, obesity, and other diseases. Lancet Diabetes Endocrinol. 2014;2(10):819–829. doi:10.1016/S2213-8587(14)70034-8
41. Ramage S, Farmer A, Eccles KA, McCargar L. Healthy strategies for successful weight loss and weight maintenance: a systematic review. Appl Physiol Nutr Metab. 2014;39(1):1–20. doi:10.1139/apnm-2013-0026
42. Macek P, Terek-Derszniak M, Biskup M, et al. A two-year follow-up cohort study—improved clinical control over CVD risk factors through weight loss in middle-aged and older adults. J Clin Med. 2020;9(9):2904. doi:10.3390/jcm9092904
43. Bartynski WS, Heller MT, Grahovac SZ, Rothfus WE, Kurs-Lasky M. Severe thoracic kyphosis in the older patient in the absence of vertebral fracture: association of extreme curve with age. Am J Neuroradiol. 2005;26(8):2077–2085.:.
44. Cree MG, Newcomer BR, Katsanos CS, et al. Intramuscular and liver triglycerides are increased in the elderly. J Clin Endocrinol Metab. 2004;89(8):3864–3871. doi:10.1210/jc.2003-031986
45. Bredella MA. Sex differences in body composition. In Mauvais-Jarvis F editor, Sex and Gender Factors Affecting Metabolic Homeostasis, Diabetes and Obesity. Vol. 1043. Springer International Publishing; 2017:9–27. doi:10.1007/978-3-319-70178-3_2
46. Gallagher D, Visser M, De Meersman RE, et al. Appendicular skeletal muscle mass: effects of age, gender, and ethnicity. J Appl Physiol. 1997;83(1):229–239. doi:10.1152/jappl.1997.83.1.229
47. Gómez-Ambrosi J, Silva C, Catalán V, et al. Clinical usefulness of a new equation for estimating body fat. Diabetes Care. 2012;35(2):383–388. doi:10.2337/dc11-1334
48. Power ML, Schulkin J. Sex differences in fat storage, fat metabolism, and the health risks from obesity: possible evolutionary origins. Br J Nutr. 2008;99(5):931–940. doi:10.1017/S0007114507853347
49. Ross R, Neeland IJ, Yamashita S, et al. Waist circumference as a vital sign in clinical practice: a consensus statement from the IAS and ICCR working group on visceral obesity. Nat Rev Endocrinol. 2020;16(3):177–189. doi:10.1038/s41574-019-0310-7
 © 2020 The Author(s). This work is published and licensed by Dove Medical Press Limited. The full terms of this license are available at https://www.dovepress.com/terms.php and incorporate the Creative Commons Attribution - Non Commercial (unported, v3.0) License.
By accessing the work you hereby accept the Terms. Non-commercial uses of the work are permitted without any further permission from Dove Medical Press Limited, provided the work is properly attributed. For permission for commercial use of this work, please see paragraphs 4.2 and 5 of our Terms.
© 2020 The Author(s). This work is published and licensed by Dove Medical Press Limited. The full terms of this license are available at https://www.dovepress.com/terms.php and incorporate the Creative Commons Attribution - Non Commercial (unported, v3.0) License.
By accessing the work you hereby accept the Terms. Non-commercial uses of the work are permitted without any further permission from Dove Medical Press Limited, provided the work is properly attributed. For permission for commercial use of this work, please see paragraphs 4.2 and 5 of our Terms.