")
Back to Journals » Infection and Drug Resistance » Volume 14
Characterization of E. coli Phylogroups Causing Catheter-Associated Urinary Tract Infection
Authors El-Mahdy R , Mahmoud R, Shrief R
Received 21 June 2021
Accepted for publication 28 July 2021
Published 16 August 2021 Volume 2021:14 Pages 3183—3193
DOI https://doi.org/10.2147/IDR.S325770
Checked for plagiarism Yes
Review by Single anonymous peer review
Peer reviewer comments 2
Editor who approved publication: Professor Suresh Antony
Rasha El-Mahdy,1 Rasha Mahmoud,2 Raghdaa Shrief3
1Medical Microbiology and Immunology Department, Faculty of Medicine, Mansoura University, Mansoura, Egypt; 2Internal Medicine Department, Nephrology and Dialysis Unit, Mansoura University, Mansoura, Egypt; 3Medical Microbiology and Immunology Department, Faculty of Medicine, Damietta University, Damietta, Egypt
Correspondence: Rasha El-Mahdy
Medical Microbiology and Immunology, Faculty of Medicine, Mansoura University, Mansoura, 35516, Egypt
Tel +20 10 0532 9819
Email [email protected]
Purpose: Characterization of different uropathogenic E. coli (UPEC) phylogroups is crucial to understand pathogenesis of urinary tract infection (UTI). The objective of our study was to evaluate the antibiotic resistance pattern, biofilm formation and pathogenicity islands (PAIs) of UPEC phylogroups isolated from catheter-associated UTI (CAUTI) compared to community UTI (Com-UTI).
Patients and Methods: This study included 90 UPEC strains recovered from CAUTI and Com-UTI. Antimicrobial susceptibility was tested by the Kirby–Bauer method and extended spectrum beta-lactamase (ESBL) production was confirmed using the combined disk. The biofilm formation was tested using the microtiter plate assay. Main E. coli phylogroups (A, B1, B2 and D) were detected by multiplex PCR and 2 multiplex PCR detected the 8 PAIs.
Results: Antibiotic resistance of UPEC strains showed a similar high resistance in CAUTI and Com-UTI. Isolates from CAUTI significantly produced biofilm higher than Com-UTI strains (68.9% vs 44.4%). In CAUTI and Com-UTI isolates, phylogroup A was the commonest (53.3% vs 48.9%, respectively). PAI IV536 was the most common in the strains from CAUTI (71.1%) and Com-UTI (73.3%). No significant relationship was detected between the studied characters and different phylogroups except the significant resistance to cefotaxime, ceftazidime and aztreonam among phylogroups from CAUTI isolates.
Conclusion: Increased antibiotic resistance and ESBLs were detected in UPEC strains from CAUTI and Com-UTI. The strains from CAUTI significantly produced biofilm higher than Com-UTI strains. Phylogroup A was the predominate phylogroup and PAI IV536 was the most prevalent marker in all phylogroups from both types of UTI.
Keywords: Escherichia coli, pathogenicity island, CAUTI
Introduction
Urinary tract infection (UTI) is one of the major causes of infections worldwide1 and is a leading cause of health-care associated infections which is commonly associated with the use of urinary catheters leading to high morbidity and mortality.2 Uropathogenic Escherichia coli (UPEC) is responsible for about half of the health-care associated urinary tract infections. Numerous virulence factors are possessed by UPEC and involved in developing the UTI such as adhesins, toxins, siderophores, lipopolysaccharide and capsules which facilitate the colonization, invasion and infection of the urinary tract.3,4
The virulence factors of UPEC are encoded on pathogenicity islands (PAIs) which are large size chromosomal DNA segments with a unique guanine and cytosine content. These pathogenicity islands are mobile genetic elements and can horizontally transfer the virulence genes so they have an important role in the evolution of the bacteria.5–7
Several virulence factors of UPEC strains are encoded on different PAIs including PAI I536, PAI II536, PAI III536, PAI IV536, PAI ICFT073, PAI IICFT073, PAI IJ96 and PAI IIJ96. These virulence determinants are needed to overcome the host immunity and include α-hemolysin which helps host’s invasion, adhesins that attach UPEC to the epithelium of the urinary tract as P-fimbrial adhesins and S-fimbrial adhesins, the cytotoxic necrotizing factor which assists dissemination and persistence of infection in the urinary tract and the iron acquisition systems (aerobactin and yersiniabactin).8–10
Escherichia coli (E. coli) is classified into four main phylogroups A, B1, B2, and D where each group has characteristic features allow it to induce the infection. This phylogenetic typing has initially depended on the characterization of three genetic markers chuA, yjaA genes and a DNA fragment TspE4.C211 then has been refined to improve its specificity via targeting an extra gene target, arpA, resulting in detection of eight E. coli phylogroups; A, B1, B2, C, D, E, F and clade I.12
Few data are available about the relationship between phylogroups, PAIs, biofilm formation and antibiotic resistance pattern of UPEC causing catheter-associated UTI (CAUTI). The objective of our study was to evaluate the antibiotic resistance pattern, biofilm formation and PAIs of UPEC phylogroups isolated from CAUTI and UTI without an indwelling catheter (community acquired urinary tract infection (Com-UTI)).
Patients and Methods
This study included 45 UPEC strains isolated from urine of adult patients with CAUTI and 45 UPEC strains isolated from urine of adult patients with Com-UTI (UTI without an indwelling catheter). The patients with CAUTI and Com-UTI were 25 male/20 female and 27 female/18 male, respectively with mean age ±SD; 53.7 ±12.06 and 38.29 ±13.64 for CAUTI and Com-UTI patients, respectively.
The CAUTI is an infection in a patient with a urinary catheter meeting the National Healthcare Safety Network definition of UTI.13 The Com-UTI is the urinary tract infection that occurs in the community or within <48 hours of hospital admission and is not incubated at the time of hospital admission.14
Urine samples were collected from adult patients admitted to the Intensive Care Units (ICU), Mansoura University Hospital, Egypt from July 2020 till December 2020. Each patient was subjected to complete history taking and clinical examination to diagnose the UTI.
The study was approved by Mansoura Faculty of Medicine ethical committee (R21.4.1305) and a signed informed consent was obtained from each patient. This study was conducted in accordance with the Declaration of Helsinki.
Isolation and Identification of the UPEC
The morning midstream urine and urine from the urinary catheter were collected from patients under complete aseptic conditions and cultured on blood and MacConkey agars (Oxoid Ltd., England) to detect different E. coli strains.15 The isolated UPEC was confirmed by Gram staining and the standard biochemical tests and only one isolate from each patient was investigated.16 The UTI was confirmed by isolation of >105 colony-forming units (CFU) UPEC/mL midstream urine and ≥103 CFU UPEC/mL catheterized urine.17
Antimicrobial Susceptibility Pattern
Antimicrobial susceptibility testing of the isolated UPEC was performed by Kirby–Bauer disk diffusion method. The following antimicrobial agents were used: gentamicin, amikacin, piperacillin-tazobactam, meropenem, cefuroxime, cefotaxime, ceftazidime, cefepime, ciprofloxacin, trimethoprim-sulfamethoxazole, aztreonam, ampicillin, amoxicillin-clavulanate, nitrofurantoin, norfloxacin and tetracycline (Oxoid Ltd.). E. coli ATCC 25922 was used as a quality control strain.18 The isolates were considered as multidrug resistant (MDR) if they were non-susceptible to ≥1 agent in ≥3 different antibiotic groups.19
To screen the extended-spectrum beta-lactamase (ESBL) production, the isolated UPEC strains were tested against cefotaxime (30 µg) and ceftazidime (30 µg) by the disk diffusion method. Strains showing zone of inhibition ≤22mm for ceftazidime and ≤27mm for cefotaxime were selected for conformational tests of ESBL. The ESBL-producing UPEC isolates were confirmed by the combined disk method using the cefotaxime-clavulanic acid (30/10µg) and ceftazidime-clavulanic acid (30/10μg) disks. An increase of ≥5 mm in the diameter of the inhibition zones around disks containing clavulanic acid as compared to the inhibition zones around disks free of clavulanic acid indicated ESBL producing strains.18
Biofilm Formation
Biofilm formation by UPEC strains was tested using the microtiter plate assay as previously described. Briefly, each well of a 96-well flat-bottom polystyrene plate was inoculated with 200μL of a standardized E. coli suspension in tryptic soy broth, incubated at 37°C for 24 h, washed and stained with crystal violet, and then the optical density was measured at 492 nm.20
DNA Extraction from UPEC Strains
DNA was extracted from the isolated UPEC using the Gene JET genomic DNA purification kit (Thermo Fisher Scientific, Waltham, MA, USA) according to manufacturer’s instructions; then, DNA was stored at −20°C until used.
Phylogenetic Analysis
The main E. coli phylogroups (A, B1, B2 and D) were detected by multiplex PCR using primers (Table 1) that amplified the genes chuA and yjaA and the DNA fragment TspE4.C2 and then the interpretation of the results was performed as detailed by Clermont et al.11,12
 |
Table 1 Sequences of the Primers and the Size of Amplicon in Base Pair (Bp) Used in Multiplex PCR for Detection of UPEC Strains Phylogroups and PAIs |
Detection of PAIs by Multiplex PCR
Two multiplex PCRs (A and B) were performed to detect eight PAIs in the isolated UPEC (Table 1). The multiplex PCR A was performed to detect three PAI markers, PAI III536, PAI IV536 and PAI IICFT073, resulting in 200, 300 and 400 base pair fragments, respectively. The multiplex PCR B was performed to detect five PAI markers, PAI IJ96, PAI ICFT073, PAI II536, PAI I536 and PAI IIJ96 resulting in 400, 930, 1000, 1800 and 2300 base pair fragments, respectively.21
Statistical Analysis
Data were statistically analyzed using the Statistical Package for Social Sciences (SPSS) version 1 6 (SPSS Inc, Chicago, IL, USA). Qualitative data were expressed as numbers and percentages. Quantitative data were presented as mean and standard deviation. The Chi-square test or Fisher’s exact test was used for comparison between groups, as appropriate. Results with p < 0.05 were considered significant.
Results
The present study was conducted on UPEC strains isolated from urine of 45 adult patients admitted to ICU at Mansoura University Hospital with CAUTI and 45 adult patients with Com-UTI over 6 months from July to December 2020. The patients with CAUTI were 25 male (55.6%) and 20 female (44.4%), while in Com-UTI, the UPEC strains were isolated from urine of 27 female (60%) and 18 male (40%). No significant association was detected between the age of patients and either types of UTI.
Antimicrobial Susceptibility Pattern and Biofilm Formation of UPEC Strains
Antibiotic susceptibility testing using Kirby–Bauer disk diffusion method revealed that UPEC strains isolated from CAUTI had a high resistance to ampicillin, amoxicillin-clavulanate, cefuroxime, tetracycline, ciprofloxacin, norfloxacin, trimethoprim-sulfamethoxazole, ceftazidime and aztreonam; 100%, 86.7%, 86.7%, 75.6%, 71.1%, 71.1%, 66.7%, 55.6% and 53.3%, respectively. Similarly, the strains isolated from urine of Com-UTI displayed increased resistance to ampicillin, cefuroxime, tetracycline, amoxicillin-clavulanate, ciprofloxacin, trimethoprim-sulfamethoxazole, norfloxacin, ceftazidime and aztreonam; 100%, 84.4%, 75.6%, 73.3%, 66.7%, 62.2%, 60%, 46.7% and 46.7%, respectively. Both isolates recovered from CAUTI and Com-UTI displayed a low resistance to amikacin, meropenem and gentamicin; 4.4%, 6.7% and 26.7% in CAUTI and 2.2%, 4.4% and 20% in Com-UTI, respectively. There was no significant difference between resistance pattern of UPEC isolated from CAUTI and Com-UTI (P > 0.05, Table 2).
 |
Table 2 Comparison of the Phylogenetic Groups, PAIs, Antibiotic Resistance Pattern and Biofilm Formation of UPEC Isolated from CAUTI and Com-UTI |
The combined disk method confirmed that 22 strains isolated from CAUTI produced ESBLs in comparison to 15 isolates from Com-UTI (48.9% vs 33.3%, P = 0.13, Table 2). Thirty-six UPEC strains isolated from CAUTI were MDR compared to 32 UPEC strains isolated from Com-UTI (80% vs 71.1%, P = 0.32, Table 2).
The biofilm assay using the microtiter plate method revealed that UPEC strains isolated from CAUTI significantly produced biofilm more than the strains isolated from Com-UTI (68.9% vs 44.4%, P = 0.01, Table 2).
Phylogenetic Analysis
Phylogenetic analysis of UPEC isolates using multiplex PCR (Figure 1) revealed that in CAUTI, the most prevalent phylogroup was A followed by B2, D and B1; 53.3%, 24.4% then 11.1% and 11.1%, respectively. In Com-UTI, phylogroup A was the common UPEC type (48.9%) followed by phylogroups B2, D and B1; 31.1%, 13.3% and 6.7%, respectively. No statistical differences were observed in the distribution of different phylogroups between CAUTI and Com-UTI (P = 0.40, Table 2).
 |
Figure 1 Detection of UPEC phylogroups using multiplex PCR11 targeting the genes chuA (279bp) and yjaA (211bp) and the DNA fragment TspE4.C2 (154bp). Lane M: 100 bp DNA Ladder. Lane 1: Distilled water as negative control, Lane 2: phylogroup A, Lane 3: phylogroup B1, Lane 4,5: phylogroup A, Lane 6: phylogroup B1, Lane 7: phylogroup B2, Lane 8: phylogroup A, Lane 9: phylogroup A, Lane 10: phylogroup D, Lane 11: phylogroup A, Lane 12: phylogroup B2 and Lane 13: phylogroup A. |
Detection of PAIs
Detection of PAIs was performed using 2 Multiplex PCR (A and B) (Figures 2 and 3) and revealed 5 out of 8 PAIs; PAI III536, PAI IV536, PAI ICFT073, PAI IICFT073 and PAI IJ96. No one of the tested PAI was detected in 5 (11.1%) UPEC isolates from CAUTI and 6 (13.3%) UPEC strains from Com-UTI. One PAI was detected in 22 (48.9%) UPEC isolates from CAUTI and 23 (51.1%) UPEC isolates from Com-UTI. Two PAIs were recovered in 14 (31.1%) and 15 (33.3%) UPEC isolates from CAUTI and Com-UTI, respectively. Three PAIs were revealed in 4 (8.9%) UPEC isolates from CAUTI and one (2.2%) UPEC isolate from Com-UTI. No statistical differences were observed in the number of different PAIs in UPEC between CAUTI and Com-UTI (P > 0.05, Table 2).
 |
Figure 2 Detection of UPEC PAIs using multiplex PCR A to detect PAI III536 (200 bp), PAI IV536 (300 bp) and PAI IICFT073 (400 bp). Lane M: 100 pb DNA ladder. Lane 1: UPEC strains with PAI IICFT073, Lane 2: UPEC strains with no PAI, Lane 3: UPEC strains with PAI IV536 and PAI IICFT073, Lane 4: UPEC strains with no PAI and Lane 5: UPEC strains with PAI IV536. |
 |
Figure 3 (A and B) Detection of UPEC PAIs using multiplex PCR B to detect 5 PAIs; PAI IJ96 (400 bp), PAI ICFT073 (930 bp), PAI II536 (1000 bp), PAI I536 (1800 bp) and PAI IIJ96 (2300 bp). (A); Lane M: 100 pb DNA ladder. Lanes 1–5: UPEC strains with PAI ICFT073. (B); Lane M: 100 pb DNA ladder. Lanes 1–6,8: UPEC strains with no PAI and Lanes 7,9 UPEC strains with PAI IJ96. |
In UPEC strains isolated from CAUTI, PAI IV536 was the most prevalent marker (71.1%) followed by PAI IICFT073, PAI IJ96, PAI ICFT073 and PAI III536 (46.7%, 8.9%, 6.7% and 4.4%, respectively). Likewise, UPEC stains recovered from Com-UTI showed a high prevalence of PAI IV536 (73.3%) followed by PAI IICFT073, PAI IJ96 and PAI ICFT073 (42.2%, 4.4% and 4.4%, respectively). No statistical differences were detected between PAIs isolated from UPEC strains from CAUTI and Com-UTI (P > 0.05, Table 2).
Relationship Between the Phylogroups, Antibiotic Resistance Pattern and Biofilm Formation
In CAUTI, no statistical differences were detected in the antibiotic resistance among different UPEC phylogroups apart from the resistance to cefotaxime, ceftazidime and aztreonam where phylogenetic D had significantly high resistance in comparison to other phylogenetics (P = 0.0001, 0.0001 and 0.033, respectively, Table 3). On the other hand, in Com-UTI, no significant relationship was observed between the antibiotic resistance and different UPEC phylogroups (P > 0.05, Table 3).
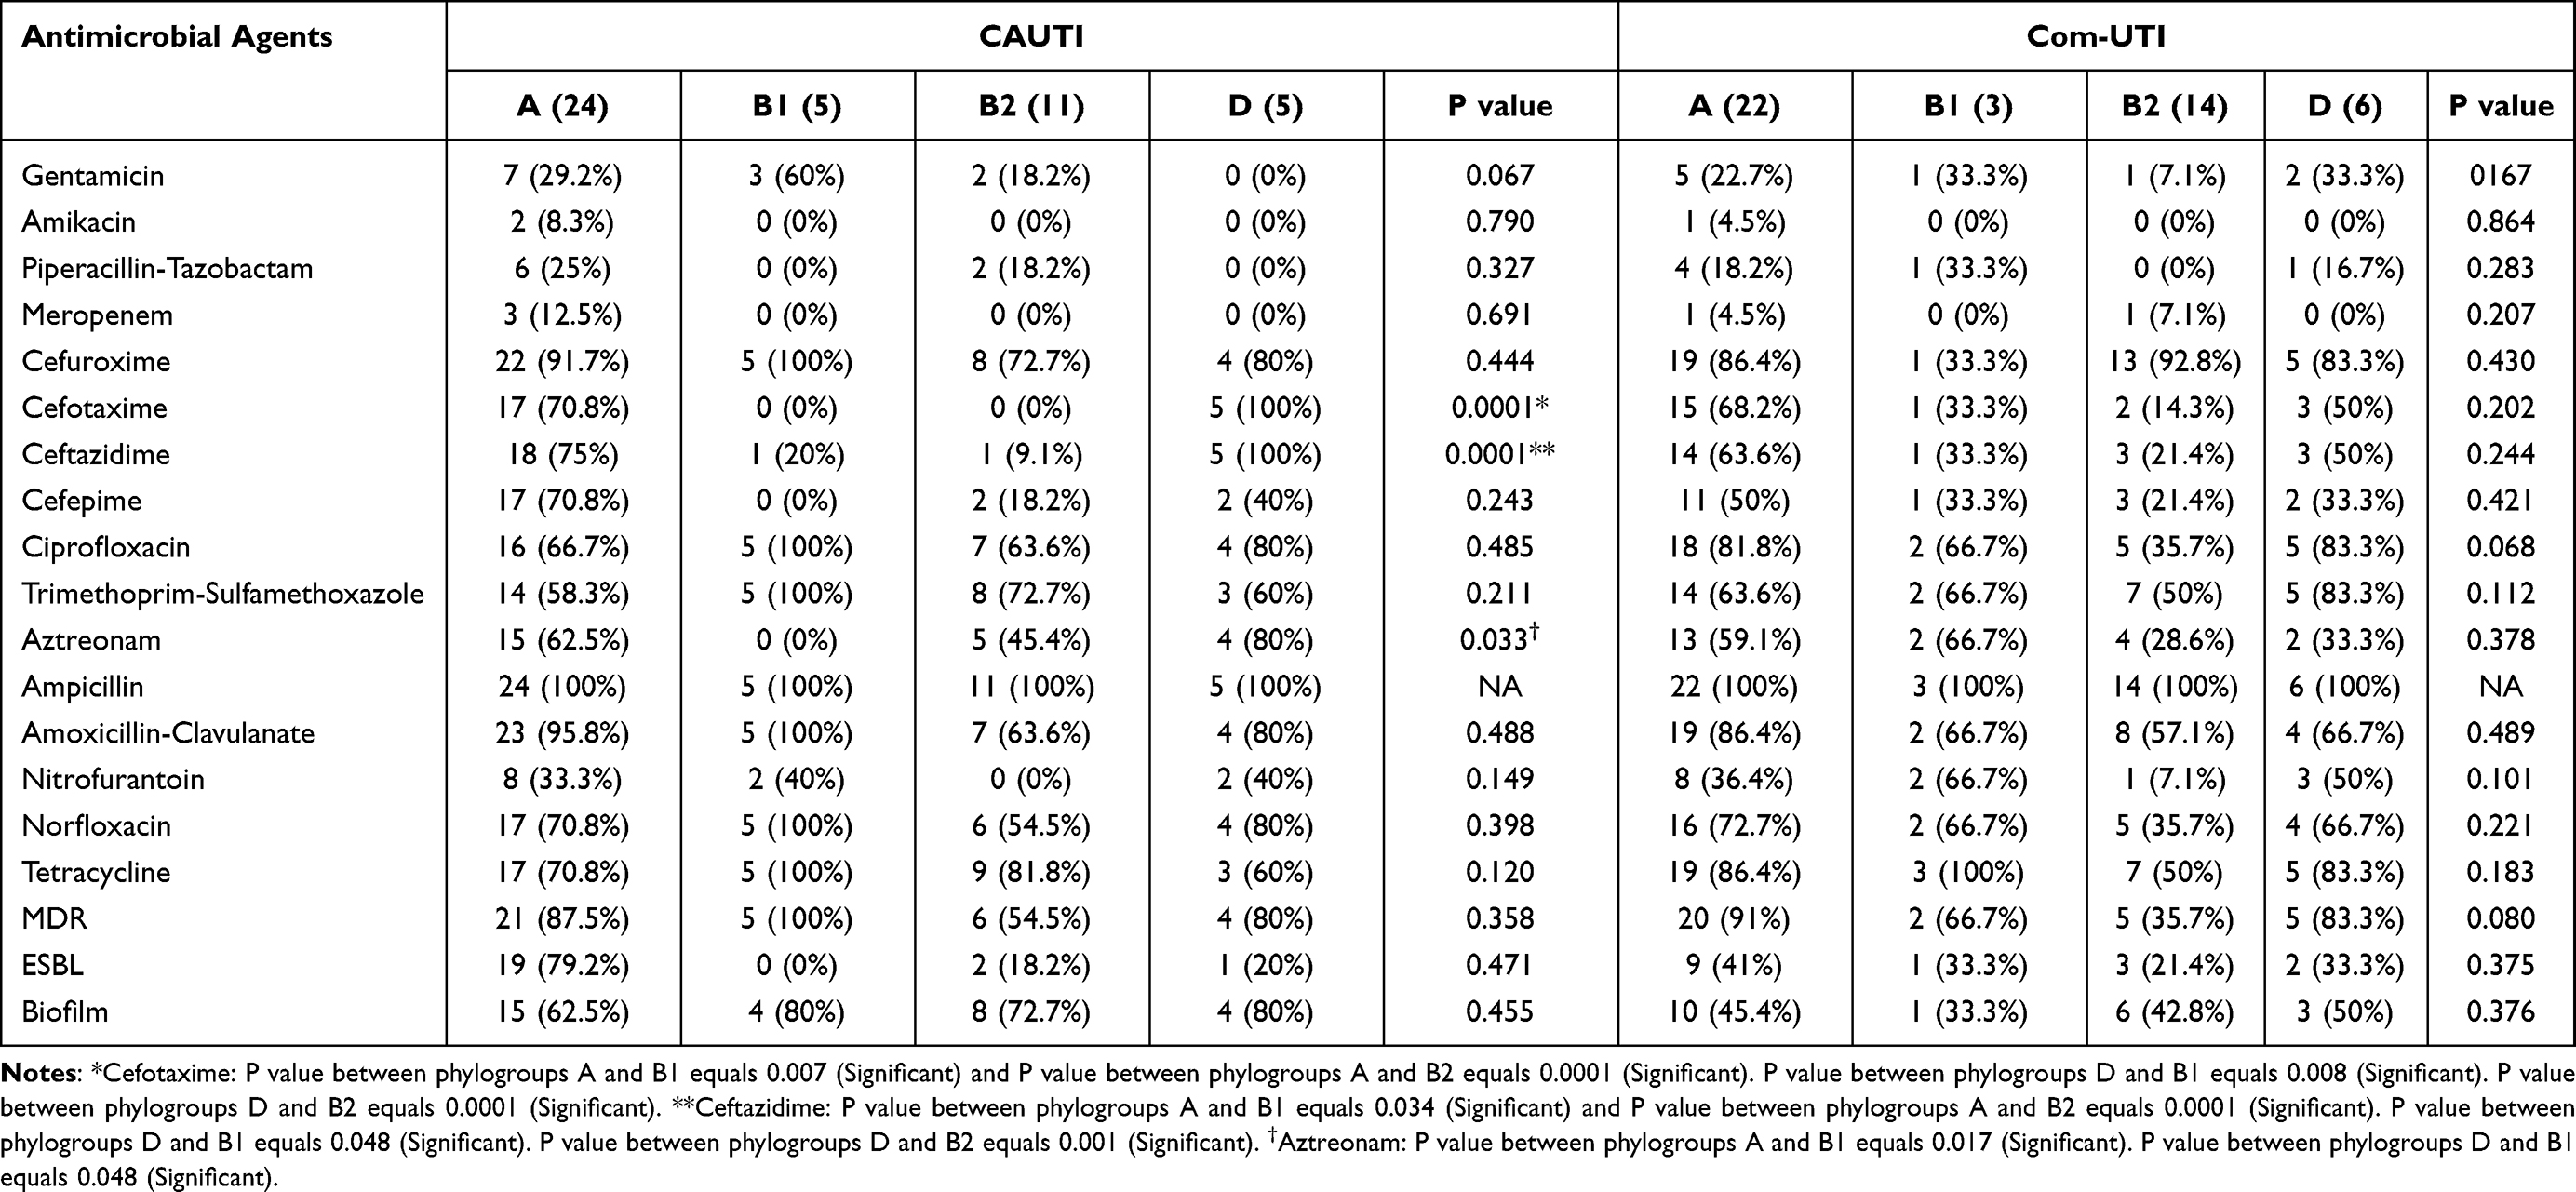 |
Table 3 Antibiotic Resistance Pattern and Biofilm Formation of Different UPEC Phylogroups Isolated from CAUTI and Com-UTI |
The ESBL production was higher in phylogroup A UPEC from CAUTI (79.2%) and Com-UTI (41%), yet not significant (P = 0.471 and 0.375, respectively, Table 3). No significant association was detected between different phylogenetic groups and MDR in both types of urinary tract infections (P > 0.05, Table 3). The phylogroup D had more biofilm producers in CAUTI (80%) and Com-UTI (50%); however, this was not significant (P > 0.05, Table 3).
Relationship Between the Phylogroups and PAIs
In CAUTI, all isolates of phylogroups B1 and B2 carried PAIs, while only 83.3% and 80% of phylogroups A and D had PAIs. In all phylogroups, PAI IV536 was the most prevalent marker in 100%, 91%, 62.5% and 40% of isolates in groups B1, B2, A and D, respectively (Table 4). A different pattern was observed in Com-UTI UPEC, where 100%, 86.4%, 85.7% and 83.3% of phylogroups B1, A, B2 and D strains, respectively had PAIs predominantly PAI IV536; 66.7%, 81.8%, 64.3% and 66.7%, respectively (Table 4).
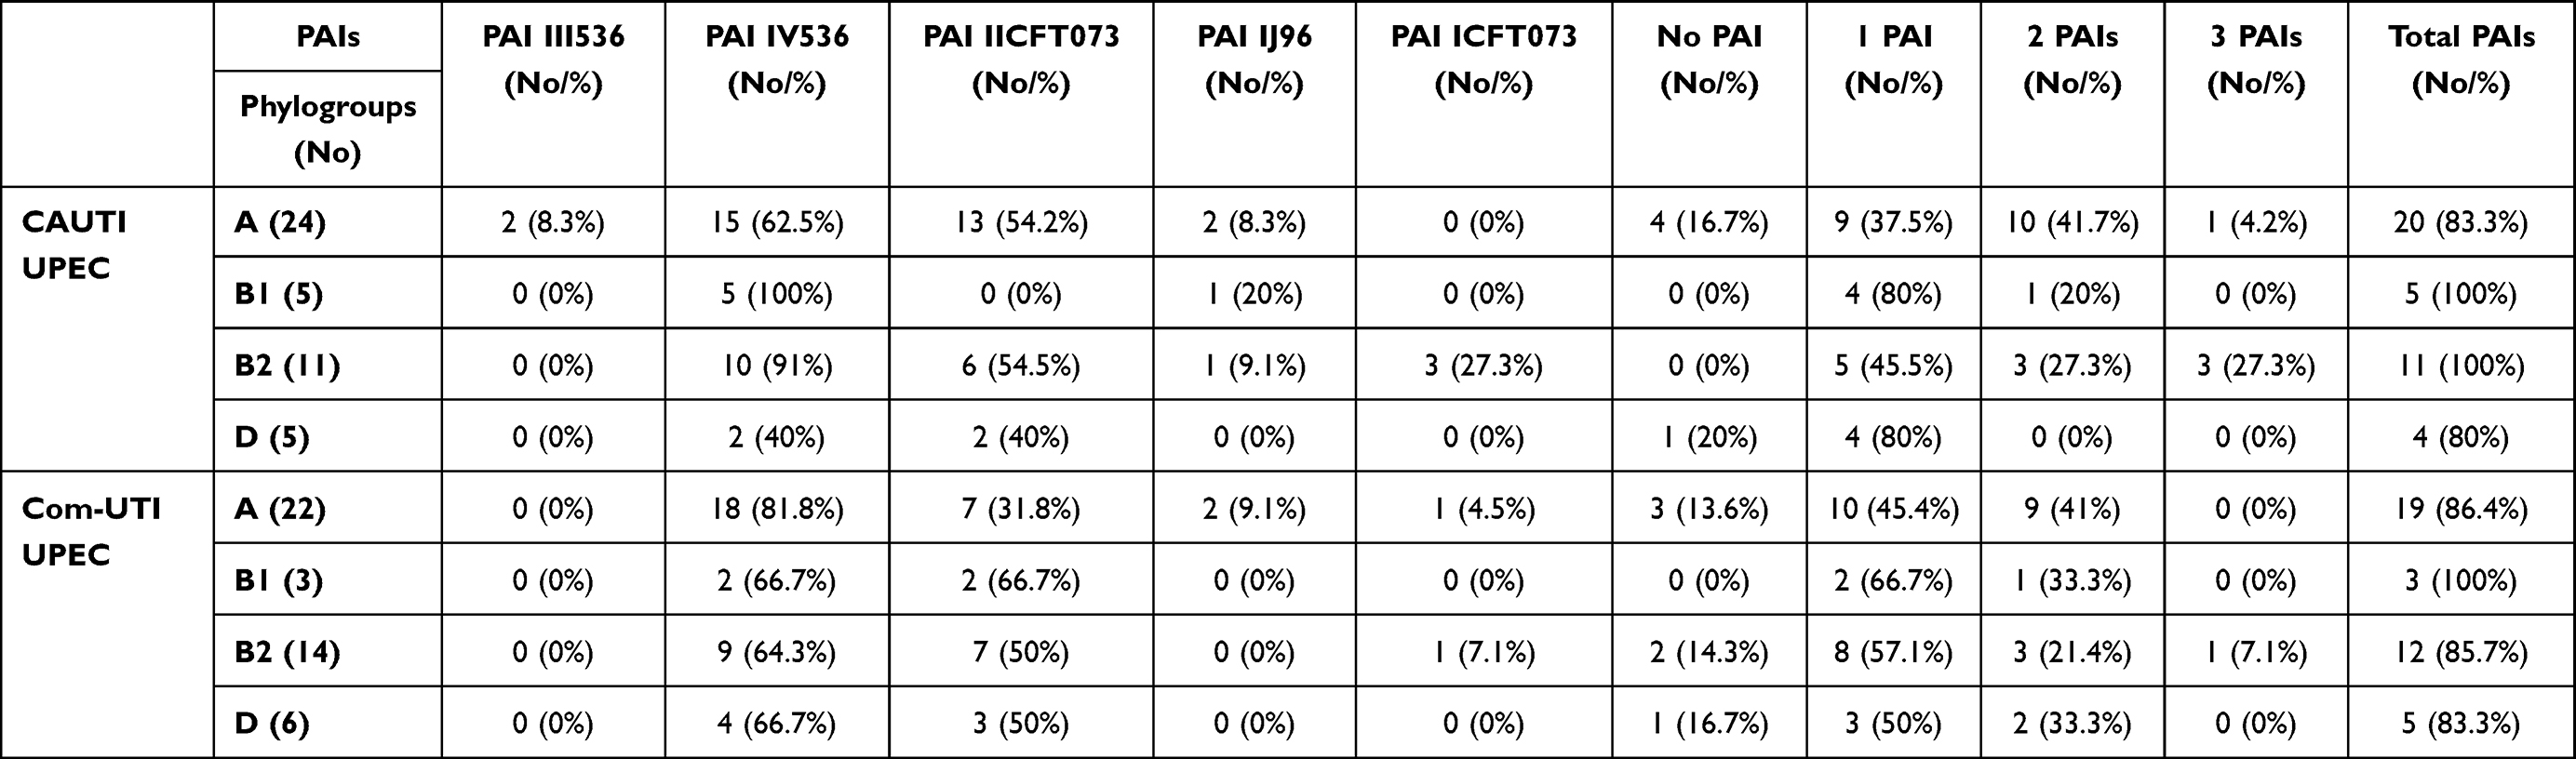 |
Table 4 Prevalence of PAIs in Different UPEC Phylogroups Isolated from CAUTI and Com-UTI |
Discussion
The UTI is one of the leading causes of bacterial infections either in community or hospital facilities where the CAUTI is considered one of the most common cause of health-care associated infections as the catheter is a predisposing factor to UTI mostly due to uropathogenic E. coli. Characterization of different phylogroups of uropathogenic E. coli is crucial to understand the pathogenesis of the infection and plan for treatment, prevention and control of UTI especially in hospitals.7,22
The present study involved UPEC strains isolated from 90 adult patients with CAUTI and Com-UTI. Antibiotic resistance pattern of UPEC strains showed a similar high resistance pattern in CAUTI and Com-UTI strains to ampicillin, amoxicillin-clavulanate, cefuroxime, tetracycline, ciprofloxacin, norfloxacin, trimethoprim-sulfamethoxazole, ceftazidime and aztreonam; 100%, 86.7%, 86.7%, 75.6%, 71.1%, 71.1%, 66.7%, 55.6% and 53.3% vs 100%, 73.3%, 84.4%, 75.6%, 66.7%, 60%, 62.2%, 46.7% and 46.7%, respectively, and a similar low resistance to amikacin, meropenem and gentamicin; 4.4%, 6.7% and 26.7% vs 2.2%, 4.4% and 20%, respectively.
In agreement with our results, E. coli strains from UTI in Ethiopia had a high resistance rate to ampicillin (86.5%), ceftazidime (84%), tetracycline (80%), trimethoprim-sulfamethoxazole (68.5%) and cefotaxime (66%) and low resistance rate to gentamicin (20%), amikacin (2.5%) and meropenem (0%).22 Similarly, in Egypt UPEC isolates displayed a high resistance to ampicillin (91.4%), amoxicillin-clavulanate (84.6%), cefuroxime (90.3%), tetracycline (71.4%), ciprofloxacin (60%), norfloxacin (60%), trimethoprim-sulfamethoxazole (70.9%), ceftazidime (69.1%) and aztreonam (64%).23 Comparable to our results, the low resistance of E. coli to amikacin, meropenem and gentamicin has been reported in Egypt,23 India,24 Iran25 and Hungary.26
The ESBLs are commonly produced by E. coli either in community or health-care associated infections. In the current study, 48.9% of UPEC isolates from CAUTI produced ESBLs in comparison to 33.3% of strains from Com-UTI in agreement with other studies from Egypt where the prevalence of ESBLs in E. coli ranged from 39% to 52%.27,28
Increased prevalence of MDR UPEC worldwide and in Egypt is considered a major health challenge due to difficult treatment. In the current work, 80% of UPEC strains from CAUTI were MDR in comparison to 71.1% of isolates from Com-UTI. Consistently, the high prevalence of MDR UPEC has been recorded in Egypt (91%),23 Iran10,29 and Mongolia30 especially in CAUTI.31 There were no extensively drug resistant (XDR) UPEC strains which were susceptible to only one or two antibiotic groups or pandrug-resistant (PDR)32 UPEC isolates that were non-susceptible to all agents in all antimicrobial groups among all isolates from CAUTI and Com-UTI.
The association between the biofilm production by UPEC and the antibiotic resistance is a matter of debate.33 However, it has been documented that E. coli causing UTI is associated with biofilm formation with increasing the resistance to antibiotics due to the need for high concentration of drugs to reach the base of biofilm leading to its difficult eradication as has been reported in Egypt23 where 76.5% of UPEC isolates were associated with biofilm formation. In the present study, UPEC strains isolated from CAUTI significantly produced biofilm higher than Com-UTI strains (68.9% vs 44.4%). This is in agreement with another study that has documented that biofilm formation by UPEC is significantly higher in catheterized patients than non-catheterized patients.24 Similarly, a study from Pakistan has reported that 68.8% of E. coli causing CAUTI has been associated with biofilm production.2
Regular surveillance and monitoring, implementation of infection control measures to reduce CAUTI and antibiotic stewardship are mandatory to control UTI especially CAUTI and prevent the spread of antibiotic resistance and MDR.
Each E. coli phylogroup has a characteristic virulence features which control its pathogenicity. It has been reported that UPEC belongs to phylogroups B2 and D, while phylogroups A and B1 are commensals.30,34 In our study, the common phylogroup in CAUTI and Com-UTI isolates was phylogroup A (53.3% vs 48.9%, respectively) followed by B2, D and B1. The phylotyping of UPEC isolates was performed according to the scheme proposed by Clement et al11 to detect the 4 main UPEC phylogenetic types more prevalent in our geographic region.3,22,23,25,35
Several studies showed different distributions of the phylogroups of UPEC in the studied population. In Ethiopia, UTI was mainly caused by group B2 (30%) followed by group D (27.5%), group B1 (24%) and group A (18.5%).22 In agreement, literatures from Mongolia,30 Poland36 and Iran37 have stated that group B2 is the most prevalent E. coli strains. On the other hand, phylogroup D was the most prevalent group causing UTI in China.38
Consistent with our study, a study from Egypt35 has documented that phylogroup A is predominant in UPEC strains followed by group B2 and lastly D. The predominance of phylogroup A E. coli has been also reported in China,39 Russia40 and Iran.41
It has been suggested that phylogroup A could be pathogenic as other E. coli phylogroups as it possess the virulence genes as other pathogenic phylogroups. In addition, the gastrointestinal tract might be the reservoir of the pathogenic UPEC causing UTI. The difference in the distribution of phylogenetic groups in different literatures might be due to the geographical variation and the different enrolled patients, samples and diagnostic methods.22,35
The present study detected 5 out of 8 PAIs in 88.9% and 86.7% of UPEC isolates from CAUTI and Com-UTI, respectively. PAI IV536 was the most common marker detected in UPEC strains from CAUTI (71.1%) and Com-UTI (73.3%) followed by PAI IICFT073, PAI IJ96, PAI ICFT073 and PAI III536. No statistical differences were detected in the number and types of PAIs between CAUTI and Com-UTI E. coli strains.
PAIs are present in pathogenic E. coli strains carrying the virulence genes that encode the virulence determinants and are rarely found in non-pathogenic strains. Similar to our findings, Firoozeh et al7 have detected 5 of 8 PAIs in 87.1% of the UPEC isolates where the PAI IV536 was the most prevalent marker. They found 42% of the UPEC isolates from CAUTI carried 2–3 PAI markers at the same time primarily PAI IV536 with no difference in the detected PAIs among CAUTI and Com-UTI strains. Consistent with our study, Sabate et al21 have documented that 93% of UPEC isolates carried PAI markers predominantly PAI IV536 and 43% of UPEC carried 2–3 PAIs. In accordance with our findings, PAIs were detected in 98.7% of UPEC mostly PAI IV536 followed by PAI IICFT073 and multiple PAIs were detected in 58.7% of the isolates.10
PAI IV536 is called High-Pathogenicity Island (HPI) and is highly frequent in commensal E. coli, UPEC and Enterobacteriaceae suggesting that it might be a fitness island not a pathogenicity one. Additionally, it is the first PAI acquired and most stable PAI on the chromosome.7,10,21
In the current study, PAI I536, PAI II536 and PAI IIJ96 were not detected and PAI IJ96 and PAI III536 were detected at a low frequency in UPEC isolates which might be because of PAI II536 and PAI IJ96 is not important in the pathogenesis of UTI. Additionally, PAI II536 and PAI III536 are unstable and easy to lose.10,21
In the present work, CAUTI and Com-UTI isolates had no significant relationship between the antibiotic resistance pattern and different phylogroups except the significant resistance of cefotaxime, ceftazidime and aztreonam with phylogenetic D in CAUTI isolates. Similarly, there were no significant differences in resistance rate among different UPEC phylogroups despite the high insignificant resistance pattern in groups D and A with some antibiotics.20,25,30 Additionally, in Mexico, the high antibiotic resistance was distributed in all phylogenetic groups.42
Different data are available about the relationship of antibiotic resistance profile with specific phylogroups such as A,41,43 B23,42,44 and E.37 This variation in the distribution of the antibiotic resistance between UPEC phylogenetic groups might be due to different dominant phylogroups in the different geographic regions even within the same country.37,44 No significant association was detected between different phylogenetic groups and MDR in accordance with other literatures.20,25,30 No relevance was detected in the phylogenetic groups with respect to the biofilm formation in contrary to other literatures where phylogroups A20 and B245 have been associated with more biofilm production.
In the current study, PAIs were prevalent in all strains of phylogroups B1 and B2 from CAUTI and phylogroup B1 from Com-UTI predominantly PAI IV536. It has been documented that there is a positive association between phylogroup B2 and the presence of PAIs in UPEC as it carries several even all of the tested PAIs reflecting the preference of specific phylogroups to encode the virulence determinants.21,44,46
Further studies are necessary to clarify the role of phylogroups A and B1 in UTI; whether those groups recovered from UTI are commensals or natural pathogens in healthy individuals with UTI because of their possession of high number of PAIs which suggests that the colon might act as a reservoir for UTI by commensal E. coli.47 Future work is needed to improve our phylogenetic typing of UPEC by adopting the updated Clermont et al12 phylotyping scheme. Additionally, the small number of our studied patients is a limiting factor for a consolidated conclusion; therefore, more in-depth, large-scale studies are needed to validate the current findings.
Conclusions
The current study highlighted the increased antibiotic resistance rate, ESBL production and MDR in UPEC strains isolated from both types of UTIs. The UPEC strains from CAUTI significantly produced biofilm higher than Com-UTI strains. Phylogroup A UPEC was the predominate phylogroup in both urinary tract infections. No significant relationship was detected between the antibiotic resistance profile, MDR, ESBL production and biofilm formation among different UPEC phylogroups from CAUTI and Com-UTI except the significant resistance of cefotaxime, ceftazidime and aztreonam in phylogenetic D from CAUTI isolates. PAI IV536 was the most prevalent marker in all phylogroups from CAUTI and Com-UTI making it a promising option for a new treatment strategy.
Funding
The article is self-funded.
Disclosure
Professor Rasha El-Mahdy reports that this work was accepted as an e-poster at the 31st European Congress of Clinical Microbiology & Infectious Diseases (ECCMID), which took place online from 9 to 12 July, 2021. The authors report no conflicts of interest in this work.
References
1. Gajdács M. The importance of reporting clinical and epidemiological data in urology: local experiences and insights from the international literature. Medicina. 2020;56(11):581. doi:10.3390/medicina56110581
2. Sabir N, Ikram A, Zaman G, et al. Bacterial biofilm-based catheter-associated urinary tract infections: causative pathogens and antibiotic resistance. Am J Infect Control. 2017;45:1101–1105. doi:10.1016/j.ajic.2017.05.009
3. Lee JH, Subhadra B, Son Y-J, et al. Phylogenetic group distributions, virulence factors and antimicrobial resistance properties of uropathogenic Escherichia coli strains isolated from patients with urinary tract infections in South Korea. Lett Appl Microbiol. 2015;62:84–90. doi:10.1111/lam.12517
4. Wiles TJ, Kulesus RR, Mulvey MA. Origins and virulence mechanisms of uropathogenic Escherichia coli. Exp Mol Pathol. 2008;85:11–19. doi:10.1016/j.yexmp.2008.03.007
5. Hacker J, Blum-Oehler G, Muhldorfer I, Tschape H. Pathogenicity islands of virulent bacteria: structure, function and impact on microbial evolution. Mol Microbiol. 1997;23(6):1089–1097. doi:10.1046/j.1365-2958.1997.3101672.x
6. Gal-Mor O, Finlay BB. Pathogenicity islands: a molecular toolbox for bacterial virulence. Cell Microbiol. 2006;8:1707–1719. doi:10.1111/j.1462-5822.2006.00794.x
7. Firoozeh F, Soleimani-Moorchekhorti L, Zibaei M. Evaluation of pathogenicity islands in uropathogenic Escherichia coli isolated from patients with urinary catheters. J Infect Dev Ctries. 2017;11:557–562. doi:10.3855/jidc.8660
8. Ostblom A, Adlerberth I, Wold AE, Nowrouzian FL. Pathogenicity island markers, virulence determinants malX and usp, and the capacity of Escherichia coli to persist in infants’ commensal microbiotas. Appl Environ Microbiol. 2011;77(7):2303–2308. doi:10.1128/AEM.02405-10
9. Gazal LE, Puño-Sarmiento JJ, Medeiros LP, et al. Presence of pathogenicity islands and virulence genes of extraintestinal pathogenic Escherichia coli (ExPEC) in isolates from avian organic fertilizer. Poult Sci. 2015;94(12):3025–3033. doi:10.3382/ps/pev278
10. Samei A, Haghi F, Zeighami H. Distribution of pathogenicity island markers in commensal and uropathogenic Escherichia coli isolates. Folia Microbiol. 2016;61(3):261–268. doi:10.1007/s12223-015-0433-8
11. Clermont O, Bonacorsi S, Bingen E. Rapid and simple determination of the Escherichia coli Phylogenetic Group. Appl Environ Microbiol. 2000;66(10):4555–4558. doi:10.1128/AEM.66.10.4555-4558.2000
12. Clermont O, Christenson JK, Denamur E, Gordon DM. The Clermont Escherichia coli phylo-typing method revisited: improvement of specificity and detection of new phylo-groups. Environ Microbiol Rep. 2013;5(1):58–65. doi:10.1111/1758-2229.12019
13. Horan TC, Andrus M, Dudeck MA. CDC/NHSN surveillance definition of health care-associated infection and criteria for specific types of infections in the acute care setting. Am J Infect Control. 2008;36:309–332. doi:10.1016/j.ajic.2008.03.002
14. Kabugo D, Kizito S, Ashok DD, et al. Factors associated with community-acquired urinary tract infections among adults attending assessment centre, Mulago hospital Uganda. Afr Health Sci. 2016;16(4):1131–1142. doi:10.4314/ahs.v16i4.31
15. Gajdács M, Ábrók M, Lázár A, Burián K. Differential epidemiology and antibiotic resistance of lactose-fermenting and non-fermenting Escherichia coli: is it just a matter of taste? Biol Futura. 2020;71(1–2):175–182. doi:10.1007/s42977-020-00016-6
16. Collee JG, Marmion BP, Fraser AG, Simmons A, (editors). Mackie and McCartney Practical Medical Microbiology.
17. Hooton TM, Bradley SF, Cardenas DD, et al. Diagnosis, prevention, and treatment of catheter associated urinary tract infection in adults: 2009 International Clinical Practice Guidelines from the Infectious Diseases Society of America. Clin Infect Dis. 2010;50:625–663.
18. Wayne PA. Clinical and Laboratory Standards Institute (CLSI). Performance standards for antimicrobial susceptibility testing. 25th informational supplement; 2015:M100–S25.
19. Magiorakos AP, Srinivasan A, Carey RB, et al. Multidrug-resistant, extensively drug-resistant and pandrug-resistant bacteria: an international expert proposal for interim standard definitions for acquired resistance. Clin Microbiol Infect. 2012;18:268–281. doi:10.1111/j.1469-0691.2011.03570.x
20. Pompilio A, Crocetta V, Savini V, et al. Phylogenetic relationships, biofilm formation, motility, antibiotic resistance and extended virulence genotypes among Escherichia coli strains from women with community-onset primitive acute pyelonephritis. PLoS One. 2018;13(5):e0196260. doi:10.1371/journal.pone.0196260
21. Sabate M, Moreno E, Perez T, Andreu A, Prats G. Pathogenicity island markers in commensal and uropathogenic Escherichia coli isolates. Clin Microbiol Infect. 2006;12(9):880–886. doi:10.1111/j.1469-0691.2006.01461.x
22. Dadi BR, Abebe T, Zhang L, Mihret A, Abebe W, Amogne W. Distribution of virulence genes and phylogenetics of uropathogenic Escherichia coli among urinary tract infection patients in Addis Ababa, Ethiopia. BMC Infect Dis. 2020;20:108. doi:10.1186/s12879-020-4844-z
23. Gawad WE, Helmy OM, Tawakkol WM, Hashem AM. Antimicrobial resistance, biofilm formation, and phylogenetic grouping of uropathogenic Escherichia coli isolates in Egypt: the role of efflux pump-mediated resistance. Jundishapur J Microbiol. 2018;11(2):e14444.
24. Karigoudar RM, Karigoudar MH, Wavare SM, Mangalgi SS. Detection of biofilm among uropathogenic Escherichia coli and its correlation with antibiotic resistance pattern. J Lab Physicians. 2019;11:17–22. doi:10.4103/JLP.JLP_98_18
25. Taheri M, Saleh M, Nemati AH, et al. Antibiotic resistance pattern and phylogenetic groups of the uropathogenic Escherichia coli isolates recovered from the urinary catheters of the hospitalized patients. J Med Microbiol Infect Dis. 2016;4:76–82.
26. Gajdács M, Ábrók M, Lázár A, Burián K. Comparative epidemiology and resistance trends of common urinary pathogens in a tertiary-care hospital: a 10-Year surveillance study. Medicina. 2019;55:356. doi:10.3390/medicina55070356
27. Saied T, Elkholy A, Hafez SF, et al. Antimicrobial resistance in pathogens causing nosocomial bloodstream infections in university hospitals in Egypt. Am J Infect Control. 2011;39:e61–e65. doi:10.1016/j.ajic.2011.04.009
28. Abdel-Moaty MM, Mohamed WS, Abdel-All SM, El-Hendawy HH. Prevalence and molecular epidemiology of extended spectrum β-lactamase producing Escherichia coli from hospital and community settings in Egypt. J Appl Pharm Sci. 2016;6:1042–1047.
29. Malekzadegan Y, Khashei R, Ebrahim-Saraie HS, Jahanabadi Z. Distribution of virulence genes and their association with antimicrobial resistance among uropathogenic Escherichia coli isolates from Iranian patients. BMC Infect Dis. 2018;18:572. doi:10.1186/s12879-018-3467-0
30. Munkhdelger Y, Gunregjav N, Dorjpurev A, Juniichiro N, Sarantuya J. Detection of virulence genes, phylogenetic group and antibiotic resistance of uropathogenic Escherichia coli in Mongolia. J Infect Dev Ctries. 2017;11(1):51–57. doi:10.3855/jidc.7903
31. Bardoloi V, Yogeesha Babu KV. Comparative study of isolates from community-acquired and catheter-associated urinary tract infections with reference to biofilm-producing property, antibiotic sensitivity and multi-drug resistance. J Med Microbiol. 2017;66:927–936. doi:10.1099/jmm.0.000525
32. Gajdács M, Bátori Z, Ábrók M, Lázár A, Burián K. Characterization of resistance in Gram-negative urinary isolates using existing and novel indicators of clinical relevance: a 10-year data analysis. Life. 2020;10:16. doi:10.3390/life10020016
33. Behzadi P, Urbán E, Gajdács M. Association between biofilm-production and antibiotic resistance in uropathogenic Escherichia coli (UPEC): an in vitro study. Diseases. 2020;8:17. doi:10.3390/diseases8020017
34. Picard B, Garcia JS, Gouriou S, Duriez P, Brahimi N, Bingen E. The link between phylogeny and virulence in Escherichia coli extraintestinal infection. Infect Immun. 2000;67:546–553. doi:10.1128/IAI.67.2.546-553.1999
35. Khairy RM, Mohamed ES, Abdel Ghany HM, Abdelrahim SS. Phylogenic classification and virulence genes profiles of uropathogenic E. coli and diarrhegenic E. coli strains isolated from community acquired infections. PLoS One. 2019;14(9):e0222441. doi:10.1371/journal.pone.0222441
36. Kot B, Wicha J, Gruzewska A, Piechota M, Wolska K, Obrebska M. Virulence factors, biofilm-forming ability, and antimicrobial resistance of urinary Escherichia coli strains isolated from hospitalized patients. Turk J Med Sci. 2016;46:1908–1914. doi:10.3906/sag-1508-105
37. Moeza NM, Mashoufa RY, Sedighib I, Shokoohizadeha L, Taheria M. Phylogroup classification and investigation the relationships between phylogroups and antibiotic resistance patterns of uropathogenic E. coli isolated from pediatric urinary tract infection. Gene Rep. 2020;20:100758. doi:10.1016/j.genrep.2020.100758
38. Gao Q, Zhang D, Ye Z, et al. Virulence traits and pathogenicity of uropathogenic Escherichia coli isolates with common and uncommon O serotypes. Microb Pathog. 2017;104:217e224. doi:10.1016/j.micpath.2017.01.027
39. Tong Y, Sun S, Chi Y. Virulence genotype and phylogenetic groups in relation to Chinese herb resistance among Escherichia coli from patients with acute pyelonephritis. Afr J Tradit Complement Altern Med. 2014;11:234–238. doi:10.4314/ajtcam.v11i3.33
40. Grude N, Potaturkina-Nesterova NI, Jenkins A, et al. Comparison of phylogenetic group, virulence factors and antibiotic resistance in Russian and Norwegian isolates of Escherichia coli from urinary tract infection. Clin Microbiol Infect. 2007;13:208–211. doi:10.1111/j.1469-0691.2006.01584.x
41. Adib N, Ghanbarpour R, Solatzadeh H, Alizade H. Antibiotic resistance profile and virulence genes of uropathogenic Escherichia coli isolates in relation to phylogeny. Trop Biomed. 2014;31(1):17–25.
42. Paniagua-Contreras GL, Monroy-Pérez E, Bautista A, et al. Multiple antibiotic resistances and virulence markers of uropathogenic Escherichia coli from Mexico. Pathog Glob Health. 2018;112(8):415–420. doi:10.1080/20477724.2018.1547542
43. Derakhshandeh A, Firouzi R, Motamedifar M, et al. Virulence characteristics and antibiotic resistance patterns among various phylogenetic groups of uropathogenic Escherichia coli isolates. Jpn J Infect Dis. 2015;68:428–431. doi:10.7883/yoken.JJID.2014.327
44. Navidinia M, Peerayeh SN, Fallah F, Bakhshi B, Sajadinia RS. Phylogenetic grouping and pathotypic comparison of urine and fecal Escherichia coli isolates from children with urinary tract infection. Braz J Microbiol. 2014;45(2):509–514. doi:10.1590/S1517-83822014000200019
45. Tewawong N, Kowaboot S, Pimainog Y, Watanagul N, Thongmee T, Poovorawan Y. Distribution of phylogenetic groups, adhesin genes, biofilm formation and antimicrobial resistance of uropathogenic Escherichia coli isolated from hospitalized patients in Thailand. PeerJ. 2020;8:e10453. doi:10.7717/peerj.10453
46. Najafi A, Hasanpour M, Askary A, Aziemzadeh M, Hashemi N. Distribution of pathogenicity island markers and virulence factors in new phylogenetic groups of uropathogenic Escherichia coli isolates. Folia Microbiol (Praha). 2018;63:335–343. doi:10.1007/s12223-017-0570-3
47. Peerayeh SN, Navidinia M, Fallah F, Bakhshi B, Jamali J. Pathogenicity determinants and epidemiology of uropathogenic E. coli (UPEC) strains isolated from children with urinary tract infection (UTI) to define distinct pathotypes. Biomed Res. 2018;29(10):2035–2043. doi:10.4066/biomedicalresearch.29-17-1591
 © 2021 The Author(s). This work is published and licensed by Dove Medical Press Limited. The full terms of this license are available at https://www.dovepress.com/terms.php and incorporate the Creative Commons Attribution - Non Commercial (unported, v3.0) License.
By accessing the work you hereby accept the Terms. Non-commercial uses of the work are permitted without any further permission from Dove Medical Press Limited, provided the work is properly attributed. For permission for commercial use of this work, please see paragraphs 4.2 and 5 of our Terms.
© 2021 The Author(s). This work is published and licensed by Dove Medical Press Limited. The full terms of this license are available at https://www.dovepress.com/terms.php and incorporate the Creative Commons Attribution - Non Commercial (unported, v3.0) License.
By accessing the work you hereby accept the Terms. Non-commercial uses of the work are permitted without any further permission from Dove Medical Press Limited, provided the work is properly attributed. For permission for commercial use of this work, please see paragraphs 4.2 and 5 of our Terms.