")
Back to Journals » ClinicoEconomics and Outcomes Research » Volume 11
Health-related quality of life outcomes, economic burden, and associated costs among diagnosed and undiagnosed depression patients in Japan
Authors Yamabe K, Liebert R, Flores N, Pashos CL
Received 11 July 2018
Accepted for publication 9 November 2018
Published 12 March 2019 Volume 2019:11 Pages 233—243
DOI https://doi.org/10.2147/CEOR.S179901
Checked for plagiarism Yes
Review by Single anonymous peer review
Peer reviewer comments 3
Editor who approved publication: Professor Giorgio Colombo
Kaoru Yamabe,1 Ryan Liebert,2 Natalia Flores,2 Chris L Pashos3
1Healthcare Policy and Access, Takeda Pharmaceutical Company Limited, Nihonbashi, Chuouku, Tokyo 103-8668, Japan; 2Health Outcomes Research, Kantar Health, New York, NY 10010, USA; 3Global Outcomes & Epidemiology Research, Data Sciences Institute, Takeda Pharmaceuticals International, Inc., Cambridge, MA 02139, USA
Purpose: Depression is associated with substantial health and economic burden. This study examined the impact of diagnosed and undiagnosed depression on health-related outcomes and costs among Japanese adults.
Methods: A retrospective, observational study was conducted using 2012–2014 Japan National Health and Wellness Survey (N=83,504) data. Differences between respondents diagnosed with depression (n=2,843) and undiagnosed with depression (weighted n=2,717) and controls without depression (weighted n=2,801) in health-related quality of life, impairment to work productivity and daily activities (Work Productivity and Activity Impairment Questionnaire), health care resource utilization, and annual costs were evaluated. Propensity score weighting and weighted generalized linear models were used to compare groups on the outcome variables, after adjusting for covariates.
Results: Overall, respondents with undiagnosed depression had significantly better outcomes than those diagnosed with depression, but significantly worse outcomes than controls (for all, P<0.001). The mean Mental Component Summary scores were lower in the diagnosed group when compared with undiagnosed respondents and controls (33.2 vs 34.5 vs 48.6). Similar findings were obtained for mean Physical Component Summary (49.2 vs 49.5 vs 52.8) and health state utility scores (0.61 vs 0.62 vs 0.76). Additionally, the diagnosed group reported greater absenteeism (13.1 vs 6.6 vs 2.5%), presenteeism (41.4 vs 38.1 vs 18.8%), overall work productivity impairment (47.2 vs 41.1 vs 20.2%), and activity impairment (48.4 vs 43.3 vs 21.1%) than the undiagnosed and control groups, respectively. Consistently, patients with diagnosed depression had higher annual per patient direct (1.6-fold) and indirect costs (1.1-fold) than those in the undiagnosed depression group.
Conclusion: Diagnosed depression was associated with lower health-related quality of life and greater impairment in work productivity and daily activities, higher health care resource utilization, and higher costs, compared with undiagnosed respondents and controls. These study findings suggest a need for greater awareness of depression symptoms among Japanese adults, which is needed to facilitate proper diagnosis and treatment.
Keywords: activity impairment, direct costs, health care resource use, health-related quality of life, indirect costs, work productivity impairment
Introduction
Depression is a chronic, recurrent mental illness occurring due to complex interactions between social, psychological, and biological factors, which may eventually lead to suicide.1,2 According to the Global Burden of Disease Study 2016, depressive disorders affected more than 268 million individuals globally, with a large proportion being affected by major depressive disorder (62.5%). Moreover, major depression was one of the top five global causes of years lived with disability.3
Depression can negatively affect an individual’s health-related quality of life (HRQoL) and work productivity.4 A few studies from the US using the Study Short Form 8-Item Health Survey showed poor HRQoL, as evidenced by low Mental Component Summary (MCS) and Physical Component Summary (PCS) scores in depressed adults.5,6 The negative correlation between HRQoL and depression was also observed in Japan.7 Depression was also shown to be associated with impaired work productivity due to increased presenteeism and absenteeism.8,9 In Japan, a cross-sectional study showed that depression influences work productivity, absenteeism, and presenteeism, even among those workers whose depression was undiagnosed.10
Depression is also associated with high health care resource utilization (HRU) and costs.4 Among multimorbid primary care elderly patients, those with depression had a higher number of hospitalizations and physician visits and used more outpatient services and nursing care than patients with no depression, which resulted in higher health care expenditures for those with depression.11
Although the negative impact of depression on HRQoL, work productivity and daily activities, and costs has been assessed in various studies,7,10,12 there is a paucity of research examining differences in the health and economic burden of depression by diagnosis status (ie, undiagnosed vs diagnosed). To date, only a single study in China has evaluated the burden of depression in this manner, revealing that respondents with diagnosed/undiagnosed depression had lower HRQoL, higher work productivity and activity impairment, and higher HRU, compared with respondents without depression.13 However, similar studies among Japanese adults are unavailable. It is imperative to clarify these differences, as depression can negatively affect an individual in various life domains. Moreover, a lack of diagnosis precludes adequate treatment. Hence, identifying the characteristics of patients with depression and quantifying the effects of depression on a wide array of patient-reported outcomes are essential.
The current study aimed to examine the impact of depression (diagnosed and undiagnosed) on HRQoL, impairments in work productivity and daily activities, HRU, and costs among Japanese adults.
Materials and methods
Sample
The sample for this retrospective observational study comprised unique respondents (≥18 years old) who completed the 2012–2014 Japan National Health and Wellness Survey (NHWS; N=83,504). For the 6,489 respondents who completed the survey in more than 1 year, only the most recent data were used. NHWS respondents were recruited from the Lightspeed Research opt-in online panel. The stratified sampling strategy for the NHWS, with quotas for age brackets and sex, was designed to approximate the age and sex distribution of the Japanese adult general population. Participants who satisfied the following criteria were eligible for the study: 1) able to read and understand Japanese, 2) able to operate a computer to access the online survey, 3) resided in Japan, 4) aged 18 years or older, and 5) willing to provide informed consent. After providing informed consent, respondents completed a confidential self-administered online survey. Thus, all data were self-reported. Those who participated in the NHWS received points that could be exchanged for small prizes or accumulated over time for larger items. Due to the self-reported nature of the NHWS, it was exempted from review by the Pearl Institutional Review Board (Indianapolis, IN, USA). The study data will be provided for non-commercial use upon request.
Measures
Depression diagnosis status
The diagnosed depression group consisted of NHWS respondents who self-reported a diagnosis of depression. Those respondents who did not self-report a depression diagnosis, but who screened positive for depression (scores ≥10) on the 9-item Patient Health Questionnaire (PHQ-9), were included in the undiagnosed depression group (ie, individuals with potentially diagnosable depression who report a minimal threshold of depressive symptoms). The PHQ-9 is a screening tool that measures the severity of depression symptoms, such as anhedonia, sleep disturbance, and thoughts of self-harm, within the past 2 weeks. Scores on the PHQ-9 can range from 0 to 27. The control group comprised NHWS respondents who did not self-report a diagnosis of depression and did not screen positive for depression (scored <10) on the PHQ-9.14,15
Demographics
Demographic measures comprised age (continuous), gender (male or female), education (university degree or less than a university degree), household income (<¥3,000,000, ¥3,000,000 to <¥5,000,000, ¥5,000,000 to <¥8,000,000, ≥¥8,000,000, or decline to answer), and health insurance (national health insurance, social insurance, late stage elderly insurance, other insurance, or no insurance).
Health characteristics
Health characteristics included smoking habits (current, former, or never smoked), exercise behavior (number of days exercised in the past month), alcohol use (currently consume alcohol or abstain), body mass index (BMI) category (based on the World Health Organization’s recommendation for Asian populations:16 underweight [<18.5 kg/m2], acceptable risk [18.5 to <23.0 kg/m2], increased risk [23.0 to <27.5 kg/m2], high risk [≥27.5 kg/m2], or decline to provide weight), and the Charlson comorbidity index (CCI), a measure of comorbidity burden.17 The CCI weights the self-reported presence of several chronic conditions (eg, myocardial infarction, dementia, and diabetes) and then sums the result into an index score, with higher scores representing greater comorbidity burden.
HRQoL
PCS, MCS, and health utility scores from the Medical Outcomes Study Short Form 36-Item Health Survey Version 2 (SF-36v2) and Short Form 6-Dimensions (SF-6D) were used to assess HRQoL. Scores on the MCS and PCS, which are based on US general population norms (M=50.0, SD =10), can range from 0 to 100, with higher scores indicating better HRQoL.18 The SF-36v2 was also used to derive scores on the SF-6D health utilities index.19 Scores on the SF-6D can range from 0 to 1, with higher scores signifying better HRQoL.
Impairment to work and daily activities
Work productivity loss and impairment in daily activities were assessed using the general health version of the Work Productivity and Activity Impairment questionnaire (WPAI-GH).20 The WPAI-GH consists of four subscales (absenteeism, presenteeism, overall work productivity impairment, and activity impairment). Scores on the WPAI-GH are in the form of percentages, with greater impairment within the past 7 days due to the patient’s health indicated by higher values. The measure of overall work productivity impairment is based on a combination of the absenteeism and presenteeism subscales. Data on absenteeism, presenteeism, and overall work productivity impairment were collected only from currently employed respondents (full time, part time, or self-employed), whereas data were collected on activity impairment from all respondents.
HRU
HRU was defined by the number of health care provider visits, emergency room (ER) visits, and hospitalizations within the past 6 months.
Costs
Indirect and direct costs were estimated from the available NHWS data. Information from the WPAI-GH and hourly wage rates from the Japan Basic Survey on Wage Structure, 2011,21 were integrated using the Lofland method to calculate the annual indirect costs. Annual wages for each employed respondent were estimated by multiplying median weekly rates (provided by demographic strata) with the number of work weeks in a year. In order to estimate direct costs, the number of physician visits, ER visits, and hospitalizations was multiplied by two (to estimate annual number of visits) and then multiplied by the corresponding unit cost for each type of visit, which was obtained from the literature.22 For hospitalizations, the cost per day was obtained from the literature and the number of hospitalizations for each respondent was obtained from the NHWS. To align these metrics, we multiplied the cost per day by the average number of days per hospitalization, as reported by the Organization for Economic Cooperation and Development.23
Statistical analyses
Analyses were conducted using the Statistical Analysis System version 9.3. Analyses compared outcomes for individuals by depression status (diagnosed vs undiagnosed vs controls without depression).
Treatment of outliers and extraneous controls
The sample was checked for potential outliers prior to analysis, ie, respondents without depression whose mean values on the study covariates (eg, CCI scores) fell outside the range (eg, more than three SD) of the means for those diagnosed with depression or for those undiagnosed, but screening positive for depression on the PHQ-9. Based on the analysis of covariate distributions, no respondents were identified as outliers. Extraneous controls were trimmed solely based on age. The maximum age for the diagnosed depression group was 95 years old. Accordingly, controls over the age of 95 years were excluded from the sample (n=1). After the treatment of outliers and extraneous controls, the final sample used in analysis contained a total of 83,504 respondents.
Independent group comparisons
Differences in demographics and health characteristics were examined by depression status. These results served to identify differences between these populations and helped in the covariate selection process for the multivariable analyses. Significant differences between groups for categorical and continuous outcome variables were determined using chi-square and one-way ANOVA tests, respectively.
Creation of sample weights
Anticipated differences across the depression groups (ie, those with diagnosed depression or undiagnosed depression) and controls on baseline characteristics were minimized using propensity score weighting. The weights, which reflect how closely individuals in the control group were matched with corresponding individuals in each depression group, were estimated using the Toolkit for Weighting and Analysis of Non-equivalent Groups.24 This approach allows the modeling of causal effects in observational data sets, resulting in weighted samples that are nearly equivalent across comparison groups. Based on the independent sample comparisons, those demographics and health characteristics that revealed statistically significant differences (P<0.05) between groups were entered into a generalized boosted model to predict the presence of diagnosed depression and to balance the study groups. The generalized boosted model, a machine learning method, explores data interactions over several iterations of multiple regression trees to estimate propensity scores and weights, leading to increased efficiency and precision, compared with logistic regression models. The propensity weights obtained were also applied to the generalized linear models (GLMs) for multivariable analyses.25
Multivariable analyses
Weighted GLMs were used to further adjust for baseline differences that remained after weighting and to assess the unique burden associated with undiagnosed depression on health and economic outcomes, relative to those diagnosed with depression and controls. Only the covariates that significantly differed after using the weighting procedure (age and CCI scores) were included in this analysis. GLMs for the measures of HRQoL (MCS, PCS, and SF-6D health utilities) used a normal distribution for the error terms and an identity link function. Since the absenteeism, presenteeism, overall work productivity impairment, activity impairment, HRU, and direct/indirect costs variables were skewed, a negative binomial distribution with a log-link function was used to best fit the data. Estimated mean values, standard errors, 95% CIs, and P-values were calculated for each dependent variable.
Results
Demographics of study participants
A total of 83,504 respondents were included in the analyses. On average, the respondents were 47.54 years old, 50.6% were male, 60.6% were employed, 51.8% had less than a university degree, 25.6% had an annual household income between ¥3 million and <¥5 million, and 49.2% had social insurance (Table 1). In addition, 50.8% had a BMI categorized as acceptable risk, 69.5% consumed alcohol, 55.9% were never smokers, and 57.7% did not exercise in the past month. The total sample had an average CCI score of 0.14.
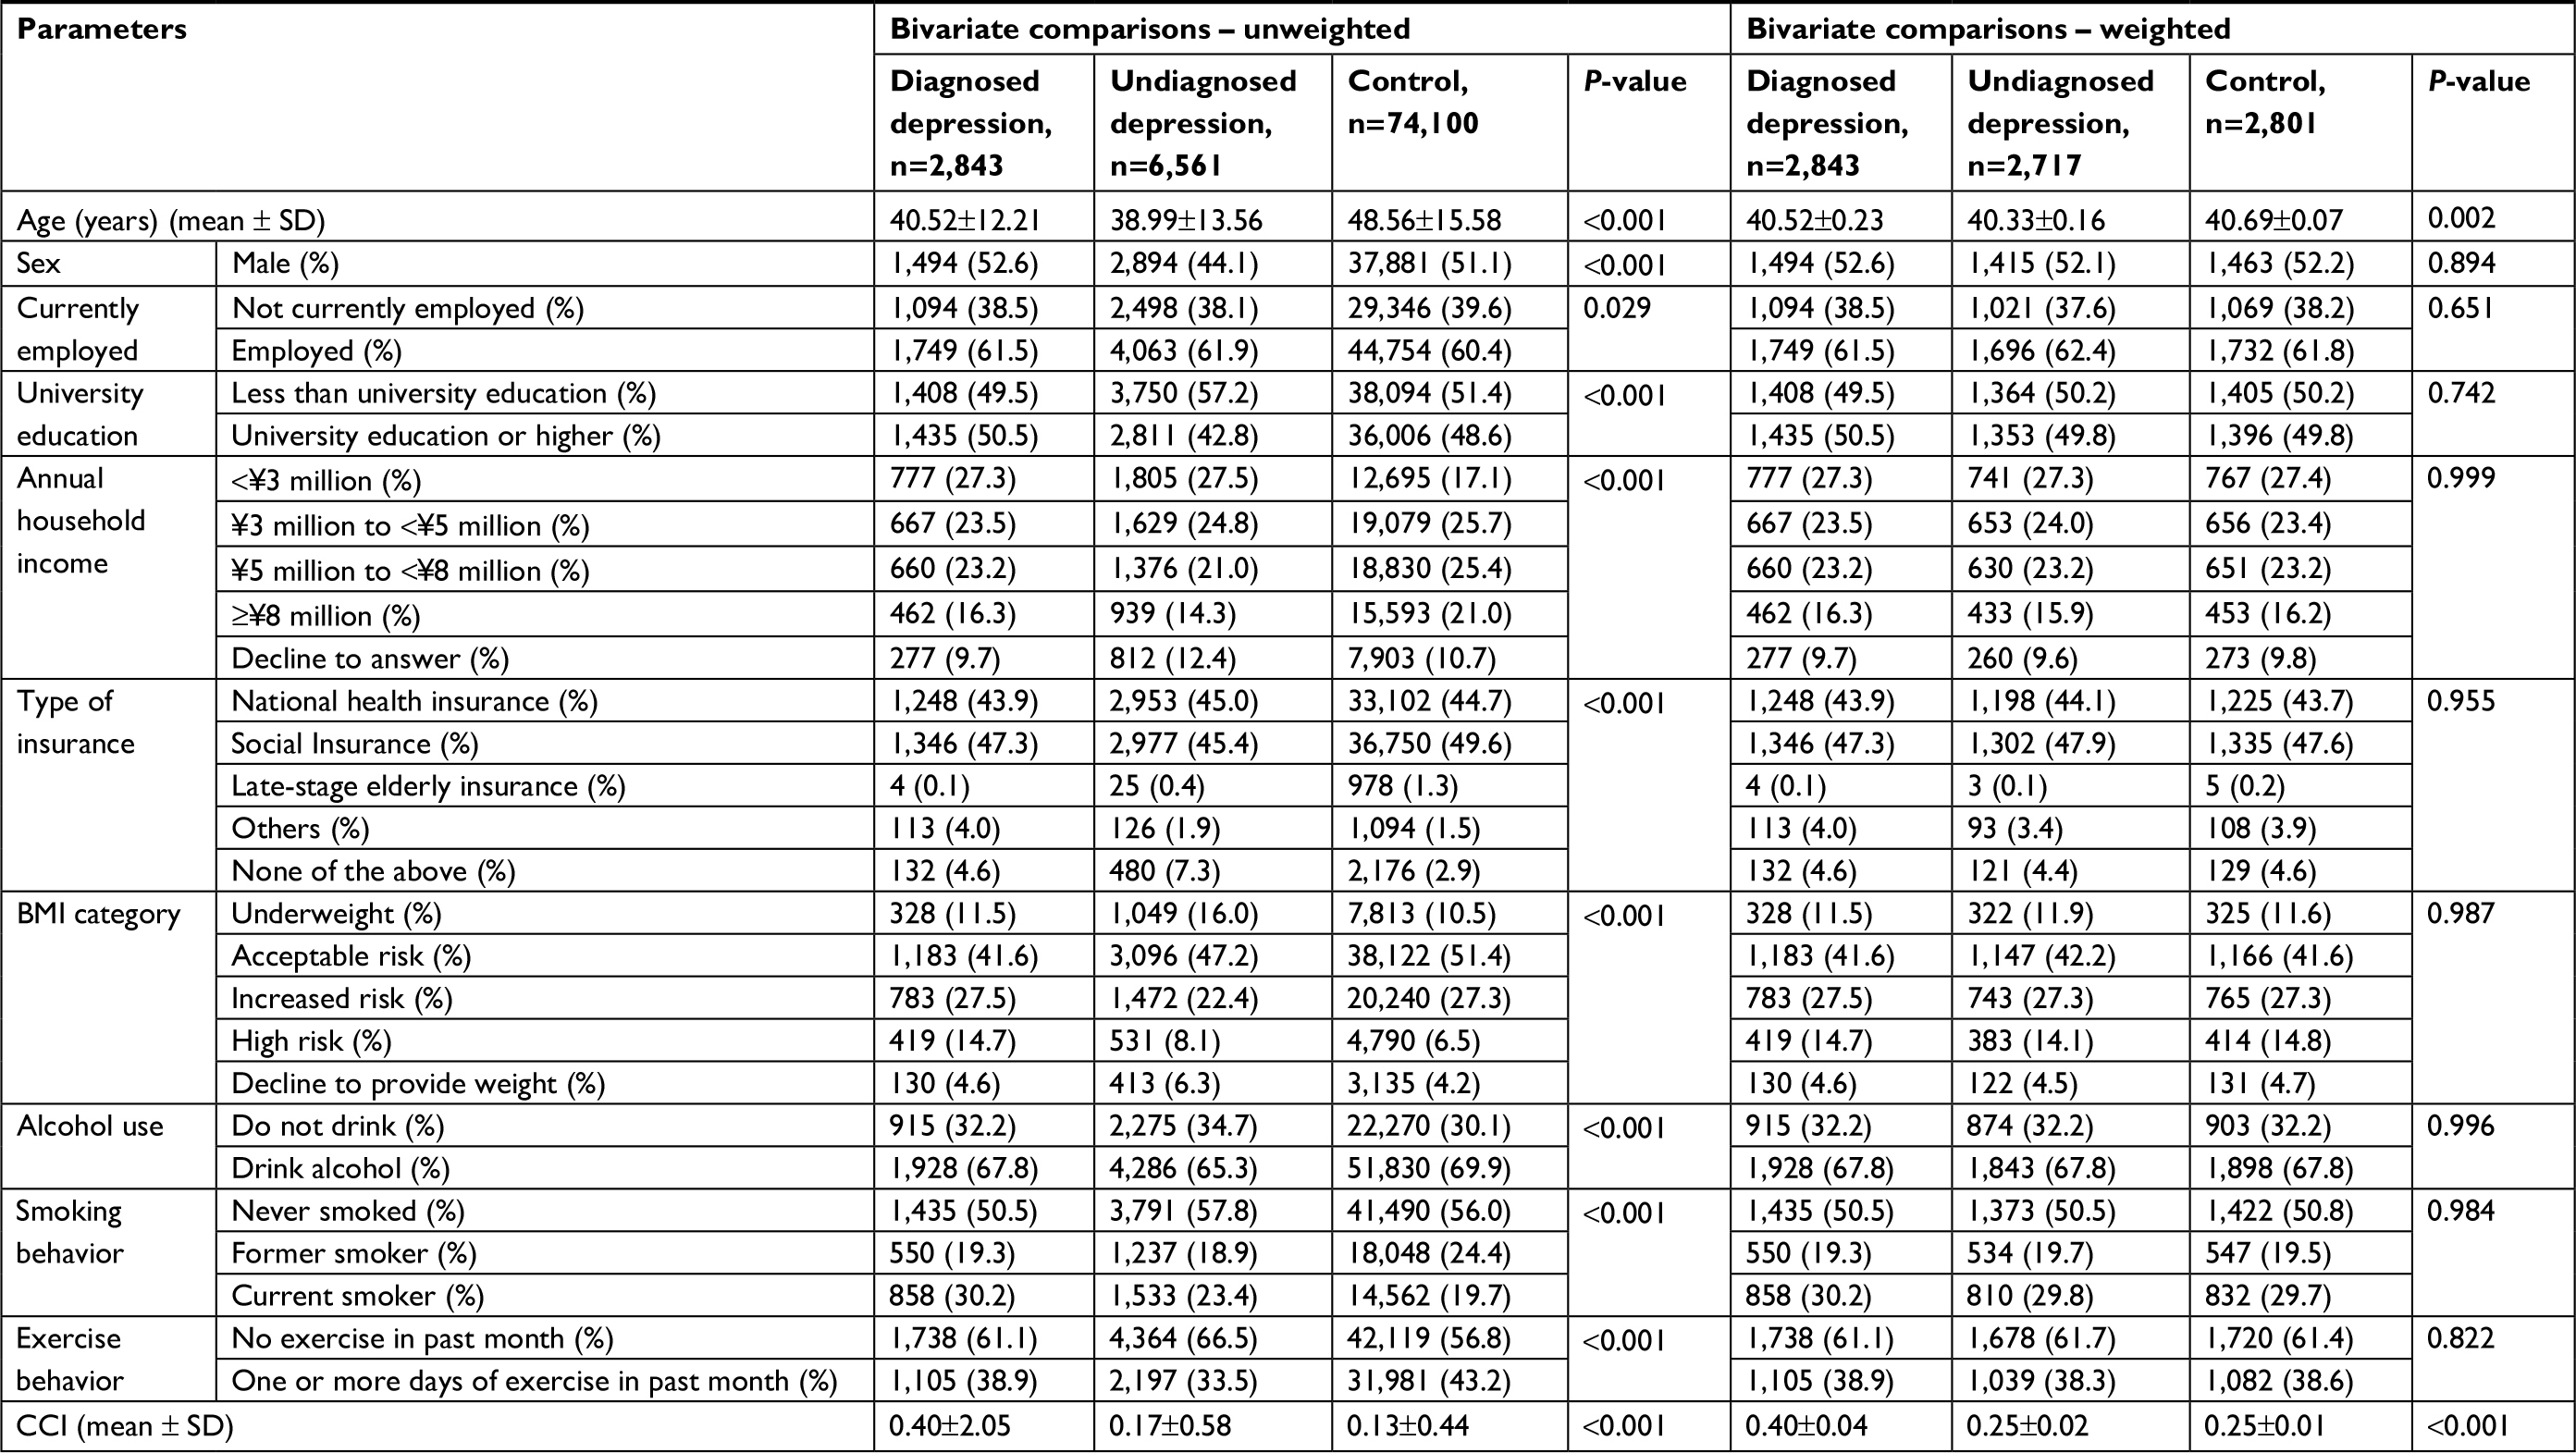 | Table 1 Demographics and health characteristics among respondents with diagnosed and undiagnosed depression and control groups Abbreviations: BMI, body mass index; CCI, Charlson comorbidity index. |
Based on a self-reported physician’s diagnosis of depression, the unweighted sample included 2,843 and 6,561 respondents with diagnosed depression and undiagnosed depression (PHQ-9 score ≥10), respectively, and the remaining 74,100 respondents comprised the control group without depression. Demographics and health characteristics significantly differed between the diagnosed depression, undiagnosed depression, and control groups (Table 1).
In the unadjusted sample, the diagnosed depression group had significantly lower MCS (32.5 vs 33.9 vs 49.6), PCS (49.7 vs 50.5 vs 53.7), and SF-6D health state utility scores (0.61 vs 0.62 vs 0.77; for all, P<0.001), compared with the undiagnosed depression and control groups. In addition, the diagnosed depression group had significantly higher absenteeism (14.1 vs 7.1 vs 2.3%), presenteeism (42.7 vs 38.5 vs 17.7%), overall work productivity impairment (48.8 vs 41.7 vs 19.0%), activity impairment (49.1 vs 43.0 vs 19.2%), physician visits in past 6 months (13.5 vs 5.3 vs 4.1), hospitalizations in the past 6 months (1.6 vs 0.9 vs 0.4), and ER visits in the past 6 months (0.42 vs 0.21 vs 0.08; for all, P<0.001), compared with the undiagnosed depression and control groups. Additionally, the diagnosed depression group had significantly higher annual per patient indirect costs (¥2,271,496 vs ¥1,812,940 vs ¥860,484), direct costs (¥2,087,418 vs ¥1,135,445 vs ¥560,232), physician visit costs (¥223,426 vs ¥88,199 vs ¥68,434), hospitalization costs (¥99,346 vs ¥55,910 vs ¥26,298), and ER visit costs (¥26,090 vs ¥12,909 vs ¥5,277; for all, P<0.001; Table 2), compared with the undiagnosed depression and control groups.
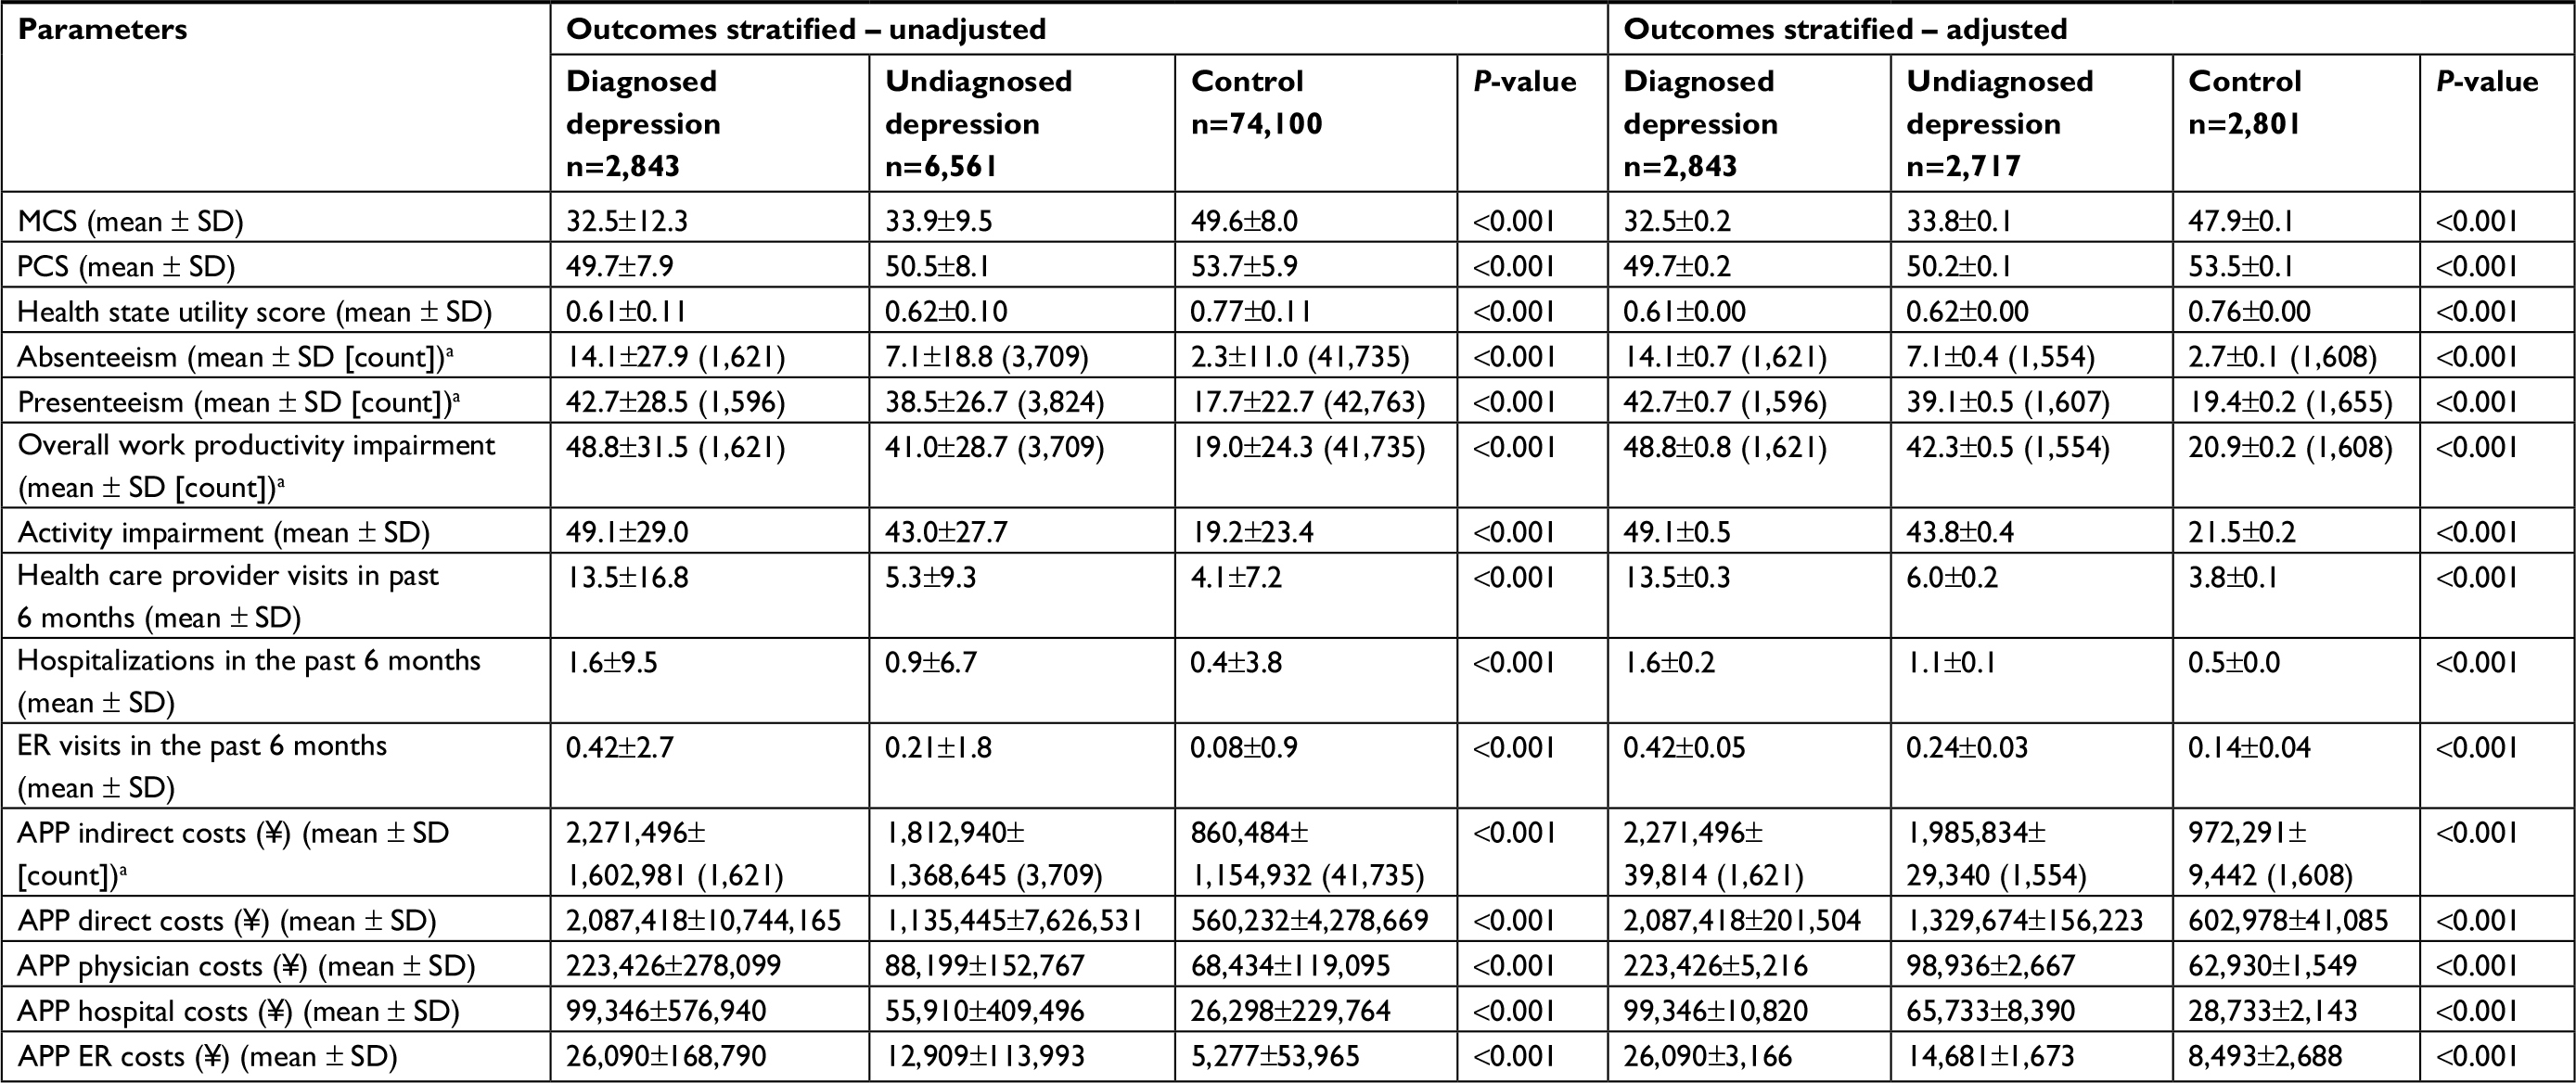 | Table 2 Effect of diagnosed and undiagnosed depression on HRQoL, work productivity loss, activity impairment, health care resource utilization, and costs Note: aNumber of patients. Abbreviations: APP, annual per-patient; ER, emergency room; HRQoL, health-related quality of life; MCS, Mental Component Summary; PCS, Physical Component Summary. |
The weighted samples were well-balanced and included a weighted sample size of 8,361 respondents, overall (n=2,801 controls, n=2,843 diagnosed, and n=2,717 undiagnosed). In the weighted sample, there were no statistically significant differences between groups on demographics and health characteristics, except for age (P=0.002) and CCI scores (P<0.001; Table 1).
Effect of depression on HRQoL, work productivity loss, activity impairment, HRU, and costs
In the adjusted sample, the diagnosed depression group had significantly lower MCS (32.5 vs 33.8 vs 47.9), PCS (49.7 vs 50.2 vs 53.5), and SF-6D health state utility scores (0.61 vs 0.62 vs 0.76; for all, P<0.001), compared with the undiagnosed depression and control groups. In addition, the diagnosed depression group had significantly higher absenteeism (14.1 vs 7.1 vs 2.7%), presenteeism (42.7 vs 39.1 vs 19.4%), overall work productivity impairment (48.8 vs 42.3 vs 20.9%), activity impairment (49.1 vs 43.8 vs 21.5%), physician visits in past 6 months (13.5 vs 6.0 vs 3.8), hospitalizations in the past 6 months (1.6 vs 1.1 vs 0.5), and ER visits in the past 6 months (0.42 vs 0.24 vs 0.14; for all, P<0.001), compared with the undiagnosed depression and control groups. The diagnosed depression group also had significantly higher annual per patient indirect costs (¥2,271,496 vs ¥1,985,834 vs ¥972,291), direct costs (¥2,087,418 vs ¥1,329,674 vs ¥602,978), physician visit costs (¥223,426 vs ¥98,936 vs ¥62,930), hospitalization costs (¥99,346 vs ¥65,733 vs ¥28,733), and ER visit costs (¥26,090 vs ¥14,681 vs ¥8,493; for all, P<0.001; Table 2), compared with the undiagnosed depression and control groups.
After further adjusting for age and CCI in the GLMs, respondents with diagnosed depression had significantly worse outcomes than respondents with undiagnosed depression, and respondents with undiagnosed depression had significantly worse outcomes than controls (Table 3). For HRQoL, this pattern was seen in MCS (33.2 vs 34.5 vs 48.6), PCS (49.2 vs 49.5 vs 52.8), and health state utility (0.61 vs 0.62 vs 0.76) scores. The same pattern of group differences was also observed for absenteeism (13.1 vs 6.6 vs 2.5%), presenteeism (41.4 vs 38.1 vs 18.8%), overall work productivity impairment (47.2 vs 41.1 vs 20.2%), and activity impairment (48.4 vs 43.3 vs 21.1%).
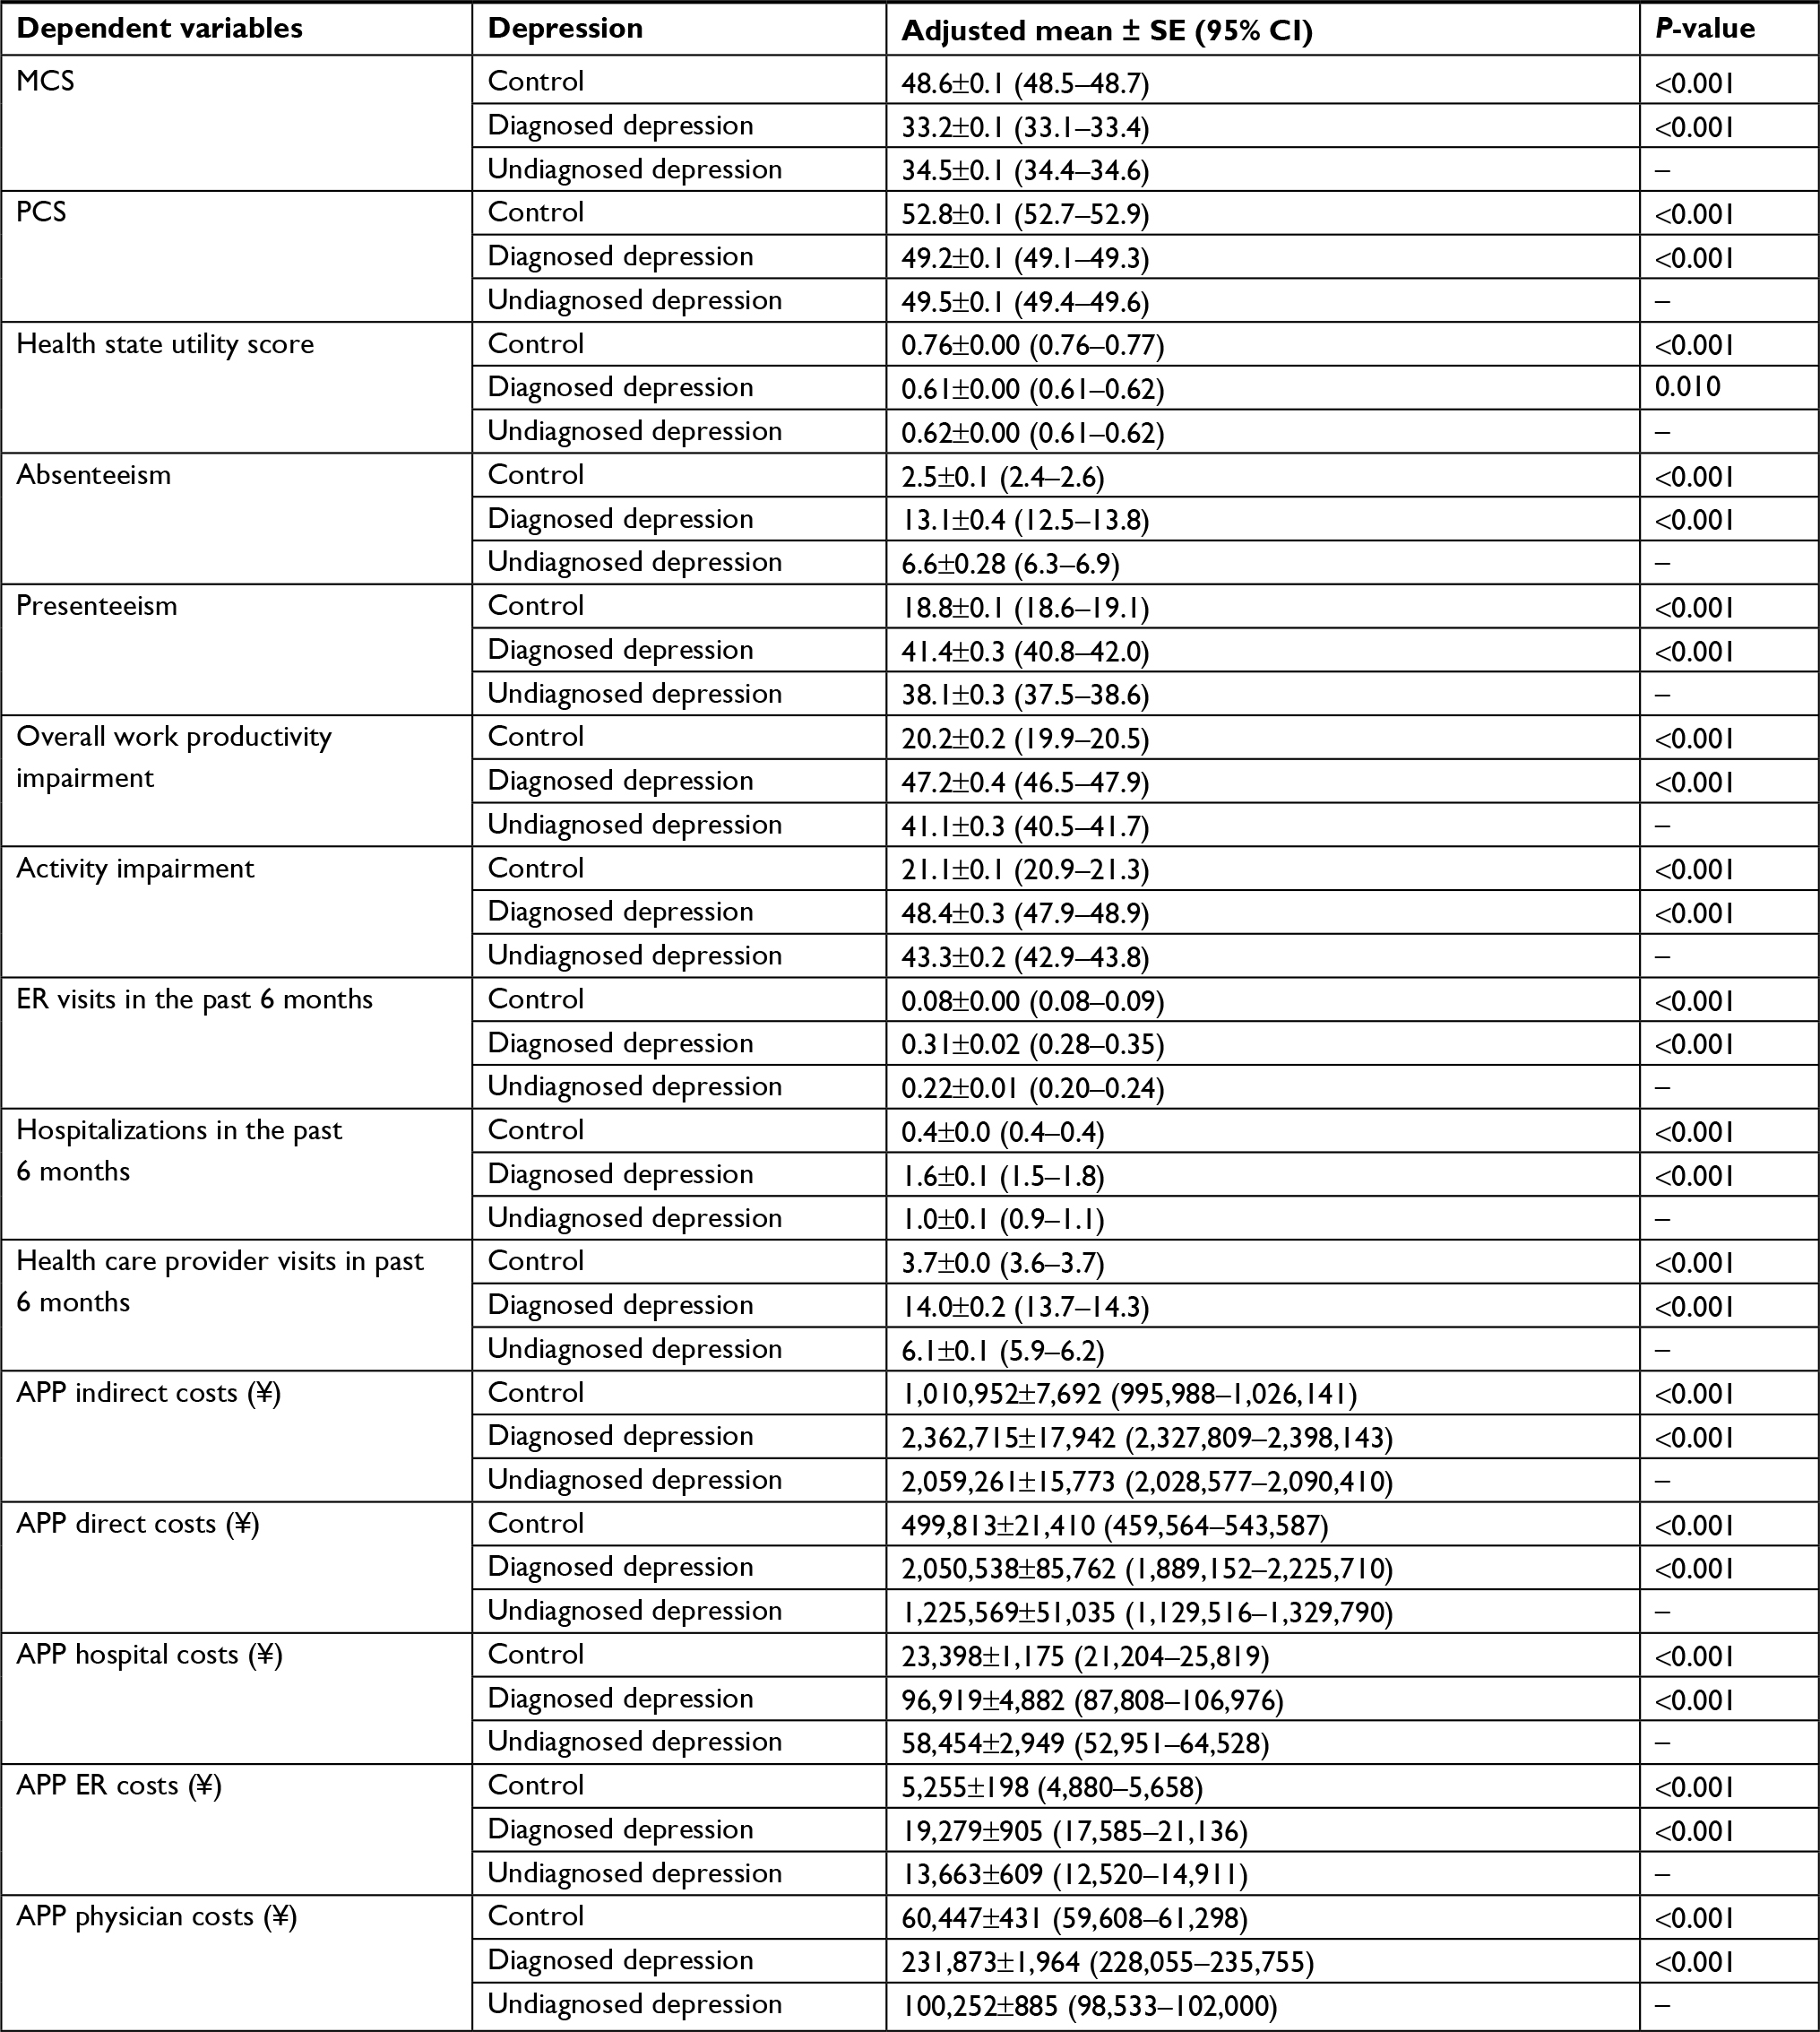 | Table 3 Effect of diagnosed and undiagnosed depression on HRQoL, work productivity loss, activity impairment, health care resource utilization, and costs, relative to controls, after further adjustment for age and CCI Abbreviations: APP, annual per-patient; ER, emergency room; HRQoL, health-related quality of life; MCS, Mental Component Summary; PCS, Physical Component Summary; SE, standard error. |
In terms of HRU, those with diagnosed depression had significantly more visits to the ER (0.31 vs 0.22), hospitalizations (1.6 vs 1.0), and physician visits (14.0 vs 6.1) in the past 6 months than respondents with undiagnosed depression. The undiagnosed depression group had significantly more visits to the ER (0.22 vs 0.08), hospitalizations (1.0 vs 0.4), and physician visits (6.1 vs 3.7) in the past 6 months than controls. For cost outcomes, the pattern of differences between groups was the same. Specifically, the diagnosed depression group had higher annual direct (¥2,050,538 vs ¥1,225,569) and indirect (¥2,362,715 vs ¥2,059,261) costs and costs for ER visits (¥19,279 vs ¥13,663), hospitalizations (¥96,919 vs ¥58,454), and physician visits (¥231,873 vs ¥100,252) than undiagnosed patients. In turn, the undiagnosed depression group had significantly higher annual direct (¥1,225,569 vs ¥499,813) and indirect (¥2,059,261 vs ¥1,010,952) costs, and costs for ER visits (¥13,663 vs ¥5,255), hospitalizations (¥58,454 vs ¥23,398), and physician visits (¥100,252 vs ¥60,447), compared with controls.
Discussion
In the present study, respondents with diagnosed depression had worse HRQoL, higher work productivity loss, increased HRU, and higher associated costs, compared with respondents with undiagnosed depression and controls without depression, even after adjusting for confounders. Similarly, all the outcomes measured were significantly affected in the undiagnosed depression group, compared with matched controls.
The results of the current study are in agreement with previous findings that reported low HRQoL in patients with depression.6,7,26,27 The results observed in our study are similar to a cross-sectional survey from China, which showed lower HRQoL for diagnosed or undiagnosed depression than individuals with no depression.13 Additionally, prior self-reported survey studies from Japan showed depression to be associated with low HRQoL in terms of subjective health, subjective mood, relations with friends and family, financial and life satisfaction, and sense of happiness.7,26
Consistent with our results, a prior cross-sectional study by Asami et al10 showed that Japanese workers diagnosed with depression had higher presenteeism, absenteeism, and overall work productivity impairment than those with undiagnosed depression. That study further reported greater overall work productivity impairment among those diagnosed, relative to undiagnosed respondents. The higher impact of depression on presenteeism than absenteeism in the current study is consistent with previous studies in which presenteeism was identified as the primary contributor to work productivity loss.10,28
The current study showed that respondents diagnosed with depression had a higher number of physician visits (2.3 times), hospitalizations (1.7 times), and ER visits (1.4 times) than adults in the undiagnosed group in the past 6 months. Additionally, the respondents with undiagnosed depression had a higher number of physician visits (1.7 times), hospitalizations (2.5 times), and ER visits (2.8 times) than the control group in the past 6 months. These results are consistent with a Chinese study that demonstrated higher HRU among those diagnosed with depression than those with undiagnosed depression, and individuals with undiagnosed depression had higher HRU than those with no depression.13
In the current study, annual per patient direct (¥303,453) and indirect costs (¥824,969) incurred by participants diagnosed with depression were higher than those of respondents with undiagnosed depression. In turn, those in the undiagnosed group incurred higher annual costs than controls. The higher annual direct costs for those with diagnosed depression, relative to those with undiagnosed depression, were mainly driven by physician visit costs, which were 2.3-fold higher in the diagnosed group than in the undiagnosed group. Indirect costs may be more consequential than direct costs to the societal burden of depression in Japan. A study by Okumura and Higuchi29 estimated the total annual costs attributed to depression to be approximately $11 billion, with indirect costs accounting for nearly two-thirds (62.7%) of this total. Although the high indirect costs observed in both depression groups could be attributed to absenteeism or presenteeism, the latter seems more likely to be the case, as the Japanese tend to take fewer sick leaves than workers from other countries.12,30,31
Treatment for depression can possibly enhance an individual’s HRQoL and work productivity and decrease health care costs. A meta-analysis of clinical trials among patients with depression reported that the combination of psychotherapy and pharmacotherapy is more efficacious for improving functioning and HRQoL, compared with each treatment alone.32 Additionally, work productivity was significantly improved after short-term antidepressant treatment, along with psychotherapy, and resulted in cost savings of $7,508 per employee per year.33 Ultimately, to ensure that patients can receive and subsequently benefit from treatment, depression screening and diagnosis among adults in the general population will be vital.
Limitations
The present study has a few limitations. Specifically, the survey responses were self-reported by participants and could not be verified independently. However, the survey data were deidentified, and NHWS items were low stakes; hence, respondents had little incentive to provide only socially desirable responses. As this is an observational study using data collected from 2012 to 2014, more recent data will be needed to evaluate the extent to which the burden of undiagnosed depression fluctuates over time. While relevant demographics and health characteristics were controlled through weighting and multivariable models, it is nonetheless possible that the observed pattern of results may be at least partially explained by other variables not included in these analyses. Residual differences in age and CCI reveal the limitations of propensity weighting in terms of precisely balancing the comparison groups when respondents were so strongly differentiated on these measures; additional adjustment was used to control for their influence statistically, but final model results may reflect some residual unadjusted differences across the groups. In addition, due to the correlational nature of the data, causal inferences cannot be made from the study results. For example, it is possible that increased severity among the diagnosed group vs undiagnosed group accounts for the increased burden observed, but it is also possible that diagnosis itself is associated with overall increased HRU among respondents or that residual or unmeasured comorbidities led to increased burden. Longitudinal research could help to evaluate the impact of current diagnosed status on changes in severity and HRU over time in order to better understand the processes underlying these relationships. Because this was a retrospective observational study, any potentially relevant variables not already included in the NHWS could not be assessed. Additionally, the NHWS is designed to be representative of the demographic distribution of the general adult population in Japan, but it is unclear whether the sample sufficiently represents the adult population with depression; as an online survey, NHWS is unlikely to represent institutionalized or very sick respondents, those who do not have access to or familiarity with technology, or those who are unwilling to participate in an online panel. The PHQ-9 is a tool designed to rapidly screen for depression in a clinical or research setting. However, multiple studies have shown that the PHQ-9, with its limited sensitivity in terms of diagnosis, cannot substitute for a trained clinician in diagnosing depression.34–37 Therefore, not all respondents in the undiagnosed depression group would receive a formal diagnosis if assessed in a clinical setting, and some might be suffering from subthreshold depression or other mental health conditions.
Conclusion
The findings of the current study reveal that diagnosed depression is associated with lower HRQoL, greater impairment to work productivity and daily activities, and higher HRU and costs, compared with undiagnosed depression and controls without depression, in Japan. Overall, the study results also highlight the considerable health-related and economic burden of undiagnosed depression, compared with nondepressed controls. The findings emphasize the importance of screening and diagnosis in the general adult Japanese population, which could help to provide appropriate and early treatment in these at-risk individuals, thereby minimizing this burden.
Abbreviations
CCI, Charlson Comorbidity Index; ER, emergency room; GLMs, generalized linear models; HRQoL, health-related quality of life; HRU, health care resource utilization; MCS, Mental Component Summary; NHWS, National Health and Wellness Survey; PCS, Physical Component Summary; PHQ-9, 9-item Patient Health Questionnaire; SF-36v2, Medical Outcomes Study Short Form 36-Item Health Survey Version 2; SF-6D, Short Form 6-Dimensions; WPAI-GH, Work Productivity and Activity Impairment-General Health questionnaire.
Acknowledgments
The authors acknowledge Uma Dasam and Ramu Periyasamy, PhD, Indegene Pvt Ltd., for assistance with literature review and writing, as well as Martine C Maculaitis, PhD, for editing assistance on behalf of Kantar Health. This study was funded by Takeda Pharmaceutical Company Limited.
Author contributions
Kaoru Yamabe contributed to the study design, data analysis, interpretation, and manuscript development. Ryan Liebert contributed to the study design, data analysis, interpretation, and manuscript development. Natalia Flores contributed to the study design, data analysis, interpretation, and manuscript development. Chris L Pashos contributed to the data analysis, interpretation, and manuscript development. All authors contributed to data analysis, drafting and revising the article, gave final approval of the version to be published, and agree to be accountable for all aspects of the work.
Disclosure
Kaoru Yamabe is an employee of Takeda Pharmaceutical Company Limited. Ryan Liebert and Natalia Flores, at the time of this study, were employees of Kantar Health, a paid consultant for Takeda Pharmaceutical Company Limited. Chris L Pashos, at the time of this study, was an employee of Takeda Pharmaceuticals International, Inc. The authors report no other conflicts in interest in this work.
References
National Research Council (US) and Institute of Medicine (US) Committee on Depression, Parenting Practices, and the Healthy Development of Children. In: England MJ, Sim LJ, editors. Depression in Parents, Parenting, and Children: Opportunities to Improve Identification, Treatment, and Prevention. Washington (DC): National Academies Press (US); 2009. | ||
World Health Organization [homepage on the Internet]. Depression Fact Sheet [updated 2017]. Available from: http://www.who.int/mediacentre/factsheets/fs369/en/. Accessed August 3, 2017. | ||
Vos T, Abajobir AA, Abate KH, GBD 2016 Disease and Injury Incidence and Prevalence Collaborators. Global, regional, and national incidence, prevalence, and years lived with disability for 328 diseases and injuries for 195 countries, 1990-2016: a systematic analysis for the Global Burden of Disease Study 2016. Lancet. 2017;390(10100):1211–1259. | ||
Lépine JP, Briley M. The increasing burden of depression. Neuropsychiatr Dis Treat. 2011;7(Suppl 1):3–7. | ||
Hasche LK, Morrow-Howell N, Proctor EK. Quality of life outcomes for depressed and nondepressed older adults in community long-term care. Am J Geriatr Psychiatry. 2010;18(6):544–553. | ||
Dibonaventura MD, Wagner JS, Alvir J, Whiteley J. Depression, quality of life, work productivity, resource use, and costs among women experiencing menopause and hot flashes: a cross-sectional study. Prim Care Companion CNS Disord. 2012;14(6). | ||
Otsuka K, Mitsutake G, Yano S. Dépression, quality of life, and lifestyle: Chronoecological health watch in a community. Biomed Pharmacother. 2002;56(Suppl 2):231s–242s. | ||
Donohue JM, Pincus HA. Reducing the societal burden of depression: a review of economic costs, quality of care and effects of treatment. Pharmacoeconomics. 2007;25(1):7–24. | ||
Jain G, Roy A, Harikrishnan V, Yu S, Dabbous O, Lawrence C. Patient-reported depression severity measured by the PHQ-9 and impact on work productivity: results from a survey of full-time employees in the United States. J Occup Environ Med. 2013;55(3):252–258. | ||
Asami Y, Goren A, Okumura Y. Work productivity loss with depression, diagnosed and undiagnosed, among workers in an Internet-based survey conducted in Japan. J Occup Environ Med. 2015;57(1):105–110. | ||
Bock JO, Luppa M, Brettschneider C, et al. Impact of depression on health care utilization and costs among multimorbid patients--from the MultiCare Cohort Study. PLoS One. 2014;9(3):e91973. | ||
Evans-Lacko S, Knapp M. Global patterns of workplace productivity for people with depression: absenteeism and presenteeism costs across eight diverse countries. Soc Psychiatry Psychiatr Epidemiol. 2016;51(11):1525–1537. | ||
Gupta S, Goren A, Dong P, Liu D. Prevalence, awareness, and burden of major depressive disorder in urban China. Expert Rev Pharmacoecon Outcomes Res. 2016;16(3):393–407. | ||
Muramatsu K, Miyaoka H, Kamijima K, et al. The patient health questionnaire, Japanese version: validity according to the mini-international neuropsychiatric interview-plus. Psychol Rep. 2007;101(3 Pt 1):952–960. | ||
Inagaki M, Ohtsuki T, Yonemoto N, et al. Validity of the Patient Health Questionnaire (PHQ)-9 and PHQ-2 in general internal medicine primary care at a Japanese rural hospital: a cross-sectional study. Gen Hosp Psychiatry. 2013;35(6):592–597. | ||
WHO Expert Consultation. Appropriate body-mass index for Asian populations and its implications for policy and intervention strategies. Lancet. 2004;363(9403):157–163. | ||
Charlson ME, Pompei P, Ales KL, Mackenzie CR. A new method of classifying prognostic comorbidity in longitudinal studies: development and validation. J Chronic Dis. 1987;40(5):373–383. | ||
Maruish ME. User’s Manual for the SF36v2 Health Survey. 3rd ed. Lincoln: Quality Metric Incorporated; 2011. | ||
Brazier J, Roberts J, Deverill M. The estimation of a preference-based measure of health from the SF-36. J Health Econ. 2002;21(2):271–292. | ||
Reilly MC, Zbrozek AS, Dukes EM. The validity and reproducibility of a work productivity and activity impairment instrument. Pharmacoeconomics. 1993;4(5):353–365. | ||
Mhlw.go.jp [homepage on the Internet]. Tokyo: Basic Survey on Wage Structure. Ministry of Health Labour and Welfare of Japan; 2011. Available from: http://www.mhlw.go.jp/toukei_hakusho/toukei/. Accessed August 3, 2017. | ||
Ministry of Healh Law. 2013 Fiscal Year Trends of Medical Expenses. Tokyo, Japan: Ministry of Health, Labour and Welfare; 2014. | ||
Oecd-ilibrary.org [homepage on the Internet]. Paris: Average length of stay in hospitals. Health at a glance 2011. OECD Indicators, OECD publishing; 2011. Available from: http://dx.doi.org/10.1787/health_glance-2011-33-en. Accessed August 3, 2017. | ||
Ridgeway G, McCaffrey D, Morral A, Burgette L, Griffin BA. Toolkit for Weighting and Analysis of Nonequivalent Groups: A Tutorial for the Twang Package. Santa Monica (CA): RAND corporation; 2017. | ||
Mccaffrey DF, Griffin BA, Almirall D, Slaughter ME, Ramchand R, Burgette LF. A tutorial on propensity score estimation for multiple treatments using generalized boosted models. Stat Med. 2013;32(19):3388–3414. | ||
Imai H, Chen WL, Fukutomi E, et al. Depression and subjective economy among elderly people in Asian communities: Japan, Taiwan, and Korea. Arch Gerontol Geriatr. 2015;60(2):322–327. | ||
Tsuji T, Matsudaira K, Sato H, Vietri J. The impact of depression among chronic low back pain patients in Japan. BMC Musculoskelet Disord. 2016;17(1):447. | ||
Tsuchiya M, Kawakami N, Ono Y, et al. Impact of mental disorders on work performance in a community sample of workers in Japan: the World Mental Health Japan Survey 2002-2005. Psychiatry Res. 2012;198(1):140–145. | ||
Okumura Y, Higuchi T. Cost of depression among adults in Japan. Prim Care Companion CNS Disord. 2011;13(3):e1–e9. | ||
Addae HM, Johns G, Boies K. The legitimacy of absenteeism from work: a nine nation exploratory study. Emerald. 2017;20(3):402–428. | ||
Matsudaira K, Palmer KT, Reading I, Hirai M, Yoshimura N, Coggon D. Prevalence and correlates of regional pain and associated disability in Japanese workers. Occup Environ Med. 2011;68(3):191–196. | ||
Kamenov K, Twomey C, Cabello M, Prina AM, Ayuso-Mateos JL. The efficacy of psychotherapy, pharmacotherapy and their combination on functioning and quality of life in depression: a meta-analysis. Psychol Med. 2017;47(7):1337. | ||
Woo JM, Kim W, Hwang TY, et al. Impact of depression on work productivity and its improvement after outpatient treatment with antidepressants. Value Health. 2011;14(4):475–482. | ||
Wittkampf K, van Ravesteijn H, Baas K, et al. The accuracy of Patient Health Questionnaire-9 in detecting depression and measuring depression severity in high-risk groups in primary care. Gen Hosp Psychiatry. 2009;31(5):451–459. | ||
Arroll B, Goodyear-Smith F, Crengle S, et al. Validation of PHQ-2 and PHQ-9 to screen for major depression in the primary care population. Ann Fam Med. 2010;8(4):348–353. | ||
Lamers F, Jonkers CC, Bosma H, Penninx BW, Knottnerus JA, van Eijk JT. Summed score of the Patient Health Questionnaire-9 was a reliable and valid method for depression screening in chronically ill elderly patients. J Clin Epidemiol. 2008;61(7):679–687. | ||
Reynolds WM. The PHQ-9 works well as a screening but not diagnostic instrument for depressive disorder. Evid Based Ment Health. 2010;13(3):96. |
 © 2019 The Author(s). This work is published and licensed by Dove Medical Press Limited. The full terms of this license are available at https://www.dovepress.com/terms.php and incorporate the Creative Commons Attribution - Non Commercial (unported, v3.0) License.
By accessing the work you hereby accept the Terms. Non-commercial uses of the work are permitted without any further permission from Dove Medical Press Limited, provided the work is properly attributed. For permission for commercial use of this work, please see paragraphs 4.2 and 5 of our Terms.
© 2019 The Author(s). This work is published and licensed by Dove Medical Press Limited. The full terms of this license are available at https://www.dovepress.com/terms.php and incorporate the Creative Commons Attribution - Non Commercial (unported, v3.0) License.
By accessing the work you hereby accept the Terms. Non-commercial uses of the work are permitted without any further permission from Dove Medical Press Limited, provided the work is properly attributed. For permission for commercial use of this work, please see paragraphs 4.2 and 5 of our Terms.