")
Back to Journals » ClinicoEconomics and Outcomes Research » Volume 11
Ninety-day postoperative cost in primary total hip arthroplasty: an economic model comparing surgical approaches
Authors Miller LE , Martinson MS , Gondusky JS, Kamath AF , Boettner F, Bhattacharyya SK
Received 30 November 2018
Accepted for publication 15 January 2019
Published 7 February 2019 Volume 2019:11 Pages 145—149
DOI https://doi.org/10.2147/CEOR.S196545
Checked for plagiarism Yes
Review by Single anonymous peer review
Peer reviewer comments 2
Editor who approved publication: Dr Samer Hamidi
Larry E Miller,1 Melissa S Martinson,2 Joseph S Gondusky,3 Atul F Kamath,4 Friedrich Boettner,5 Samir K Bhattacharyya6
1Miller Scientific Consulting, Inc., Asheville, NC 28803, USA; 2Technomics Research, LLC, Long Lake, MN 55356, USA; 3Department of Orthopaedic Surgery, Jordan-Young Institute, Virginia Beach, VA 23462, USA; 4Department of Orthopedic Surgery, Cleveland Clinic, Cleveland, OH 44195, USA; 5Department of Orthopedic Surgery, Hospital for Special Surgery, New York, NY 10021, USA; 6DePuy Synthes, Raynham, MA 02767, USA
Background: While primary total hip arthroplasty (THA) is a safe and effective procedure, it is unclear whether choice of surgical approach influences health care cost.
Methods: We developed an economic model in which patients receiving THA via the anterior approach (AA) by high volume anterior hip surgeons were compared to a propensity-score matched cohort of primary THA cases performed by high volume surgeons that were identified from Medicare claims (Control). Cost elements included the procedure and hospital stay, postacute care, readmission, and outpatient care through 90 days postoperatively. Costs were derived from Medicare claims and adjusted to account for nationwide payer mix.
Results: Health care costs over 90 days postoperative were $17,763 with AA and $23,969 with Control, a difference of $6,206 (95% CI: $5,210–$7,204) per patient. The cost savings with AA were mainly attributable to lower per-patient costs of the index hospitalization ($13,578 vs $16,017), postacute care ($3,123 vs $6,037), and hospital readmissions ($700 vs $1,584).
Conclusion: The AA for primary THA was found to lower 90-day health care costs when compared to a matched sample of THA cases. These study findings may be used to inform hospitals and health care payers regarding the cost implications associated with selection of different surgical approaches to primary THA.
Keywords: anterior approach, bundle, cost, hip, Medicare, reimbursement, total hip arthroplasty
Introduction
Total hip arthroplasty (THA) is an effective surgical procedure with patients typically reporting clinically important, durable improvement in hip pain, function, and health-related quality of life.1 Yet opportunity exists to reduce health care costs associated with THA. Primary THA is responsible for $15 billion in health care costs annually in the USA,2 and costs are anticipated to increase exponentially over the next decade.3 The increasing economic burden associated with joint arthroplasty has prompted Medicare and private payers to scrutinize the factors that contribute to perioperative costs and to develop new paradigms in reimbursement for the procedure. Episode-based bundled payments have emerged as a way to lower health care costs while preserving or enhancing quality of care, with many models focused on perioperative spending within 90 days of the surgical procedure.
An anterior surgical approach to THA follows a trajectory through the intermuscular and internervous intervals between the sartorius and the tensor fascia latae muscles, and involves no detachment of muscles or tendons. In contrast, posterolateral and direct lateral approaches involve muscle splitting and tendon detachment to gain adequate exposure. Several meta-analyses have reported patient outcomes among different surgical approaches to THA. The anterior approach (AA) in primary THA was associated with shorter hospital stay, less pain, lower narcotic consumption, and better hip function compared to posterolateral4,5 and direct lateral approaches.6 Furthermore, the AA was associated with a lower risk of reoperation, dislocation, and infection, but a higher risk of lateral femoral cutaneous sensory nerve injury compared to the posterolateral approach.7 However, it remains unclear whether differences in patient outcomes attributable to THA surgical approach translate to cost differences to health care systems. The purpose of this study was to compare health care costs of primary THA with the AA vs a matched sample of THA cases over a 90-day follow-up period, a typical episode of care during which hospitals may receive a bundled payment from health care insurers.
Methods
We developed an economic model of payer costs using published data8 derived from the Medicare Standard Analytic File between January 1, 2012 and October 1, 2014. Eligible patients were 65 years or older who underwent THA, identified by Medicare Severity-Adjusted Diagnosis Related Group (MS-DRG) 469 or 470, and primary International Classification of Diseases, Ninth Revision, Clinical Modification procedure code 81.51. The AA group consisted of a subsample of patients receiving primary THA via the AA approach. Patients were identified for inclusion in the AA group by identifying high-volume THA surgeons who exclusively used the AA approach and linking to their records within the Medicare claims database.9 The Control group comprised remaining patients receiving primary THA identified within Medicare claims, which does not provide data on the surgical approach utilized. Using propensity-score matching, the AA and Control groups were matched on important covariates to adjust for baseline group imbalances including demographics (age, sex, and race), comorbid conditions (obesity, diabetes, and Charlson Comorbidity Index), Medicaid eligibility, surgical indication, and year of surgery. Generalized estimating equations were then developed that included these covariates as well as additional variables that were not included in propensity-score matching including surgeon THA volume, hospital resident-to-bed ratio, teaching status, disproportionate share percentage, hospital volume, and number of hospital beds.
We modeled the index hospital stay, which included implant costs and in-hospital complications, and postdischarge health care utilization over 90 days. Postdischarge variables included postacute care (home health care, skilled nursing facility, and inpatient rehabilitation), outpatient care, and readmission. To estimate the national-average costs adjusted for payer mix (ie, proportional costs of Medicare and private payers), private insurer payments were estimated by applying a multiplier to Medicare payments derived by taking the average of the most applicable published private payer-to-Medicare payment ratios – MS-DRG 482 (hip and femur procedure except major joint without major complication or comorbidity) and MS-DRG 469 (major joint replacement or reattachment of lower extremity with major complication or comorbidity). Thus, payer mix-adjusted costs were estimated by applying a private payer-to-Medicare payment multiplier of 1.6810 to procedure/hospital and readmission costs among 35.8% of cases. The proportion of THAs in which private insurers were the primary payer was estimated from the Nationwide Inpatient Sample.11 All health care costs were reported in 2016 US dollars and adjusted based on the Consumer Price Index for Medical Care.12
Base-case results were derived using probabilistic sensitivity analysis (PSA) that examined the effect of combined uncertainty across all variables with Monte Carlo simulation. With PSA, all variables were allowed to vary simultaneously using a probability distribution for each variable. Therefore, traditional deterministic sensitivity analysis in which one variable is varied at a time was unnecessary. The PSA utilized 100,000 simulations in both the AA and Control cohorts whereby patients were followed over 90 days postoperatively. The mean costs used in the PSA were assumed to be normally distributed according to the central limit theorem. Uncertainty in cost differences between AA and Controls was reported graphically using a cumulative cost curve, in which the cost differences between surgical approaches for each of 100,000 simulations were ordered and plotted against the cumulative proportion of simulations.
Results
Among 1,794 propensity-matched patients, baseline characteristics were comparable in the AA (n=897) and Control (n=897) groups, including mean age (72 years per group), proportion of females (59% vs 60%), proportion with diabetes (14% per group), proportion of obese patients (6% per group), and proportion of patients with a Charlson Comorbidity Index score of 0 or 1 (88% per group). Patients were treated by surgeons who performed high annual THA volumes; mean annual THA volume was higher among surgeons treating AA vs Control patients (274±146 vs 172±198). Mean hospital stay was 2.1±1.4 days in the AA group and 3.0±1.6 days in Controls. Utilization of postacute care over 90 days was lower in the AA group – 58% vs 68% for a home health agency, 12% vs 29% for a skilled nursing facility, and 1% vs 6% for inpatient rehabilitation. Ninety-day readmissions were also less frequent in the AA group (5% vs 8%).
Base-case cost values and data sources are shown in Table 1. Per-patient health care costs over 90 days postoperatively were $17,763 with AA and $23,969 with Controls, a savings of $6,206 with AA. When evaluating the individual components comprising the entire episode of care, the cost savings with AA were mainly attributable to costs of the index hospitalization ($2,439 lower), postacute care ($2,914 lower), and hospital readmissions ($884 lower) (Figure 1). Postacute care spending per patient with AA and Controls included home health care ($1,695 vs $2,104), skilled nursing ($1,249 vs $2,964), and inpatient rehabilitation ($179 vs $969). The uncertainty in the difference in total costs by surgical approach is displayed in the cumulative cost curve, with a 95% CI ranging from $5,210 to $7,204 savings per patient with AA (Figure 2).
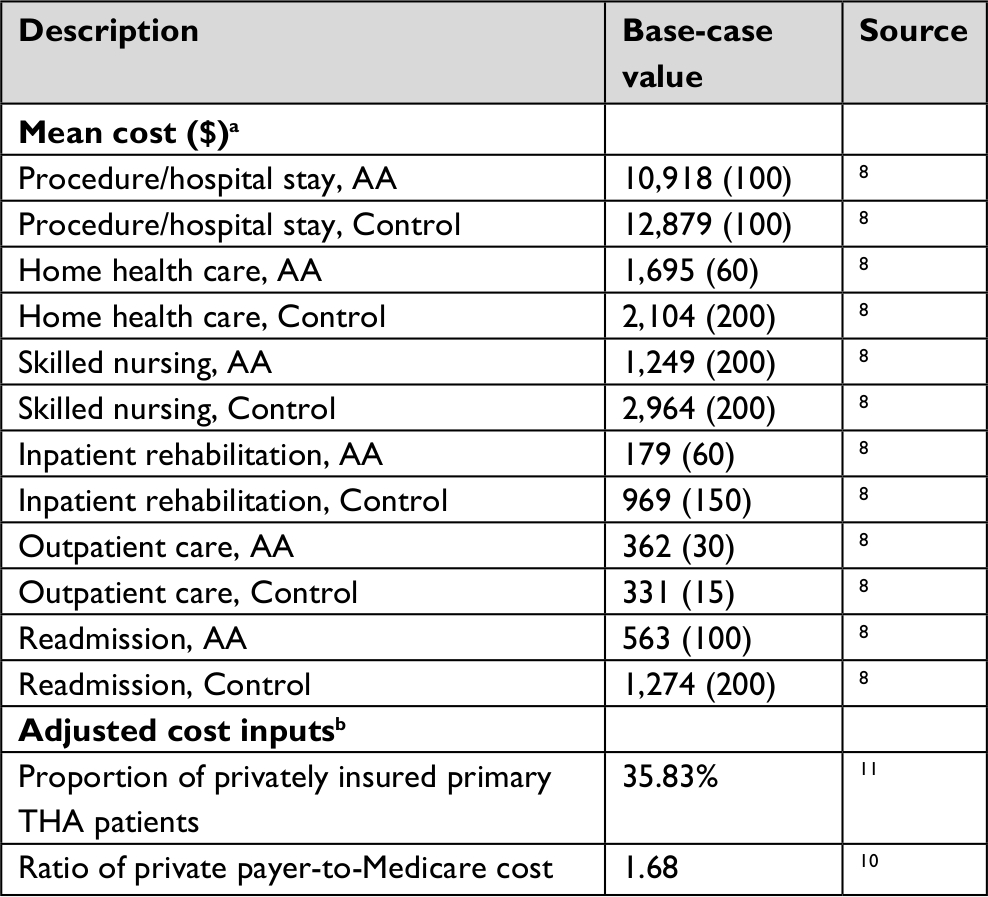 | Table 1 Base-case model inputs Note: aValues are mean (standard error), reported in 2016 US dollars, and adjusted based on the Consumer Price Index for Medical Care; bApplied to costs of procedure/hospital stay and readmissions. Abbreviations: AA, anterior approach; THA, total hip arthroplasty. |
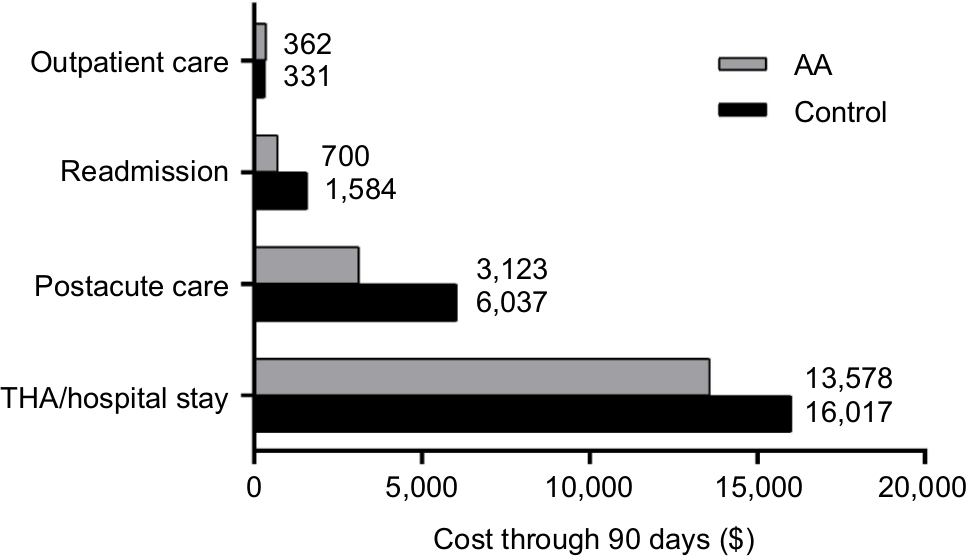 | Figure 1 Determinants of per-patient health care cost through 90 days after primary THA with the AA or a matched sample of primary THA cases in the USA (Control). Abbreviations: AA, anterior approach; THA, total hip arthroplasty. |
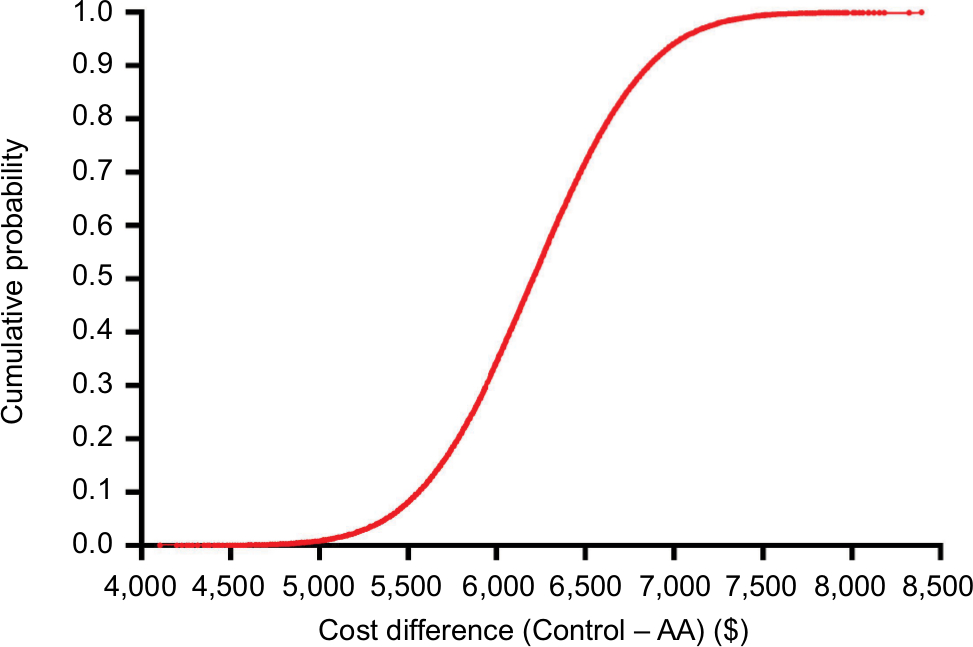 | Figure 2 Cumulative cost curve comparing per-patient costs through 90 days after primary total hip arthroplasty using the AA or a matched sample of primary total hip arthroplasty cases in the USA (Control). Note: Mean health care costs were $6,207 (95% CI: $5,210–$7,204) lower with AA. Abbreviation: AA, anterior approach. |
Discussion
Results of this economic model demonstrate a per-patient savings of approximately $6,200 over a 90-day episode of care when primary THA was performed using the AA compared to a matched sample of THA cases. The AA resulted in cost savings for most variables evaluated in the model, with the majority of savings occurring during the postdischarge period. These results were robust to uncertainties among model parameters with the 95% CI of total savings with AA ranging from approximately $5,200 to $7,200.
Results of the current study as well as others4,8,13,14 suggest that the in-hospital cost savings with the AA are mainly attributable to a shorter hospital stay. A meta-analysis of hospital outcomes comparing AA to a posterolateral approach reported that patients were discharged earlier and reported less pain during their stay.4 This and other studies8,13,14 reported hospital stays that were 0.3–1.3 days shorter with AA. Ultimately, we estimated that approximately $2,400 of the overall cost savings with the AA were realized during the index hospitalization. This estimate is in line with other studies reporting hospital13,14 and payer8 cost savings with AA during the hospital stay ranging from $1,000 to $2,000. It is plausible that fundamental differences in patient characteristics among surgical approaches confounded clinical outcomes and biased results to favor AA in these reports. However, patient characteristics were similar in all of these reports, which lowers the likelihood that patient selection was a major source of bias.
Between hospital discharge and 90 days follow-up, the AA was associated with approximately $3,800 in savings relative to Controls. These savings were realized in two main categories: $2,900 due to lower utilization of postacute care and $900 due to fewer hospital readmissions within 90 days. Over 90 days following THA, the AA has been associated with lower pain severity, lower narcotic usage, and improved hip function compared to a posterolateral approach5 and direct lateral approach,6 which may explain the lower utilization of postacute care in AA patients. While the current study reported only direct costs, the fact that AA is associated with lower narcotic consumption, faster discharge, and higher rates of discharge to home suggests that indirect costs and societal costs may also be impacted by choice of surgical approach. Future studies should quantify and compare these additional cost attributes among different surgical approaches in primary THA.
The economic model reported here was designed to align with the 90-day bundled payment period specified in the Comprehensive Care for Joint Replacement program15 and the Bundled Payments for Care Improvement initiative,16 in which participating hospitals receive a bundled payment for each episode of care, beginning with admission of a patient who is ultimately discharged under MS-DRG 469 or 470 and ending 90 days following hospital discharge. We have shown that the AA in primary THA results in a $6,200 per-patient savings for each episode of care relative to a matched sample of THA cases. Given this average cost saving and assuming 360,000 THAs performed annually in the USA, annual health care savings would be $223 million for every 10% increase in the proportion of AA cases performed.
There are several limitations of this study that warrant further discussion. First, there are inherent limitations to Medicare claims data that warrant cautious data interpretation including the retrospective nature of the analyses and the potential for diagnosis and treatment misclassification. Second, owing to the lack of specificity regarding surgical approach within Medicare claims, the surgical approach used in the Control group was unclear although it could reasonably be assumed that most procedures used the posterolateral approach.17 Third, all AA THA procedures were performed by surgeons who were highly experienced in this procedure (274 per year on average). However, annual THA volume of surgeons treating control group patients suggests that the majority were also high volume surgeons (172 per year on average). Since patient outcomes and costs associated with primary THA may be dependent on surgeon experience, the generalizability of these results to less experienced surgeons is unclear. Finally, it is unknown whether the short-term cost savings attributable to the AA in THA would persist over a longer follow-up period.
Conclusion
Primary THA using the AA translates to cost savings to health care systems compared to a matched sample of THA cases. These study findings may be used to inform various health care stakeholders (providers, patients, payers, policy makers, and health technology assessment bodies) regarding the cost implications associated with selection of different surgical approaches to primary THA in the USA.
Acknowledgment
This work was supported by DePuy Synthes (Raynham, MA, USA).
Disclosure
LE Miller discloses consultancy with DePuy Synthes and Stryker. MS Martinson reports no conflicts of interest. JS Gondusky discloses consultancy and speakers bureau participation with DePuy Synthes and Zimmer Biomet. AF Kamath received royalties from Innomed, discloses speakers bureau participation with DePuy Synthes and Zimmer Biomet, discloses consultancy with DePuy Synthes and Zimmer Biomet, holds stock options with Procter and Gamble, received research support as a Principal Investigator from DePuy Synthes and Zimmer Biomet, and discloses board membership with American Academy of Orthopaedic Surgeons and American Association of Hip and Knee Surgeons. F Boettner received royalties from Ortho Development and Smith & Nephew, discloses speakers bureau participation with DePuy Synthes and Smith & Nephew, and discloses consultancy with Ortho Development, DePuy Synthes, and Smith & Nephew. SK Bhattacharyya discloses employment with DePuy Synthes.
References
Vissers MM, Bussmann JB, Verhaar JA, Arends LR, Furlan AD, Reijman M. Recovery of physical functioning after total hip arthroplasty: systematic review and meta-analysis of the literature. Phys Ther. 2011;91(5):615–629. | ||
Lavernia CJ, Hernandez VH, Rossi MD. Payment analysis of total hip replacement. Curr Opin Orthop. 2007;18(1):23–27. | ||
Kurtz S, Ong K, Lau E, Mowat F, Halpern M. Projections of primary and revision hip and knee arthroplasty in the United States from 2005 to 2030. J Bone Joint Surg Am. 2007;89(4):780–785. | ||
Miller LE, Kamath AF, Boettner F, Bhattacharyya SK. In-hospital outcomes with anterior versus posterior approaches in total hip arthroplasty: meta-analysis of randomized controlled trials. J Pain Res. 2018;11:1327–1334. | ||
Miller LE, Gondusky JS, Bhattacharyya S, Kamath AF, Boettner F, Wright J. Does surgical approach affect outcomes in total hip arthroplasty through 90 days of follow-up? A systematic review with meta-analysis. J Arthroplasty. 2018;33(4):1296–1302. | ||
Yue C, Kang P, Pei F. Comparison of direct anterior and lateral approaches in total hip arthroplasty: a systematic review and meta-analysis (PRISMA). Medicine (Baltimore). 2015;94(50):e2126. | ||
Miller LE, Gondusky JS, Kamath AF, Boettner F, Wright J, Bhattacharyya S. Influence of surgical approach on complication risk in primary total hip arthroplasty. Acta Orthop. 2018;89(3):289–294. | ||
Kamath AF, Chitnis AS, Holy C, et al. Medical resource utilization and costs for total hip arthroplasty: benchmarking an anterior approach technique in the Medicare population. J Med Econ. 2018;21(2):218–224. | ||
Matta JM, Shahrdar C, Ferguson T. Single-incision anterior approach for total hip arthroplasty on an orthopaedic table. Clin Orthop Relat Res. 2005;441:115–124. | ||
America’s Health Insurance Plans. National comparisons of commercial and Medicare fee-for-service payments to hospitals; 2016. Available from: https://www.ahip.org/wp-content/uploads/2016/02/HospitalPriceComparison_2.10.16.pdf. Accessed May 11, 2018. | ||
Agency for Healthcare Research and Quality. HCUP national inpatient sample (NIS). Healthcare Cost and Utilization Project. 2014. Available from: www.hcup-us.ahrq.gov/nisoverview.jsp. Accessed July 10, 2018. | ||
Bureau of Labor Statistics. Consumer price index. 2017. Available from: https://www.bls.gov/cpi/tables/home.htm. Accessed July 25, 2018. | ||
Petis SM, Howard JL, Lanting BA, Marsh JD, Vasarhelyi EM. In-hospital cost analysis of total hip arthroplasty: does surgical approach matter? J Arthroplasty. 2016;31(1):53–58. | ||
Joseph NM, Roberts J, Mulligan MT. Financial impact of total hip arthroplasty: a comparison of anterior versus posterior surgical approaches. Arthroplast Today. 2017;3(1):39–43. | ||
Centers for Medicare and Medicaid Services. Comprehensive care for joint replacement model. 2018. Available from: https://innovation.cms.gov/initiatives/cjr. Accessed September 8, 2018. | ||
Centers for Medicare and Medicaid Services. Bundled Payments for Care Improvement (BPCI) initiative: general information. 2018. Available from: https://innovation.cms.gov/initiatives/bundled-payments/. Accessed October 8, 2018. | ||
Chechik O, Khashan M, Lador R, Salai M, Amar E. Surgical approach and prosthesis fixation in hip arthroplasty world wide. Arch Orthop Trauma Surg. 2013;133(11):1595–1600. |
 © 2019 The Author(s). This work is published and licensed by Dove Medical Press Limited. The full terms of this license are available at https://www.dovepress.com/terms.php and incorporate the Creative Commons Attribution - Non Commercial (unported, v3.0) License.
By accessing the work you hereby accept the Terms. Non-commercial uses of the work are permitted without any further permission from Dove Medical Press Limited, provided the work is properly attributed. For permission for commercial use of this work, please see paragraphs 4.2 and 5 of our Terms.
© 2019 The Author(s). This work is published and licensed by Dove Medical Press Limited. The full terms of this license are available at https://www.dovepress.com/terms.php and incorporate the Creative Commons Attribution - Non Commercial (unported, v3.0) License.
By accessing the work you hereby accept the Terms. Non-commercial uses of the work are permitted without any further permission from Dove Medical Press Limited, provided the work is properly attributed. For permission for commercial use of this work, please see paragraphs 4.2 and 5 of our Terms.