")
Back to Journals » Nature and Science of Sleep » Volume 10
A novel adhesive biosensor system for detecting respiration, cardiac, and limb movement signals during sleep: validation with polysomnography
Authors Jortberg E , Silva I, Bhatkar V, McGinnis RS , Sen-Gupta E , Morey B, Wright Jr JA, Pindado J , Bianchi MT
Received 9 July 2018
Accepted for publication 24 September 2018
Published 26 November 2018 Volume 2018:10 Pages 397—408
DOI https://doi.org/10.2147/NSS.S179588
Checked for plagiarism Yes
Review by Single anonymous peer review
Peer reviewer comments 3
Editor who approved publication: Dr Steven A Shea
Elise Jortberg,1 Ikaro Silva,1 Viprali Bhatkar,1 Ryan S McGinnis,2 Ellora Sen-Gupta,1 Briana Morey,1 John A Wright Jr,1 Jesus Pindado,1 Matt T Bianchi3
1MC10, Inc., Lexington, MA 02421, USA; 2Department of Electrical and Biomedical Engineering, University of Vermont, Burlington, VT 05405, USA; 3Neurology Department, Massachusetts General Hospital, Boston, MA 02114, USA
Background: Although in-lab polysomnography (PSG) remains the gold standard for objective sleep monitoring, the use of at-home sensor systems has gained popularity in recent years. Two categories of monitoring, autonomic and limb movement physiology, are increasingly recognized as critical for sleep disorder phenotyping, yet at-home options remain limited outside of research protocols. The purpose of this study was to validate the BiostampRC® sensor system for respiration, electrocardiography (ECG), and leg electromyography (EMG) against gold standard PSG recordings.
Methods: We report analysis of cardiac and respiratory data from 15 patients and anterior tibialis (AT) data from 19 patients undergoing clinical PSG for any indication who simultaneously wore BiostampRC® sensors on the chest and the bilateral AT muscles. BiostampRC® is a flexible, adhesive, wireless sensor capable of capturing accelerometry, ECG, and EMG. We compared BiostampRC® data and feature extractions with those obtained from PSG.
Results: The heart rate extracted from BiostampRC® ECG showed strong agreement with the PSG (cohort root mean square error of 5 beats per minute). We found the thoracic BiostampRC® respiratory waveform, derived from its accelerometer, accurately calculated the respiratory rate (mean average error of 0.26 and root mean square error of 1.84 breaths per minute). The AT EMG signal supported periodic limb movement detection, with area under the curve of the receiver operating characteristic curve equaling 0.88. Upon completion, 88% of subjects indicated willingness to wear BiostampRC® at home on an exit survey.
Conclusion: The results demonstrate that BiostampRC® is a tolerable and accurate method for capturing respiration, ECG, and AT EMG time series signals during overnight sleep when compared with simultaneous PSG recordings. The signal quality sufficiently supports analytics of clinical relevance. Larger longitudinal in-home studies are required to support the role of BiostampRC® in clinical management of sleep disorders involving the autonomic nervous system and limb movements.
Keywords: electrocardiography, electromyography, respiration, wearable
Introduction
The objective recording of sleep physiology is required for certain sleep disorders such as sleep apnea and periodic limb movement disorder.1 The role of objective testing for other disorders such as insomnia, traditionally diagnosed and managed solely on clinical grounds, is gaining increasing attention.2–4 Beyond the commonly accepted clinical phenotypes, advanced analytics of autonomic function in particular has an extensive evidence basis and shows promise for informing sleep quality and cardiovascular risk.5–7 In parallel with this improved understanding of sleep pathophysiology, advances in at-home technology have facilitated “real-world” assessments that may mitigate certain limitations of in-lab polysomnography (PSG). For example, the first night effect8 is a reminder that in-lab PSG may disrupt the very process of sleep one intends to measure. In addition, at-home sensing allows tracking over time, which is critical for any process that exhibits night-to-night variability, whether stochastic or linked to waking behaviors or exposures that vary over time.9–12 To date, the dominant form of at-home monitoring focuses on uncomplicated obstructive sleep apnea (OSA) detection,13 whereas at-home detection of periodic limb movements of sleep (PLMS) by accelerometry has shown only limited success and is not commonly used in practice.14 Given the proposed links between PLMS and vascular morbidity,15 coupled with the fact that at-home sleep monitors for OSA do not contain leg sensors,16 there is urgent clinical need specifically for PLMS-tracking solutions. In addition, tracking autonomic physiology through the windows of noninvasive cardiac and respiratory physiology may inform various aspects of sleep disturbance of potential clinical relevance,17–20 in addition to tracking electrocardiography (ECG) for arrhythmia. Interestingly, single-channel respiration signals such as thoracic movement can support estimation of the apnea–hypopnea index (AHI),21 which may inform screening or be used to quantify the so-called apnea burden.22 The aim of the current work is to validate BiostampRC®, a small, wireless adhesive sensor system that is worn on the chest for ECG and respiration measurements, or on the leg for anterior tibialis electromyography (EMG) measurements.
Methods
This study was approved by the Partners Institutional Review Board, and all participants provided signed informed consent. Adult patients undergoing PSG in the clinical laboratory for any reason were eligible to participate. PSG recordings were performed in accordance with the American Academy of Sleep Medicine (AASM) in this accredited laboratory, and scored by experienced technologists off-line. The analysis considers N=19 subjects (13 males/6 females) with an average age of age 54±12 years and average body mass index (BMI) of 29.31±4.9. See Table 1 for individual subject descriptors. Standard clinical PSG sensors were applied according to AASM practice standards, including surface electrodes on the left and right anterior tibialis (LAT and RAT, respectively) surface muscle. A BiostampRC® sensor was applied next to each clinical lead on the bilateral legs, and two BiostampRC® sensors were placed on the anterior chest for cardiac and respiration measurements.
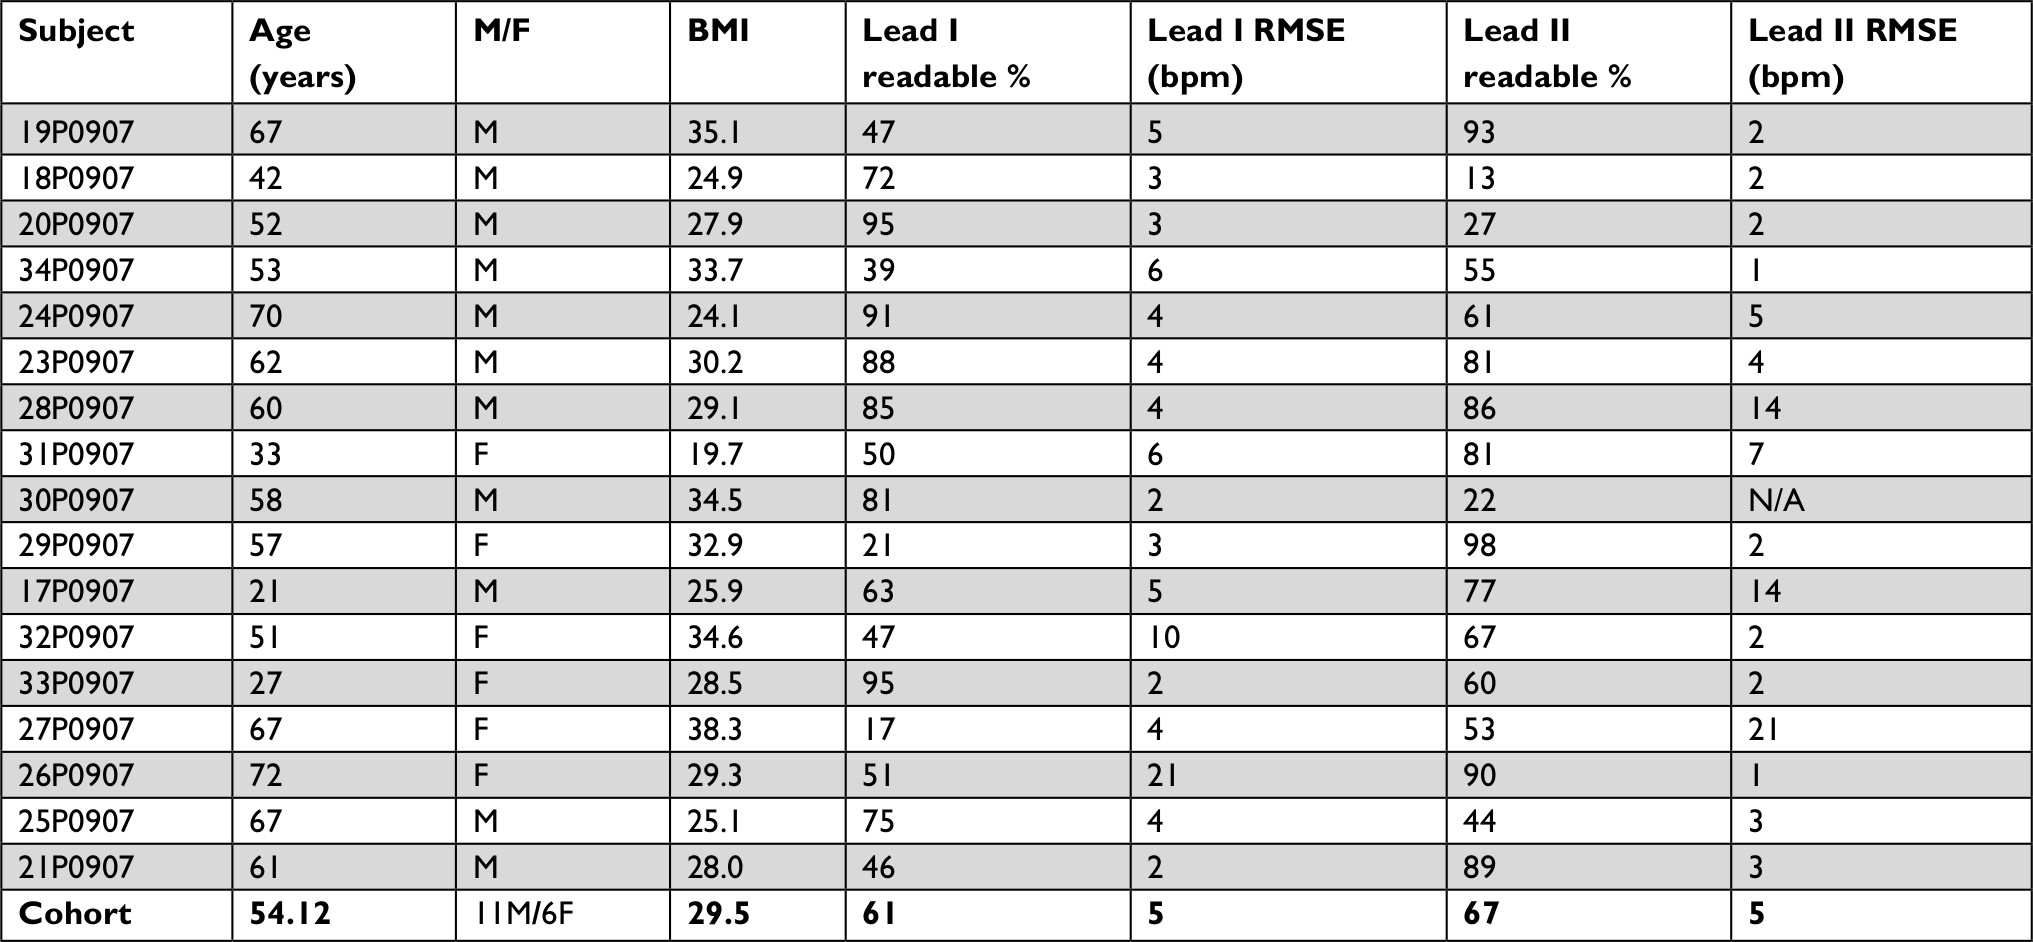 | Table 1 Demographics and ECG analysis across individual subjects Abbreviations: ECG, electrocardiography; M, male; F, female; BMI, body mass index; RMSE, root mean square error; bpm, beats per minute; N/A, not applicable. |
Respiration
The BiostampRC® contains a tri-axial accelerometer that can capture motion. When placed on the chest wall, the motion detected is associated with inhalation and exhalation. For validation, we compare the output of our respiratory rate algorithm on both the BiostampRC® respiratory waveform and the PSG system’s airflow waveform, as performed by Bates et al.23 The BiostampRC® accelerometer-derived respiration (ADR) waveform preprocessing consists of three steps: low-pass filtering (as described in 23), principal component analysis (PCA), and a resonator filter (Figure S1). The low-pass filter removes high-frequency noise while still preserving the shape of the respiratory waveform. A PCA then linearly projects the three axes onto an orthogonal set that maximizes variance. We assume the respiration signal can be spread across multiple spatial axes. We then select the projection identified by PCA as the most variate and augment it as a fourth channel. A respiratory signal quality evaluation then selects the best of the four channels within a given 1-minute epoch. The algorithm assigns a signal quality index to each channel according to the signal power ratio of the waveform against the human respiration frequency band (0.05–0.5 Hz). Both the PSG airflow channel and BiostampRC® respiration channels were assigned a signal quality index value. For the respiration analysis, epochs where the PSG had low signal quality index are not analyzed, even if the BiostampRC® system reported an acceptable signal quality index.
The channel with the best quality provides the input for the resonator filter. In the case where all channel signal quality falls below a preset threshold (0.65), a respiration rate for that epoch is not reported, as the signal is likely corrupted by motion artifacts or other sources of noise.
The resonator filter tunes the signal to its central dominant frequency, selected as the most prominent power spectrum density peak from its Fast Fourier Transform. This filter smooths notches in the respiratory waveform that may bias the respiratory rate state machine. The resonator designs a tight bandpass filter, with dominant gain at the central frequency. The width (kernel) of the filter was empirically determined to be 1.5. The respiration rate state machine, originally described by Bates et al,23 compares this final ADR signal directly against the PSG airflow signal.
The state machine defines high (H), middle (M), and low (L) bands of the sinusoidal respiratory waveform. A scaling factor multiplied by the standard deviation of the epoch’s signal establishes the bounds about the mean of the ADR sinusoid for the high, middle, and low regions. A breath qualifies when the state machine sees that the signal passes through the bands in H–M–L–M–H order (or a permutation of that order). The algorithm stores the start and end time of each breath. This gives an instantaneous respiration rate according to each breath. Once all breaths within the minute window have been detected, the algorithm calculates the median of the instantaneous respiration rates from each detected breath. The median value is the reported respiration rate of that epoch. We limited the reporting of PSG and BiostampRC® respiration rates to between 2 and 60 beats per minute (bpm), under the assumption that rates outside of this range were nonphysiological.
Heart rate
The BiostampRC® system contains an analog front-end sensor capable of detecting electrophysiological signals (sampling frequency range between 125 and 1,000 Hz). Study participants wore two BiostampRC® devices on the upper torso to capture ECG activity, the first in a Lead I configuration (horizontal) and the second in a Lead II configuration (right shoulder to left hip direction, 30 degrees from vertical). A beat detection algorithm identifies the R peaks within the QRS complexes of the ECG signal.24 The median R–R interval for each minute determines the epoch’s heart rate (HR) in bpm for that specific lead configuration. The HR calculated from the BiostampRC® ECG signals (Lead I and II) are compared against the gold standard defined by the PSG pulse rate derived from a pulse oximeter worn on the subject’s finger.
The Pan Tompkins beat detection is a widely used and reliable R peak identifier, validated on the MIT/BIH and AHA databases.24 The algorithm consists of four transformations: digital bandpass filter, differentiation, signal rectification, and a moving window integration. The digital bandpass filter consists of both high- and low-pass filters designed to enhance signal components of human ECG frequency bands. The filtered signal undergoes differentiation to find the slope of the QRS complex. The algorithm then intensifies the slope of the frequency–response curve by squaring the differential. Rectification limits the prominence of T waves with high spectral energy and therefore reduces T wave detection as a false positive. Finally, the moving window integration creates a signal which contains both the slope and width parameters per QRS complex. A series of learned thresholds determines beats from this processed signal.
The algorithm determines dual thresholds for detection based on a series of learning phases. Learning Phase I informs the beat detection threshold, adjusting for the signal vs noise spectrum. Learning Phase II uses initial heart beats to initialize the R–R interval average and limit thresholds. If a beat of appropriate slope and width falls within these determined threshold, Pan-Tompkins assigns a pulse for the QRS complex. With each detection, the thresholds adapt to accommodate significant change in the R–R interval. A refractory period of 200 ms after each beat detection ensures a single beat will not be identified multiple times and introduce false positives.
We limited reporting of HR and validation statistics to when the incoming BiostampRC® ECG signal passes two signal quality requirements. The signal quality checks on the raw ECG waveform consist of two indices: a frequency power ratio and a contact quality index (CQI). The frequency power ratio calculates the ratio of power in a selected frequency band against the power of the rest of the spectrum. We consider the main signal frequency band of the QRS energy to be between 10 and 20 Hz.
The frequency power ratio was designed to identify artifacts (ie, 60 Hz interference, and some muscle activities). Another primary source of noise in the ECG signal is due to partial or poor electrode contact on the skin surface. This type of noise overlaps with the ECG frequency spectrum. To evaluate electrode contact, a temporal-based CQI was designed. The ECG signal is first median-filtered to give a cleaner estimate of the ECG signal. The median-filtered signal is subtracted from the original ECG signal resulting in an estimate of the background noise. The CQI equals the ratio of the power of the estimated noise to the power of the estimated ECG signal. During poor contact, the power of the noise will be significantly lower than the power of the median-filtered ECG signal. With good electrode contact, the noise statistics are more Gaussian and the CQI converges to one. To pass, both the frequency ratio and the CQI values have to be greater than the prespecified threshold of 0.5, or else the section of data is marked unreadable. The ANSI/AAMI 60601-2-47 standards outline reporting practices for ECG recordings.25 According to these standards, ECG recordings may be tagged into readable and unreadable sections when the ECG signal is lost to noise. For BiostampRC®, the readable or unreadable designation is done on 5 second, contiguous windows. Validation statistics comparing BiostampRC® to the gold standard PSG system was reported only when the signal quality deems the BiostampRC® ECG readable. The percent of the signal determined to be unreadable is reported in Table 1.
Muscle EMG
BiostampRC® contains an analog front end (sampling frequency of 250 Hz) that can detect electrical signals from muscle activity present during muscle contractions. We aim to systematically compare the PSG and BiostampRC® signals by seeing if the same contractions (as annotated by clinicians on PSG signal) are visible in both data streams. The PSG and BiostampRC® signals were aligned using an instructed activity of leg contractions during clinical biocalibration at the start of the PSG recording. The EMG signals from the LAT and RAT were treated independently. The expert annotation files were analyzed and selected data followed the AASM scoring guidelines. Rarely, annotations of periodic leg movement (PLM) events longer than 10 seconds were noted, and presumed to be erroneous and thus were not included in the analysis. A total of 25.6 hours of data were selected, consisting of selections ranging in duration from 2 to 30 minutes.
The transformation of the BiostampRC’s® EMG signal followed standard practices of EMG analysis.32 The steps are as follows: filtering, rectification, and an envelope function. A bandpass filter cleans each EMG signal’s frequency content to eliminate interference outside of the 1–45 Hz range. A median filter with a small kernel (0.15 seconds) addresses spikes in the voltage signal such as may occur with gross movements. These artifact spikes can be of on the same order of magnitude of contractions (0.01–0.15 mV). In rectification, all amplitudes become positive by taking the absolute value of the filtered signal. Finally, a smoothing operation takes place to estimate the envelope of the rectified signal. Options to find the envelope include low-pass filter, moving average, and root mean square (RMS) calculation. The RMS method maintains signal power better than the moving average and does not have ringing artifacts that can occur in the low-pass filter method.32 RMS was selected for the BiostampRC® envelope calculation.
The PSG and BiostampRC® envelope signals were compared directly on a window-to-window basis (2 seconds) with the PSG data as the gold standard. Because we are performing a sensor-level validation, we focused on correlations in signal fluctuations rather than tech-scoring of PLMS events per se. The contraction positive class was determined when the PSG signal surpassed a threshold and lasted for at least 0.5 seconds. The envelope function caused an average reduction in power of 50% for the PSG signal, so the AASM threshold of 0.008 mV was halved to 0.004 mV above baseline noise for the contraction identifications threshold. To find the optimal BiostampRC® threshold to match the PSG system, the BiostampRC® contraction identification was performed using a grid search over all parameters. The parameters to determine the final threshold included a set mV value added to an estimate of the noise floor. In any given section of region of interest, we assume the signal contains a significant amount of noncontraction samples. A histogram of the considered section shows the range of amplitudes within the signal. The noise floor was then estimated from the low bin values of the histogram.
The quality of the PSG and BiostampRC® signals are dependent on both body physiology and electrode application as the electrodes require good conductance for a clear signal. The variability of each subject’s application requires a personalized set of parameters for signal-to-signal comparison. For this reason, each grid search was calculated individually rather than find a best fit for the cohort.
To minimize edge effects of slight differences in contraction shape, windows containing edges of the contraction are not considered in the final analysis. If either signal in the PLM series did not pass a signal-to-ratio requirement, that data were not considered. For the signal-to-signal analysis, the number of true negatives (TNs) greatly outweighs the number of true positives (TPs), which will impact accuracy calculations due to weighting by the performance in the dominant class. Examples of TN class were randomly chosen to balance the number of TP class events by patient.
Results
Respiration
The subject population consisted of 15 participants who were undergoing clinical PSG evaluation. The mean age was 52, the mean BMI was 28.0, and 10 were male (Table 2).
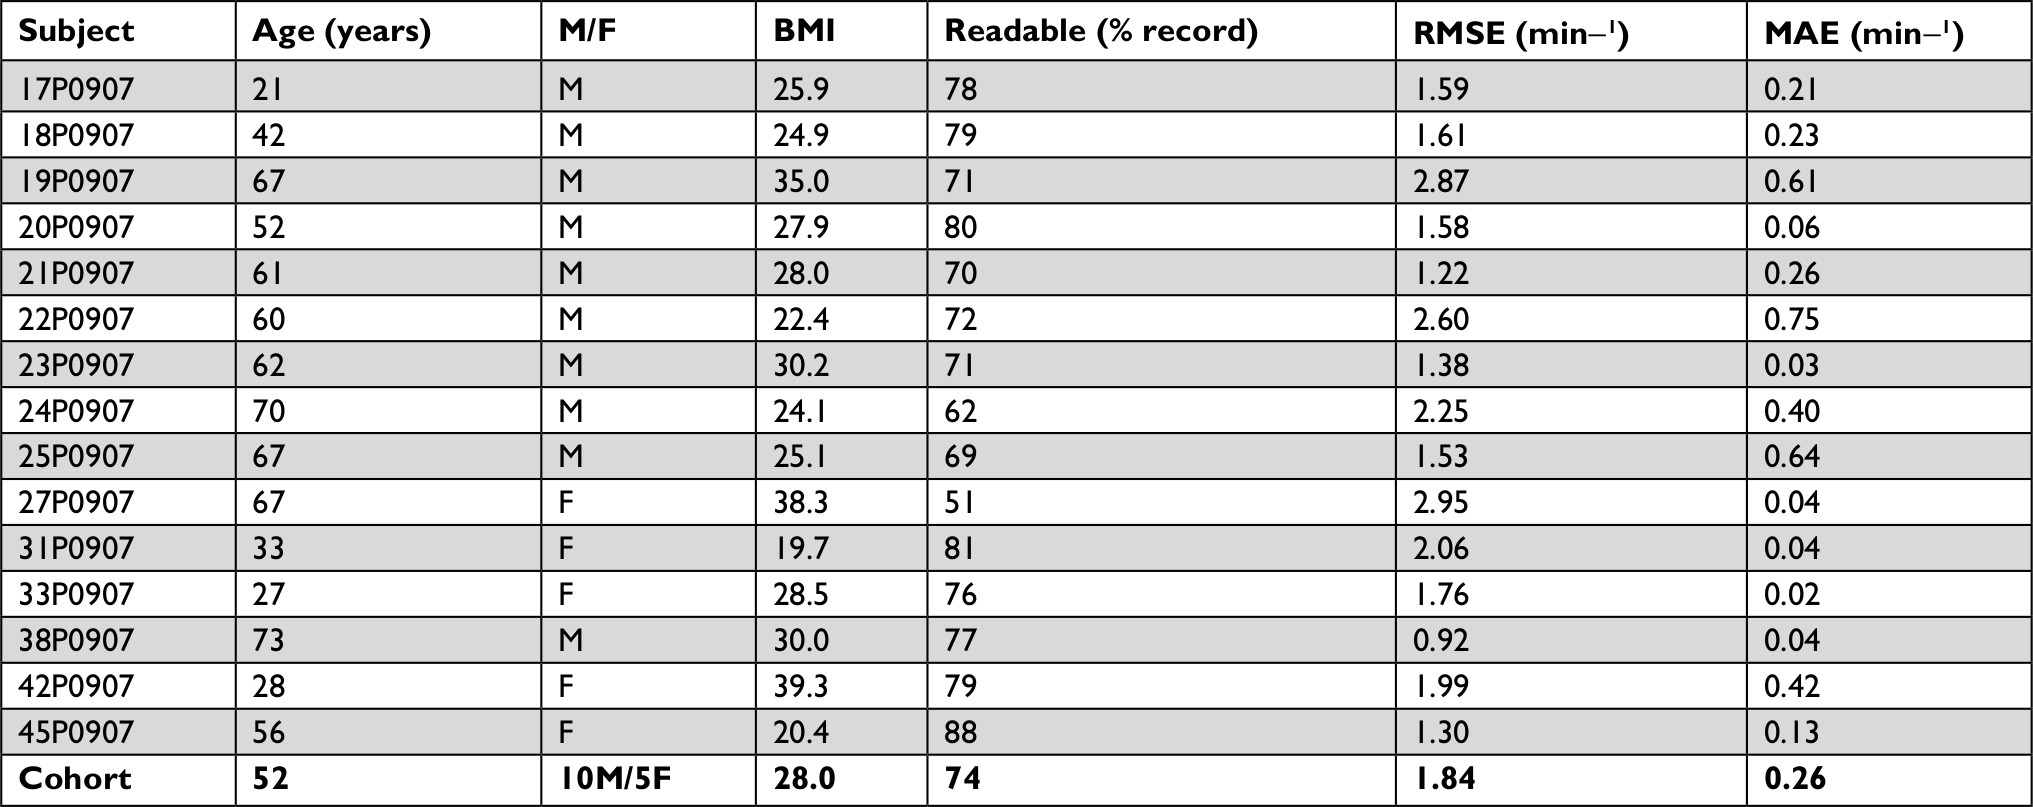 | Table 2 Demographics and respiration analysis across individual subjects Abbreviations: M, male; F, female; BMI, body mass index; RMSE, root mean square error; MAE, mean average error. |
The respiratory rate state machine calculated respiratory rate from the gold standard (PSG) airflow measurement and from the BiostampRC® ADR waveform, epoch by epoch. The respiration detected by the BiostampRC® vs that detected by PSG for an example subject is shown in Figure 1, including a calculated rate (panel A) and superimposed raw waveforms (panel B). We were able to calculate a respiration rate 74% of the time that the gold standard was able to calculate a rate. The root mean square error (RMSE), a common metric for reporting error, was 1.84 breaths/minute in the group. For individual subject results, see Table 2. The mean absolute error across subjects was 0.26 bpm with a cohort relative error of 0.04%.
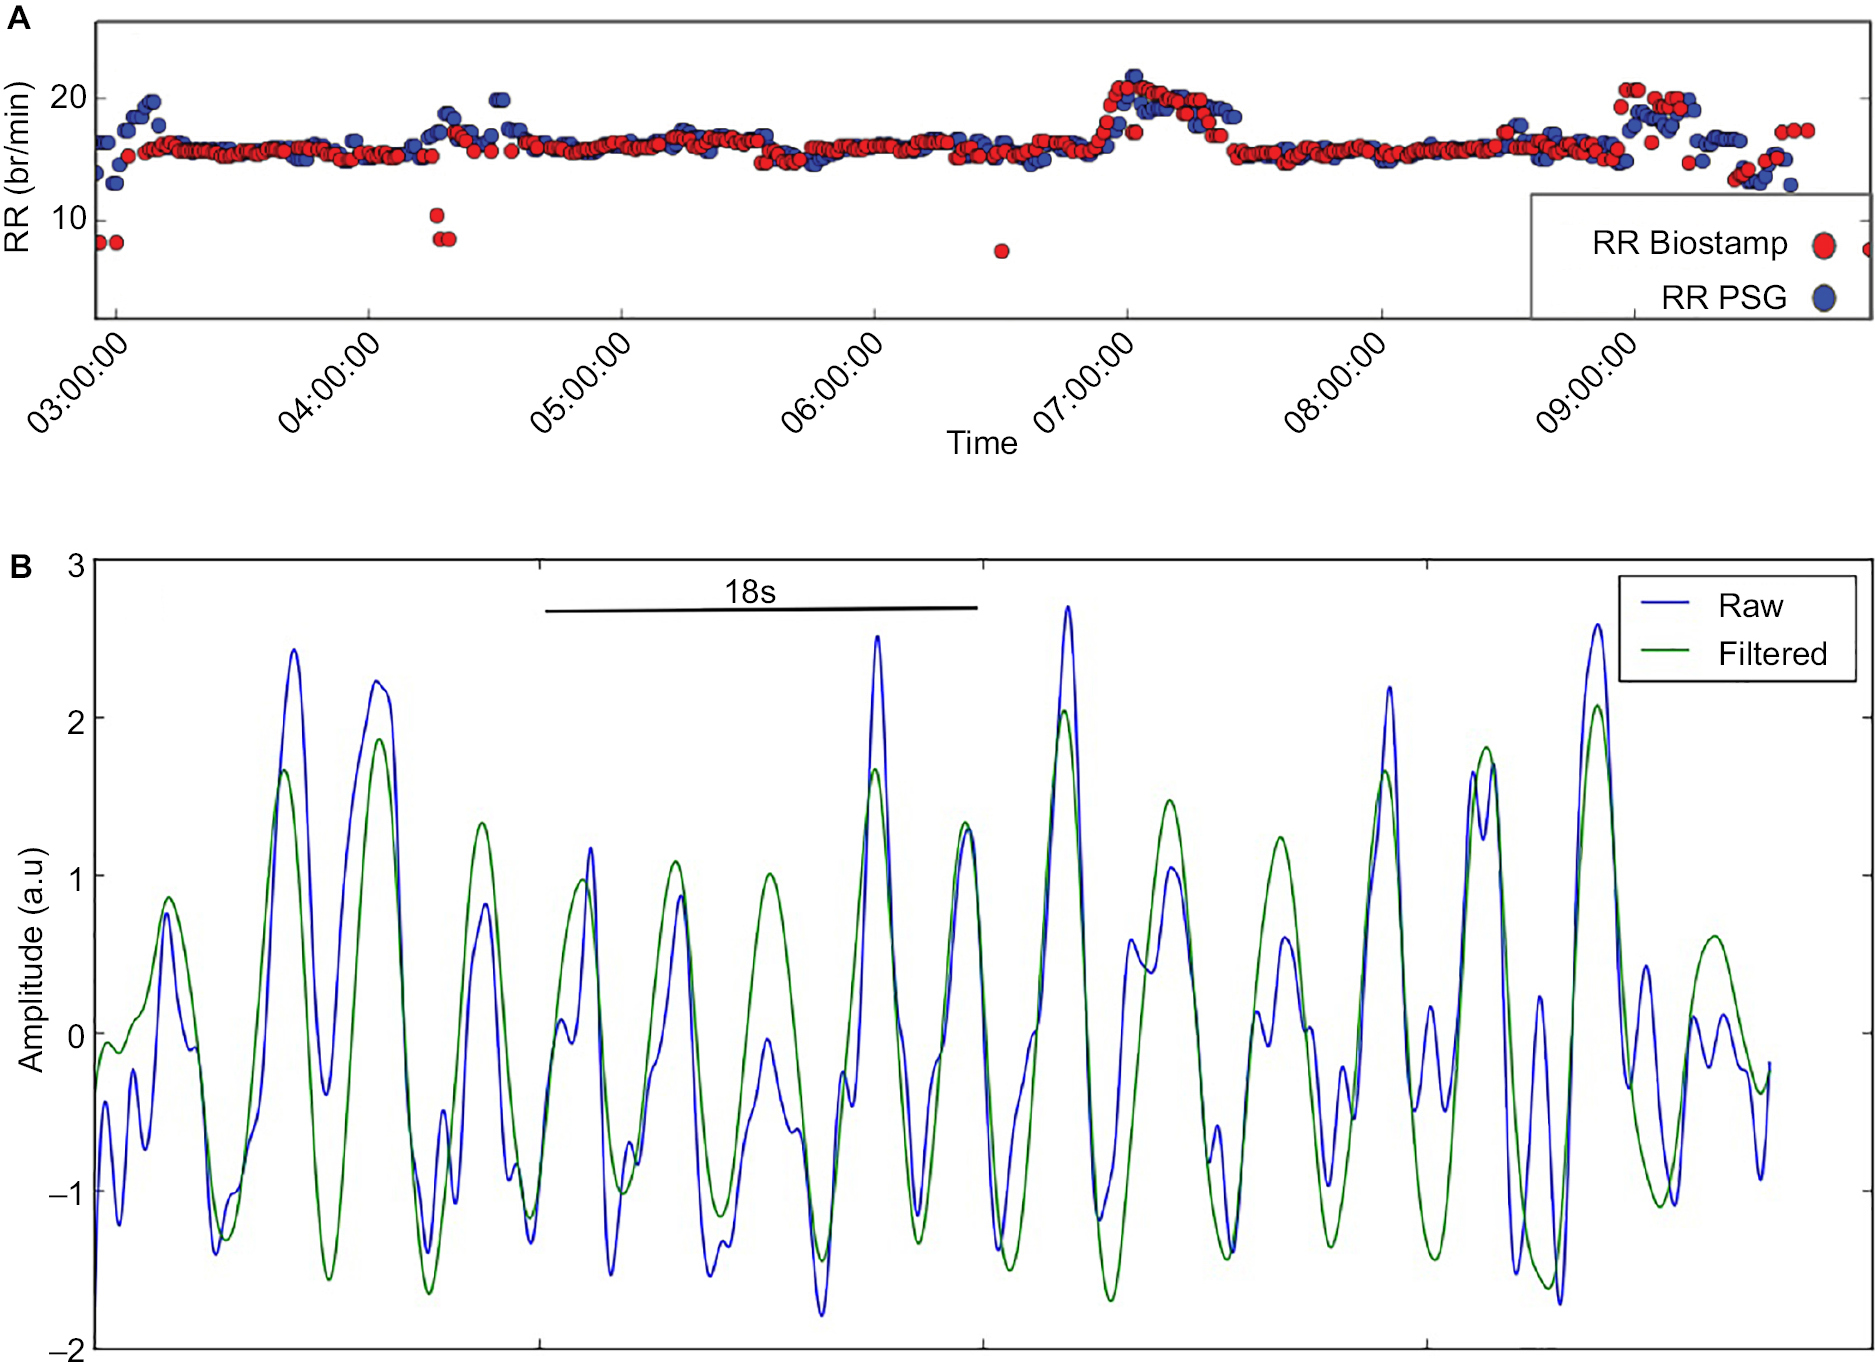 | Figure 1 Respiration measurements. Notes: (A) Overlaid calculations of respiratory rate (RR) from the BiostampRC® system (red dots) and the PSG recording (blue dots) for a full night of recording in the lab. (B) Overlaid raw (blue) and filtered (green) signal of respiration from the BiostampRC®. |
Heart rate
Figure 2 is a representative segment comparing the raw ECG signals of the PSG and BiostampRC® systems. The analysis of HR extracted from the BiostampRC® raw signals, per subject, is reported in Table 1. The HR (in bpm) equals the median value of the instantaneous R–R intervals over 1 minute. This HR is compared with the HR reported by the PSG system from a pulse oximeter. We compared two body locations to evaluate HR: Lead I at the hypochondrium location and Lead II over the upper left chest. Across 17 subjects, the average RMSE for both Lead I and Lead II was 5 bpm. (One subject could not be reported for Lead II due to a low percentage of readable data.)
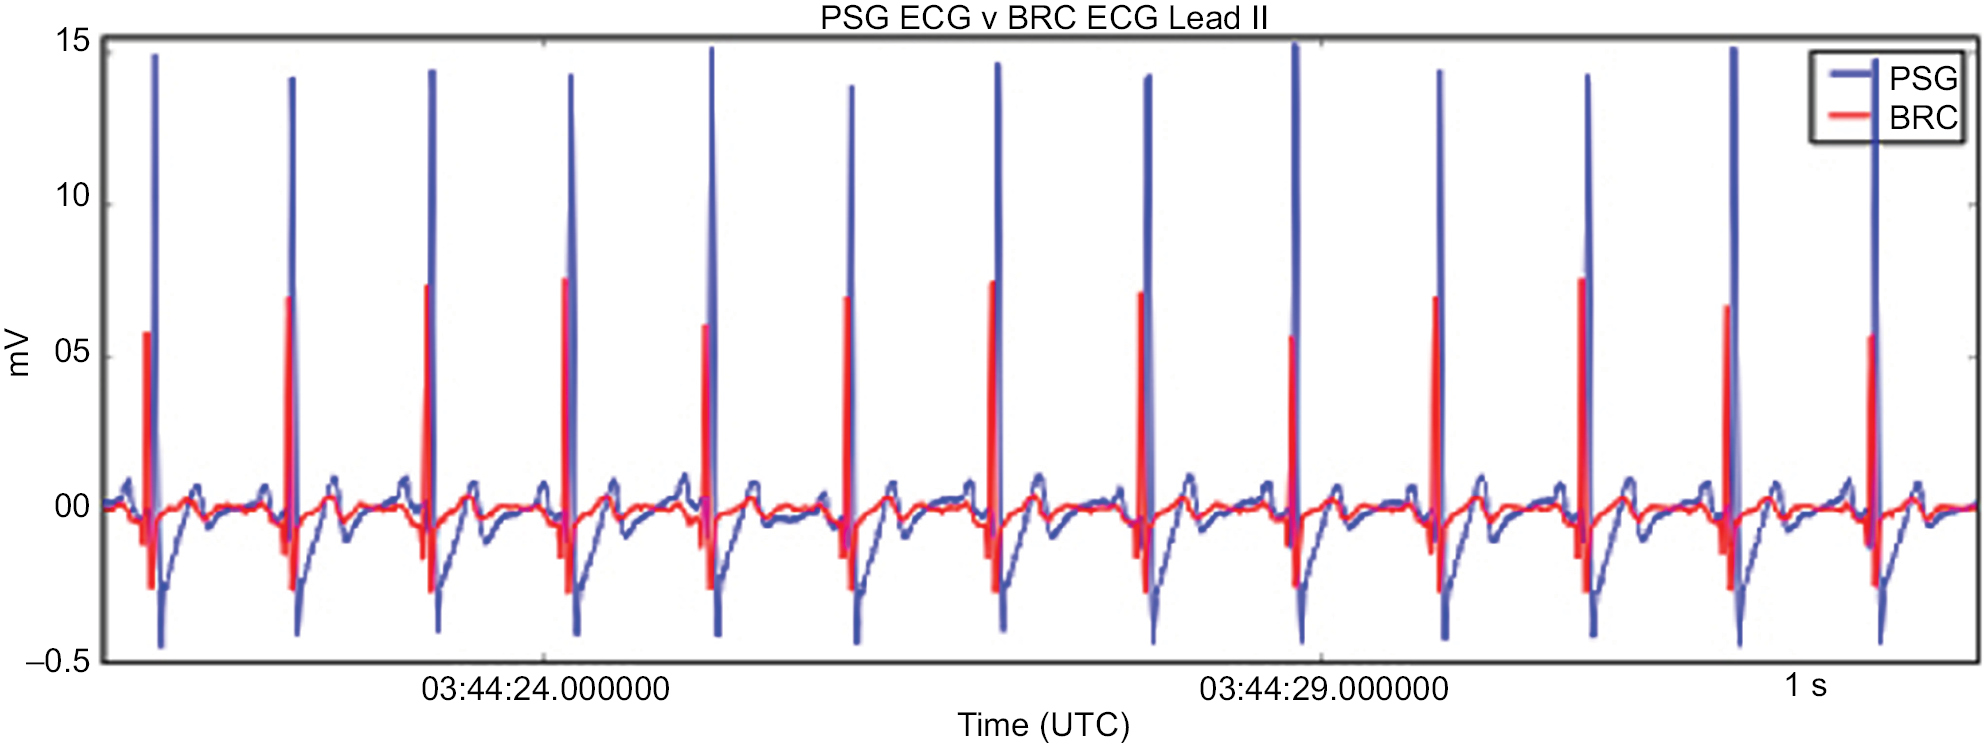 | Figure 2 Electrocardiogram measurements. Notes: Overlaid raw signals from the ECG of the PSG recording (blue) and the ECG measured by the BiostampRC® (red) placed at Lead II position on the chest. |
Leg movements
In the validation study for leg movements, we tested the surface EMG (sEMG) sensor system on the left and right anterior tibialis, adjacent to the gold standard PSG sensors. An image of a BiostampRC® in this position is given in Figure S2. Examples of raw muscle activity signals are shown in Figure S3. We considered the muscle contractions as the primary indicator for comparison of the BiostampRC® and the PSG EMG signals. To determine the threshold for identifying limb movement events, we conducted a parameter tuning over a grid search. The most influential parameter was the adaptive threshold above baseline noise, which was iteratively increased from 0.004 to 0.011 mV. BiostampRC’s® average threshold was 0.0085 mV. Figure 3 shows an example of PSG and BiostampRC® EMG signals, annotated as to true/false positive/negative, based on this threshold approach.
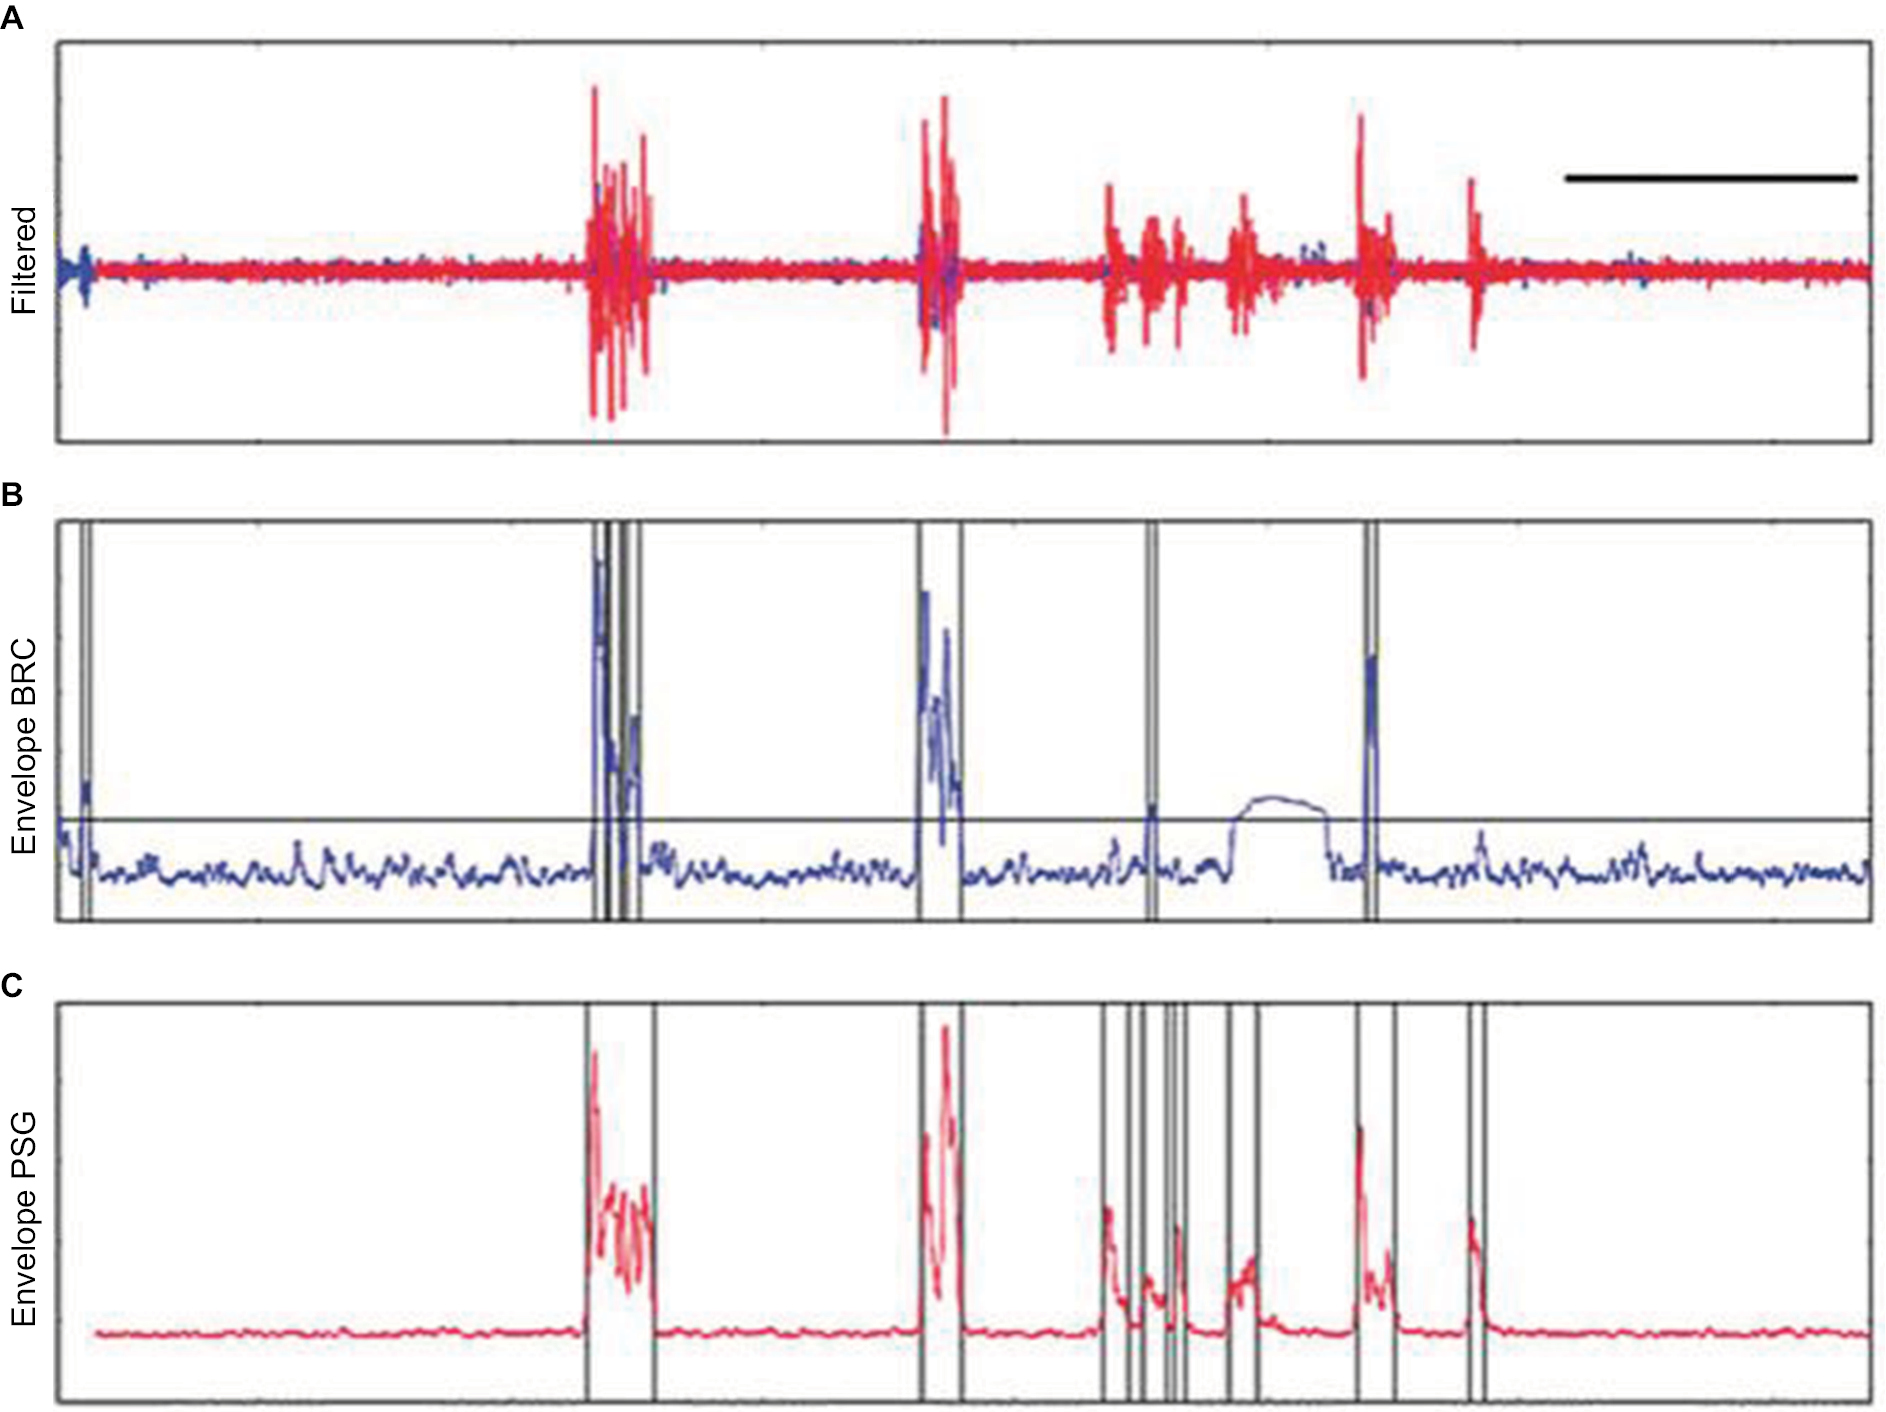 | Figure 3 Limb movement detection example. Notes: The anterior tibialis EMG signals from the BiostampRC® (blue) and PSG system (red) are shown in A. The black bars in B and C represent identified contractions. |
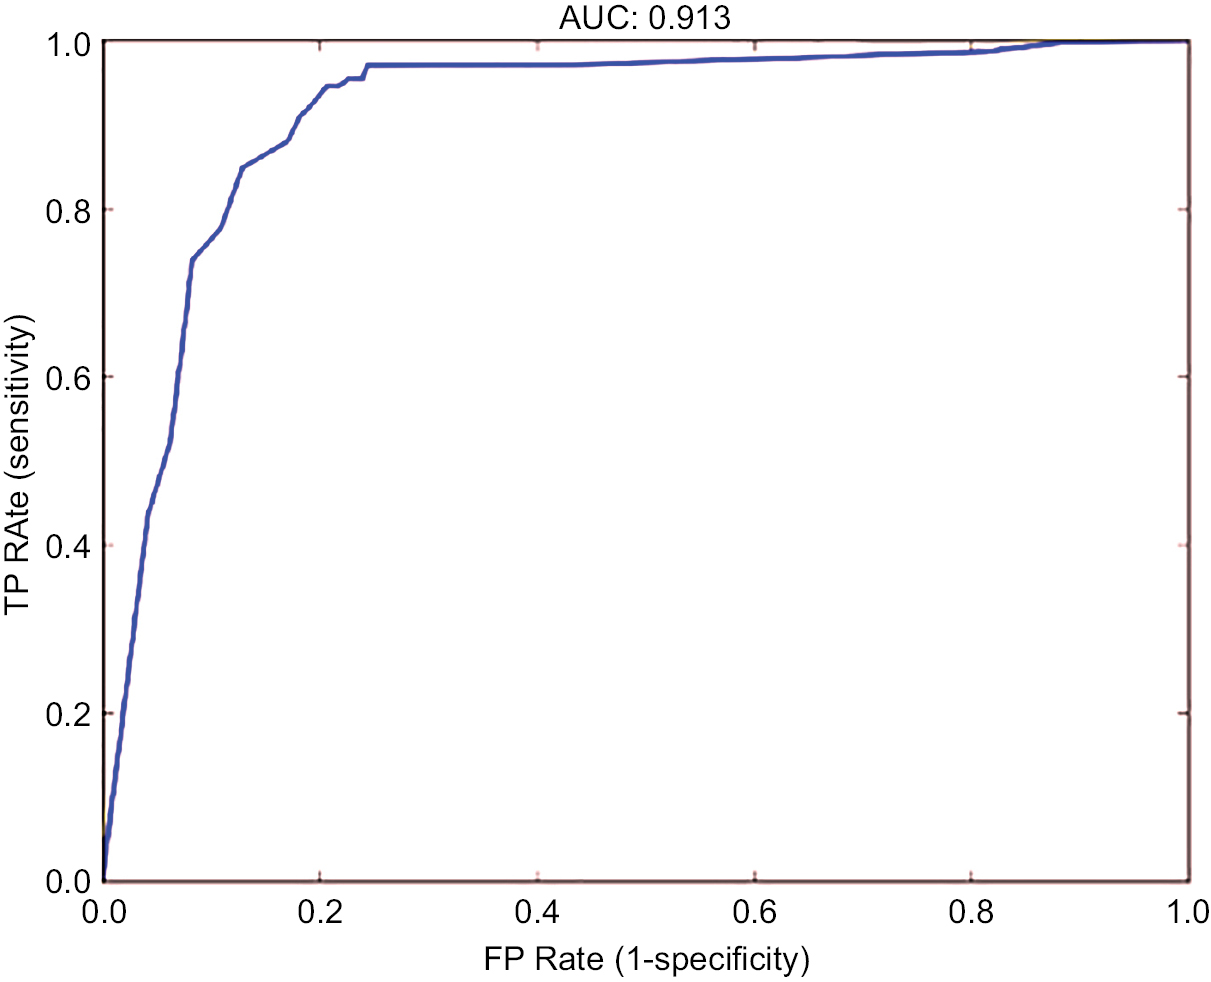
Each parameter configuration provided a sensitivity and specificity, which were then plotted on a patient-specific ROC curve with false positive (FP) rate (1-specificity) on the x-axis and TP rate (sensitivity) on the y-axis (Figure 4). The final configuration chosen per subject was the point with the minimum distance from the [0, 1] point on the ROC curve. The overall resulting area under the curve for the ROC curve was 0.88. At the balance point of the ROC curve, sensitivity equals 0.87 with a specificity of 0.82.
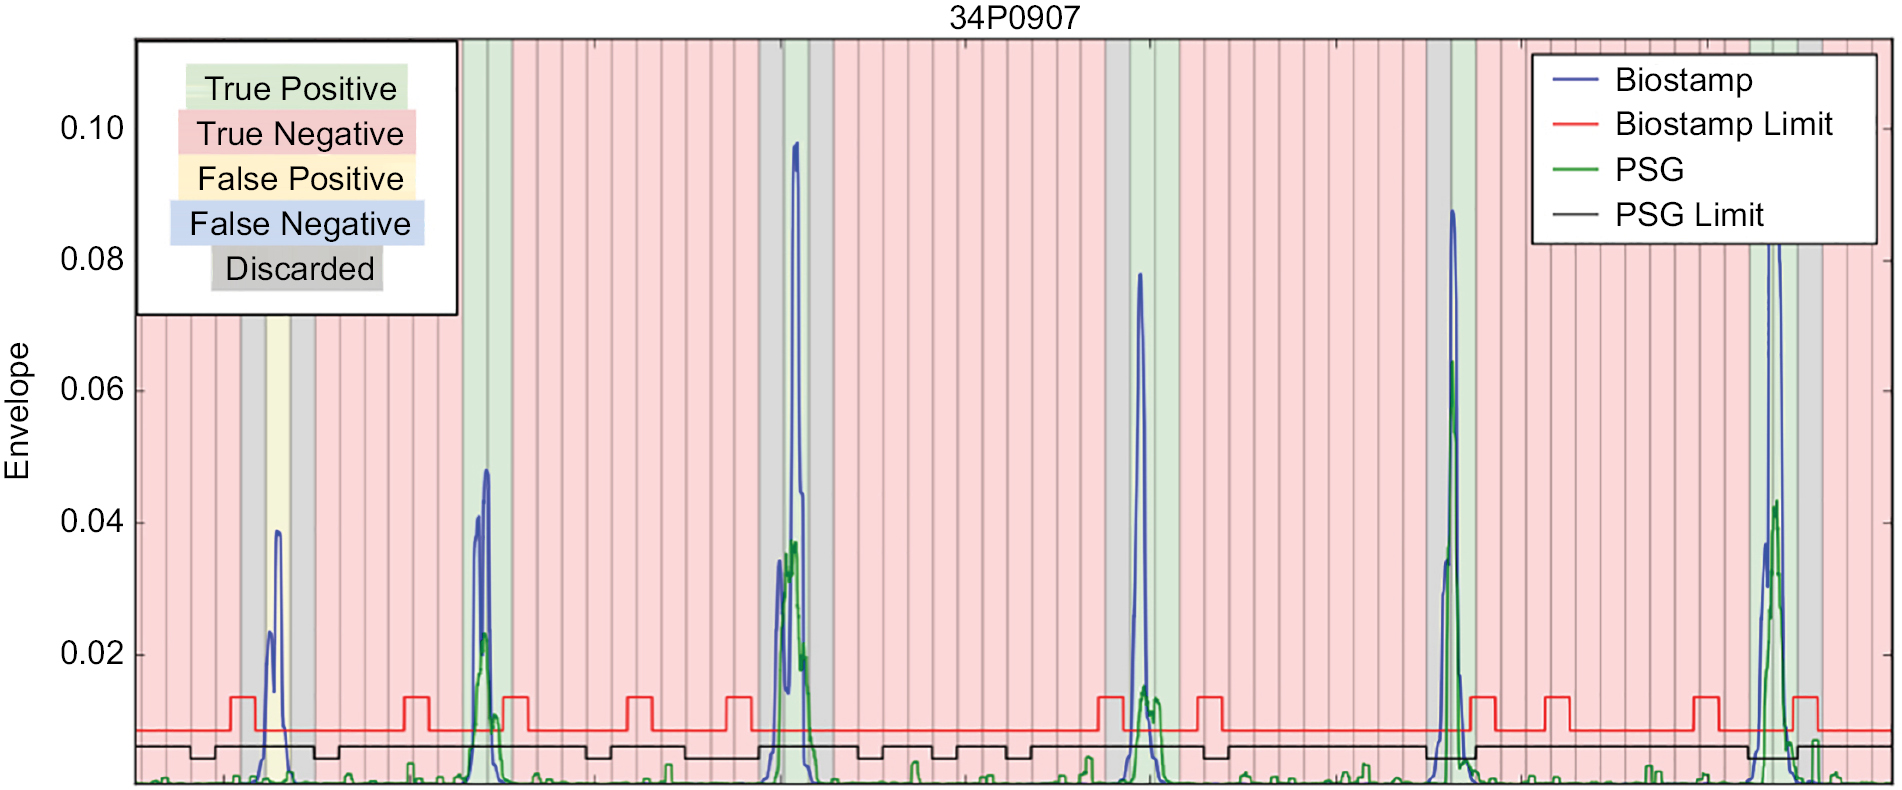 | Figure 4 ROC curve for PLMS detection. Notes: Each vertical bar is 2 seconds duration (the entire segment is just over 2 minutes of recording). The signals are color coded according to the legend in the top left. For example, the first upward deflection of the BiostampRC® (left side of tracing) was not seen by the PSG sensor, and thus is a false positive limb movement detection. The blue and red horizontal lines near the bottom of the plot are the thresholds (“limit” in the legend), relative to baseline noise, used by the algorithm for event detection. There are no false negatives in this image. Edges where signal falls below threshold adjacent to suprathreshold segments are shown for illustrative purposes only, but are not considered in the algorithm (see Methods section). |
Discussion
Although in-lab PSG provides important data for clinical diagnostics, several limitations are well known: uncomfortable environment, high personnel and resource burden, regional variation in access to sleep laboratories, and the use of single-night snapshots for clinical decision-making. Thus, diagnostic testing has seen a transition of monitoring into the home, using limited sensors, mainly to detect OSA.13 However, these kits have their own limitations of comfort, usability, and accuracy—and most are designed for only one or two nights of recording. Because autonomic and EMG signals have use beyond that of OSA detection, the clinical need remains for improved at-home monitoring for clinical sleep evaluation and management.
This validation study demonstrates that the BiostampRC® system provides accurate sensing of HR, RR, and leg EMG, compared with gold standard equivalent sensor data during routine clinical PSG. As such, the system offers the opportunity for a more natural and less invasive approach to multi-night at-home cardiopulmonary monitoring during sleep. In total, 88% of subjects when surveyed upon study completion expressed willingness to wear the BiostampRC® system in the home.
For comparison of respiration rate performance, Bates et al reported RMSE=0.38, with maximum 3 breaths/minute on postoperative patients, in which 45% of the data were useable.23 In a subsequent study, 19 patients (age 53±26 years) who received opioid analgesia were monitored postoperatively.26 The study compared an accelerometry and nasal cannula-derived respiration rate at a 5-minute epoch using the algorithm described in a study.23 Their analysis found 62% of the accelerometer data to be usable for comparison to the nasal cannula as gold standard. They reported an absolute difference of 0.6 breaths per minute and average 87%±8% agreement within 3 breaths per minute on 67%±13% of matched breaths. Overall, the BiostampRC® system is comparable with other ADR rate methods, in terms of accuracy vs gold standard and usable data proportion of recording time. Here, the BiostampRC® and PSG were within an average of 0.26 breaths per minute and at 74% of the PSG total time. The degree of acceptable data loss will depend on the clinical goals of monitoring, with less tolerance in settings of unstable vital signs or alarm-based decision support.
The BiostampRC® system can couple HR and respiration, which have been used in algorithms designed to screen for sleep apnea,27 or to distinguish obstructive and central forms of sleep apnea.28 Future studies of our system in subjects with a range of sleep apnea severity and obstructive vs central phenotypes can test the hypothesis that the sensor data can support such algorithms, especially for at-home monitoring uses. Further studies are necessary to determine whether the system is feasible for respiration rate monitoring around-the-clock in patients warranting inpatient care and real-time information about respiratory status.
It is possible that a single BiostampRC® sensor could provide both cardiac and respiratory information. When placed at the Lead II location, one BiostampRC® sensor may be used to capture both respiratory rate and HR. In this study, respiration rate was derived from the accelerometer at the Lead II location. The ECG signal also includes respiratory information. As a person inhales and exhales, the electrical impedance of the body changes and modulates the QRS complexes. The modulation reflects the breathing pattern of the subject. The electrocardiogram-derived respiration (EDR) signal provides another respiratory estimation. Combining respiration rate measurements from multiple data streams as described in a study29 could improve the robustness of respiration rate estimation.
PLMS is not uncommon, and the main predictor is the presence of restless legs syndrome (RLS; or Willis–Ekbom disease), with most patients with RLS having elevated PLMS if studied using PSG. However, most individuals with elevated PLMS will not have RLS symptoms, and thus the occurrence of PLMS may remain occult unless PSG is performed. Given this clinical uncertainty at the diagnostic phase, there is an urgent need for PLMS-specific sensing that does not require PSG. Beyond the cross-sectional links with vascular morbidity, the link between elevated PLMS and non-refreshing sleep remains poorly understood: patients may remain asymptomatic, or have insomnia, or hypersomnia. The ideal path to diagnose elevated PLMS is unclear, as symptom prediction outside of clinical RLS is quite uncertain.30 Another major challenge in the diagnostic phenotyping of PLMS is night-to-night variability.31 At the management phase, assessing the impact of therapy depends on self-reported sleep symptoms, whether insomnia or hypersomnia or both. However, if therapy targeting PLMS does not improve sleep symptoms, it could be because the treatment did not sufficiently reduce the PLMS, or because the PLMS were not actually causing the symptoms. We cannot distinguish between these alternatives in practice without objective testing, which is not routinely available in the home or via PSG. Thus, a solution is needed that would allow for at-home objective PLMS monitoring, ideally over multiple nights, before and after therapy changes are initiated.
This study demonstrates that a simple adhesive wearable sensor system can detect and store muscle contraction activity with fidelity sufficiently high to support algorithm development relevant for detection and classification of PLMS. Quantifying PLMS is currently limited in practice, where their detection is often incidental during laboratory PSG performed for other reasons such as sleep apnea. Furthermore, given pressures to move objective sleep testing into the home, and the lack of limb leads on at-home kits designed for sleep apnea testing, PLMS measurement will remain limited. Our results suggest that PLMS measurement is feasible with a simple monitoring system. We suspect that EMG-based sensor systems will be more sensitive and specific, as they reproduce the gold standard PSG approach to PLMS, compared with accelerometry-based systems that require gross movement. The growing literature suggesting the importance of PLMS for vascular morbidity and the challenges in clinically predicting elevated PLMS outside of RLS15 are strong incentives to develop objective measurement options to enhance the diagnostic, management, and clinical research efforts in this important area.
Limitations
This study has important limitations, which can be addressed in future work. First, larger studies can identify clinical factors that impact adhesive-based sensors (in the laboratory, or in a portable device), such as body habitus, medications, neurological conditions, and sweat, that could impact ECG, EMG, or even thoracic respiration movement sensing. Second, the sensors were applied by research staff; future work will assess whether unsupervised application in the patient’s home is also feasible and acceptable for patient experience. Third, electrode placement may impact accuracy, given the necessity for adjacent positioning between PSG leads and the BiostampRC®, which may introduce variance in muscle activity detection based on position (not physiology), or variance in ECG or respiration dynamics. Fourth, algorithmic work for auto-detection of sleep apnea or limb movements using an isolated EMG sensor on the leg is subject to clinical scoring conventions that require assessment of other sensors (electroencephalogram for sleep–wake distinction, and respiratory sensors for sleep apnea events). Without concurrent sensors in the home, for example, overestimation of leg movements could occur if sleep apnea were also present, or if protracted wake time with motor restlessness occurs. Training on larger datasets, annotated not just for PLMS but also for non-PLMS motor activity (such as gross body movements during arousals), will be helpful.
Acknowledgments
MC10, Inc. funded this project.
Disclosure
Dr Bianchi has received funding from the Department of Neurology (MGH), Milton Foundation, American Sleep Medicine Foundation, MGHMIT Grand Challenge, and the Center for Integration of Medicine and Innovative Technology; has research contracts with Insomnisolv, Inc.; has consulting agreements with McKesson Health, International Flavors and Fragrances, and Apple Inc.; has received payment for lectures from Oakstone Publishing; has served as a Medical Monitor for Pfizer, Inc; and has provided expert testimony in sleep medicine. These entities had no role in the current study. The authors report no other conflicts of interest in this work.
References
Kushida CA, Littner MR, Morgenthaler T, et al. Practice parameters for the indications for polysomnography and related procedures: an update for 2005. Sleep. 2005;28(4):499–523. | ||
Vgontzas AN, Fernandez-Mendoza J, Liao D, Bixler EO. Insomnia with objective short sleep duration: the most biologically severe phenotype of the disorder. Sleep Med Rev. 2013;17(4):241–254. | ||
Lichstein KL. Insomnia identity. Behav Res Ther. 2017;97:230–241. | ||
Harvey AG, Tang NK. Mis)perception of sleep in insomnia: a puzzle and a resolution. Psychol Bull. 2012;138(1):77–101. | ||
Thomas RJ, Mietus JE, Peng CK, et al. Relationship between delta power and the electrocardiogram-derived cardiopulmonary spectrogram: possible implications for assessing the effectiveness of sleep. Sleep Med. 2014;15(1):125–131. | ||
Bianchi MT, Thomas RJ. Technical advances in the characterization of the complexity of sleep and sleep disorders. Prog Neuropsychopharmacol Biol Psychiatry. 2013;45:277–286. | ||
Tobaldini E, Nobili L, Strada S, Casali KR, Braghiroli A, Montano N. Heart rate variability in normal and pathological sleep. Front Physiol. 2013;4:294. | ||
Agnew HW, Webb WB, Williams RL. The first night effect: an EEG study of sleep. Psychophysiology. 1966;2(3):263–266. | ||
Levendowski D, Steward D, Woodson BT, Olmstead R, Popovic D, Westbrook P. The impact of obstructive sleep apnea variability measured in-lab versus in-home on sample size calculations. Int Arch Med. 2009;2(1):2. | ||
Sforza E, Haba-Rubio J. Night-to-night variability in periodic leg movements in patients with restless legs syndrome. Sleep Med. 2005;6(3):259–267. | ||
Sánchez-Ortuño MM, Edinger JD. Internight sleep variability: its clinical significance and responsiveness to treatment in primary and comorbid insomnia. J Sleep Res. 2012;21(5):527–534. | ||
Suh S, Nowakowski S, Bernert RA, et al. Clinical significance of night-to-night sleep variability in insomnia. Sleep Med. 2012;13(5):469–475. | ||
Kapur VK, Auckley DH, Chowdhuri S, et al. Clinical Practice Guideline for Diagnostic Testing for Adult Obstructive Sleep Apnea: An American Academy of Sleep Medicine Clinical Practice Guideline. J Clin Sleep Med. 2017;13(3):479–504. | ||
Plante DT. Leg actigraphy to quantify periodic limb movements of sleep: a systematic review and meta-analysis. Sleep Med Rev. 2014;18(5):425–434. | ||
Walters AS, Rye DB. Review of the relationship of restless legs syndrome and periodic limb movements in sleep to hypertension, heart disease, and stroke. Sleep. 2009;32(5):589–597. | ||
Collop NA, Tracy SL, Kapur V, et al. Obstructive sleep apnea devices for out-of-center (OOC) testing: technology evaluation. J Clin Sleep Med. 2011;7(5):531–548. | ||
Thomas RJ. Sleep fragmentation and arousals from sleep-time scales, associations, and implications. Clin Neurophysiol. 2006;117(4):707–711. | ||
Sforza E, Pichot V, Barthelemy JC, Haba-Rubio J, Roche F. Cardiovascular variability during periodic leg movements: a spectral analysis approach. Clin Neurophysiol. 2005;116(5):1096–1104. | ||
Sforza E, Nicolas A, Lavigne G, Gosselin A, Petit D, Montplaisir J. EEG and cardiac activation during periodic leg movements in sleep: support for a hierarchy of arousal responses. Neurology. 1999;52(4):786–791. | ||
Citi L, Bianchi MT, Klerman EB, Barbieri R. Instantaneous monitoring of sleep fragmentation by point process heart rate variability and respiratory dynamics. Conference proceedings : Annual International Conference of the IEEE Engineering in Medicine and Biology Society. IEEE Engineering in Medicine and Biology Society. Conference. 2011;2011:7735–7738. | ||
Bianchi MT, Lipoma T, Darling C, Alameddine Y, Westover MB. Automated sleep apnea quantification based on respiratory movement. Int J Med Sci. 2014;11(8):796–802. | ||
Bianchi MT, Alameddine Y, Mojica J. Apnea burden: efficacy versus effectiveness in patients using positive airway pressure. Sleep Med. 2014;15(12):1579–1581. | ||
Bates A, Ling MJ, Mann J, Arvind DK. Respiratory Rate and Flow Waveform Estimation from Tri-axial Accelerometer Data. In: Wearable and Implantable Body Sensor Networks, International Workshop on (BSN), Singapore, Singapore; 2010:144–150. | ||
Pan J, Tompkins WJ. A real-time QRS detection algorithm. IEEE Trans Biomed Eng. 1985;32(3):230–236. | ||
Medical electrical equipment - Part 2-47: Particular requirements for the basic safety and essential performance of ambulatory electrocardiographic systems. Located at: ANSI/AAMI/IEC 60601-2-47/Ed.4. | ||
Drummond GB, Bates A, Mann J, Arvind DK. Validation of a new non-invasive automatic monitor of respiratory rate for postoperative subjects. Br J Anaesth. 2011;107(3):462–469. | ||
Babaeizadeh S, Zhou SH, Pittman SD, White DP. Electrocardiogram-derived respiration in screening of sleep-disordered breathing. J Electrocardiol. 2011;44(6):700–706. | ||
Thomas RJ, Mietus JE, Peng CK, et al. Differentiating obstructive from central and complex sleep apnea using an automated electrocardiogram-based method. Sleep. 2007;30(12):1756–1769. | ||
Nemati S, Malhotra A, Clifford GD. Data Fusion for Improved Respiration Rate Estimation. EURASIP J Adv Signal Process. 2010;2010:926305. | ||
Moro M, Goparaju B, Castillo J, Alameddine Y, Bianchi MT. Periodic limb movements of sleep: empirical and theoretical evidence supporting objective at-home monitoring. Nat Sci Sleep. 2016;8:277–289. | ||
Kobayashi M, Namba K, Ito E, et al. The validity of the PAM-RL device for evaluating periodic limb movements in sleep and an investigation on night-to-night variability of periodic limb movements during sleep in patients with restless legs syndrome or periodic limb movement disorder using this system. Sleep Med. 2014;15(1):138–143. | ||
Konrad P. “The ABC of EMG: a Practical Introduction to Kinesiological Electromyography”. Scottsdale, AZ: Noraxon Inc.; 2014. |
Supplementary materials
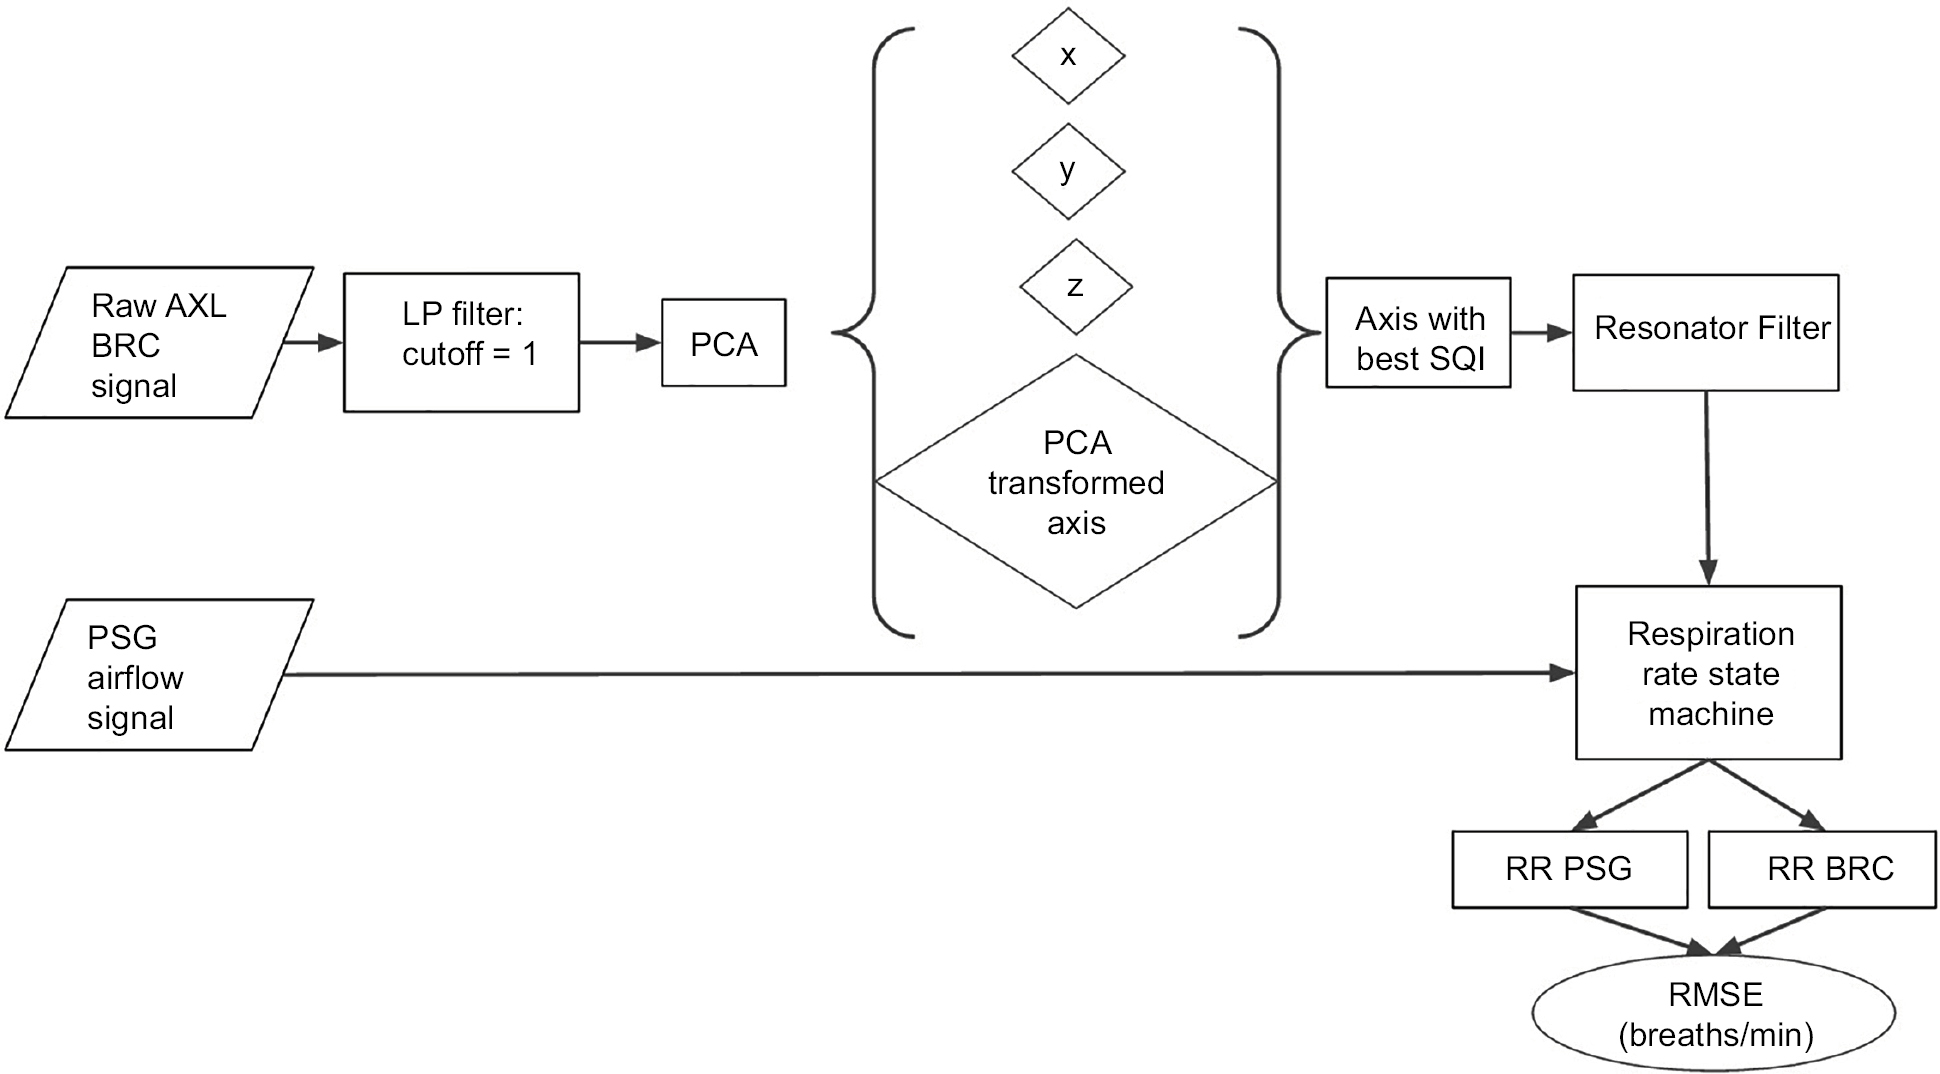 | Figure S1 Schematic of signal processing of respiration signals. Abbreviations: AXL, accelerometer; BRC, BiostampRC® sensor system; LP, low pass; PCA, principle component analysis; RMSE, root mean square error; RR, respiration rate; x, y, z, axes of the accelerometer; SQI, signal quality index. |
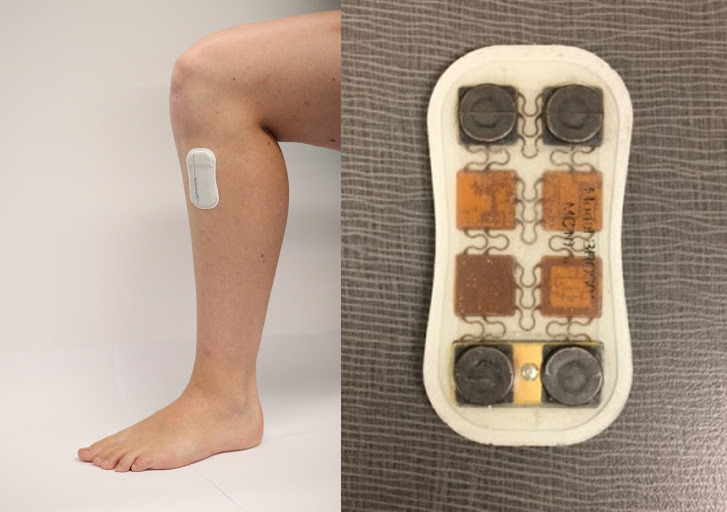 | Figure S2 BiostampRC® device. Note: Left, position on the lower leg; Right, close-up view of one device. |
 | Figure S3 The true positive (TP) rate (ie, sensitivity) is shown on the y-axis, and the FP rate (ie, 1-speciificity) is shown on the x-axis Abbreviations: AUC, area under the curve; EMG, electromyography; PSG, polysomnography; RMS, root mean square; TP, true positive. |
 © 2018 The Author(s). This work is published and licensed by Dove Medical Press Limited. The full terms of this license are available at https://www.dovepress.com/terms.php and incorporate the Creative Commons Attribution - Non Commercial (unported, v3.0) License.
By accessing the work you hereby accept the Terms. Non-commercial uses of the work are permitted without any further permission from Dove Medical Press Limited, provided the work is properly attributed. For permission for commercial use of this work, please see paragraphs 4.2 and 5 of our Terms.
© 2018 The Author(s). This work is published and licensed by Dove Medical Press Limited. The full terms of this license are available at https://www.dovepress.com/terms.php and incorporate the Creative Commons Attribution - Non Commercial (unported, v3.0) License.
By accessing the work you hereby accept the Terms. Non-commercial uses of the work are permitted without any further permission from Dove Medical Press Limited, provided the work is properly attributed. For permission for commercial use of this work, please see paragraphs 4.2 and 5 of our Terms.