")
Back to Journals » Diabetes, Metabolic Syndrome and Obesity » Volume 11
Trace elements and oxidative stress in children with type 1 diabetes mellitus
Authors Alghobashy AA , Alkholy UM , Talat MA, Abdalmonem N, Zaki A, Ahmed IA, Mohamed RH
Received 17 November 2017
Accepted for publication 1 February 2018
Published 26 March 2018 Volume 2018:11 Pages 85—92
DOI https://doi.org/10.2147/DMSO.S157348
Checked for plagiarism Yes
Review by Single anonymous peer review
Peer reviewer comments 2
Editor who approved publication: Professor Ming-Hui Zou
Ashgan Abdalla Alghobashy,1 Usama M Alkholy,1 Mohamed A Talat,1 Nermin Abdalmonem,1 Ahmed Zaki,2 Ihab A Ahmed,1 Randa H Mohamed3
1Department of Pediatrics, Faculty of Medicine, Zagazig University, Zagazig, Egypt; 2Department of Pediatrics, Faculty of Medicine, Mansura University, Mansura, Egypt; 3Department of Biochemistry, Faculty of Medicine, Zagazig University, Zagazig, Egypt
Background: The early imbalances of trace elements in type 1 diabetes (T1D) may cause disturbance of glucose metabolism and more oxidative stress that may enhance the development of insulin resistance and diabetic complications. We aim to evaluate the serum level of selenium (Se), zinc (Zn), magnesium (Mg), and copper (Cu), the degree of oxidative stress and evaluate their relations to glycemic control in children with T1D.
Methods: A case–control study which included 100 diabetic children and 40 healthy children age, sex, and ethnicity-matched as a control group. The diabetic children were divided into poor and good controlled patients according to glycosylated hemoglobin (A1c %). Studied children underwent history taking, clinical examination and laboratory measurement of serum Se, Zn, Mg, and Cu levels, erythrocyte reduced glutathione (GSH) and peroxidase enzyme activity (GPx).
Results: Serum Se, Zn, Mg, Cu, erythrocyte GSH, and GPx were significantly lower in the diabetic group in comparison to the control group (P<0.05) and their levels were lower in poorly controlled patients compared to good controlled patients (P<0.05). The serum Se, Zn, Mg, erythrocyte GSH, and GPx showed a negative correlation with A1c %. The serum Se showed a positive correlation with erythrocyte GSH and GPx ([r=0.56, P<0.001], [r=0.78, P<0.001], respectively).
Conclusion: Children with T1D, especially poorly controlled cases, had low serum Se, Zn, Mg, Cu, GSH, and GPx. Low serum Se in diabetic children may affect the erythrocyte GSH-GPx system.
Keywords: oxidative stress; type 1 diabetes; trace elements, reduced glutathione, peroxidase
Introduction
Diabetes mellitus (DM) is a metabolic disorder of impaired glucose metabolism. Poor glycemic control in type 1 diabetes (T1D) usually leads to more oxidative stress, increased production of oxygen-free radicals and more diabetic complications. The trace elements like selenium (Se), zinc (Zn), and copper (Cu) are involved in the process of lipid peroxidation and play an important role in the pathogenesis and exacerbation of diabetic complications.1 Zn is very important for glucose metabolism and plays a key role in the synthesis, storage, and secretion of insulin.2 Magnesium (Mg) is important for glucose metabolism and its deficiency has been implicated in insulin resistance, carbohydrate intolerance, dyslipidemia and complications of diabetes.3 Se has an antioxidant effect and plays an important role in the protection against oxygen free radicals.4 Se enters in the structure of selenocysteine which is an important part of the structure of several glutathione peroxidases (GSH-GPx) present in different tissues. Reduced glutathione (GSH) is considered as the most important antioxidant that prevents oxidative damage of the cell membrane by free radicals.5 Elevated serum Cu level in diabetic children has been reported before to be associated with macroangiopathy, hypercholesterolemia, and hypertension. However, Cu deficiency might be a contributor to the glucose intolerance in T1D.6 Zn and Cu are considered the most important cofactors for the action of superoxide dismutase antioxidant.7 The aim of our study was to evaluate the serum level of trace elements Mg, Se, Zn, and Cu, assess the degree of oxidative stress and evaluate their relations to glycemic control in children with T1D.
Subjects and methods
This case–control study was conducted at Zagazig Pediatric Endocrinology Outpatient Clinic during the period from March 2016 to December 2016. Subjects were divided into a Diabetic group which included 100 children with T1D who were all confirmed serologically based on autoantibody positivity, and a Control group which included 40 healthy children who were age, sex, and ethnicity-matched and who were not suffering from any chronic illness, not taking any medication and came for mild acute illness to outpatient clinics. Patients with T1D were divided into two groups according to glycosylated hemoglobin (A1c %) into 75 poorly controlled patients with A1c % ≥ 7.5 and 25 good controlled patients with A1c % < 7.5. Written informed consent was obtained from the children’s guardians and approval was provided by the local ethical committee in our Zagazig University Hospital.
The inclusion criteria were for diabetic cases aged 1–18 years, with good nutritional history and were under follow up at the outpatient clinic of the Pediatric Endocrinology Unit, Zagazig University Hospital.
The exclusion criteria were for diabetic children with complications such as retinopathy or nephropathy, with chronic diseases such as renal disorder or Wilson disease, cases with supplemental intake of Se, Zn, Mg, and Cu in the last 6 months and cases who had received total parenteral nutrition or antioxidants in the last month.
All the subjects underwent the following:
- History taking to evaluate age at onset, duration of the disease, type, and dose of insulin and full clinical examination with measurement of height, weight, and BMI.
- Laboratory investigations:
- After overnight fasting, 2 mL venous blood samples were taken from the patients then the serum part was preserved in an Eppendorf tube at –20°C for measurement of serum levels of Se, Zn, Mg, and Cu while the erythrocyte part was washed in isotonic saline, hemolysis was carried out by adding cold distilled water and then centrifuged at 2000× g for 15 minutes to remove any cellular debris. The hemolysate was used for assessment of erythrocyte GSH and GPx levels.
- Serum Zn, Mg, and Cu levels were measured by the direct colorimetric method and serum Se was measured with Electro-Thermal Atomic Absorption Spectrometry.8
- Serum Zn present in the sample is chelated by zincon (2-carboxy-2-hydroxy-5-sulfoformazyl-benzene) in the reagent at alkaline pH. The formation of this complex is measured at a wavelength of 610 nm. Normal value: 0.7–1.1 mmol/L (1.70–2.70 mg/dL).9
- Serum Cu is released from protein by hydrochloric acid. The protein is precipitated by trichloroacetic acid, Di ethyldi thio carbamate forming a golden yellow-colored complex with copper which can be extracted by n-butanol. The formation of this complex is measured at a wavelength of 440 nm. Reference ranges: 12–25 μmol/L.10
- Mg ions react in an alkaline medium with the metallochrome dye calmagite to form a chromophore which absorbs at 520 nm. Calcium is excluded from the reaction by complexing with ethylene glycol bis (β-aminomethyl ether)-N,N,N′,N′-tetracetic acid (EGTA). The formation of this complex is measured at a wavelength of 610 nm. The normal value is 0.7–1.1 mmol/L.11
- Erythrocyte glutathione peroxidase (GPx) activity was measured by commercial Ransel kits (Randox Laboratories, Crumlin, Northern Ireland, UK)12 and erythrocyte reduced glutathione (GSH) levels were measured by the method described by Beutler et al.13
- Measurement of A1c % by Cobas Integra 6000 (Hoffman-LaRoche Ltd., Basel, Switzerland).
- Routine laboratory measurement of fasting plasma glucose (FPG), fasting triglycerides and total cholesterol.
Statistical analysis
Data were checked, entered, and analyzed using SPSS version 20. Data were expressed as number and percentage for qualitative variables and mean ± SD for quantitative ones. The Student’s t-test was used for comparison of means of two independent groups. The Chi-square test was used to find the association between row and column variables. Pearson correlation coefficient was used to calculate the correlation between quantitative variables. The level of significance was considered positive if the P-value <0.05.
Results
Our sample of study included 100 children with T1D with a mean age of 11.6 ± 2.9, 50% males and 50% females and their BMI was 18.5 ± 1.7 compared to 40 healthy children as a control group with a mean age of 11.4 ± 2.8, 45% males and 55% females and their BMI 18.6 ± 0.7. The duration of illness of the diabetic group ranged from 1 to 11 years while the mean age was 4.8 years, the insulin dose ranged from 0.5 to 1.5 unit/kg, 45% of the patients used basal bolus and 45% were on 3 times per day blood glucose monitoring. No significant differences were found between both groups in age, sex, BMI, triglycerides, and total cholesterol. The FPG was statistically significantly higher in diabetic patients when compared to the control group (Table 1).
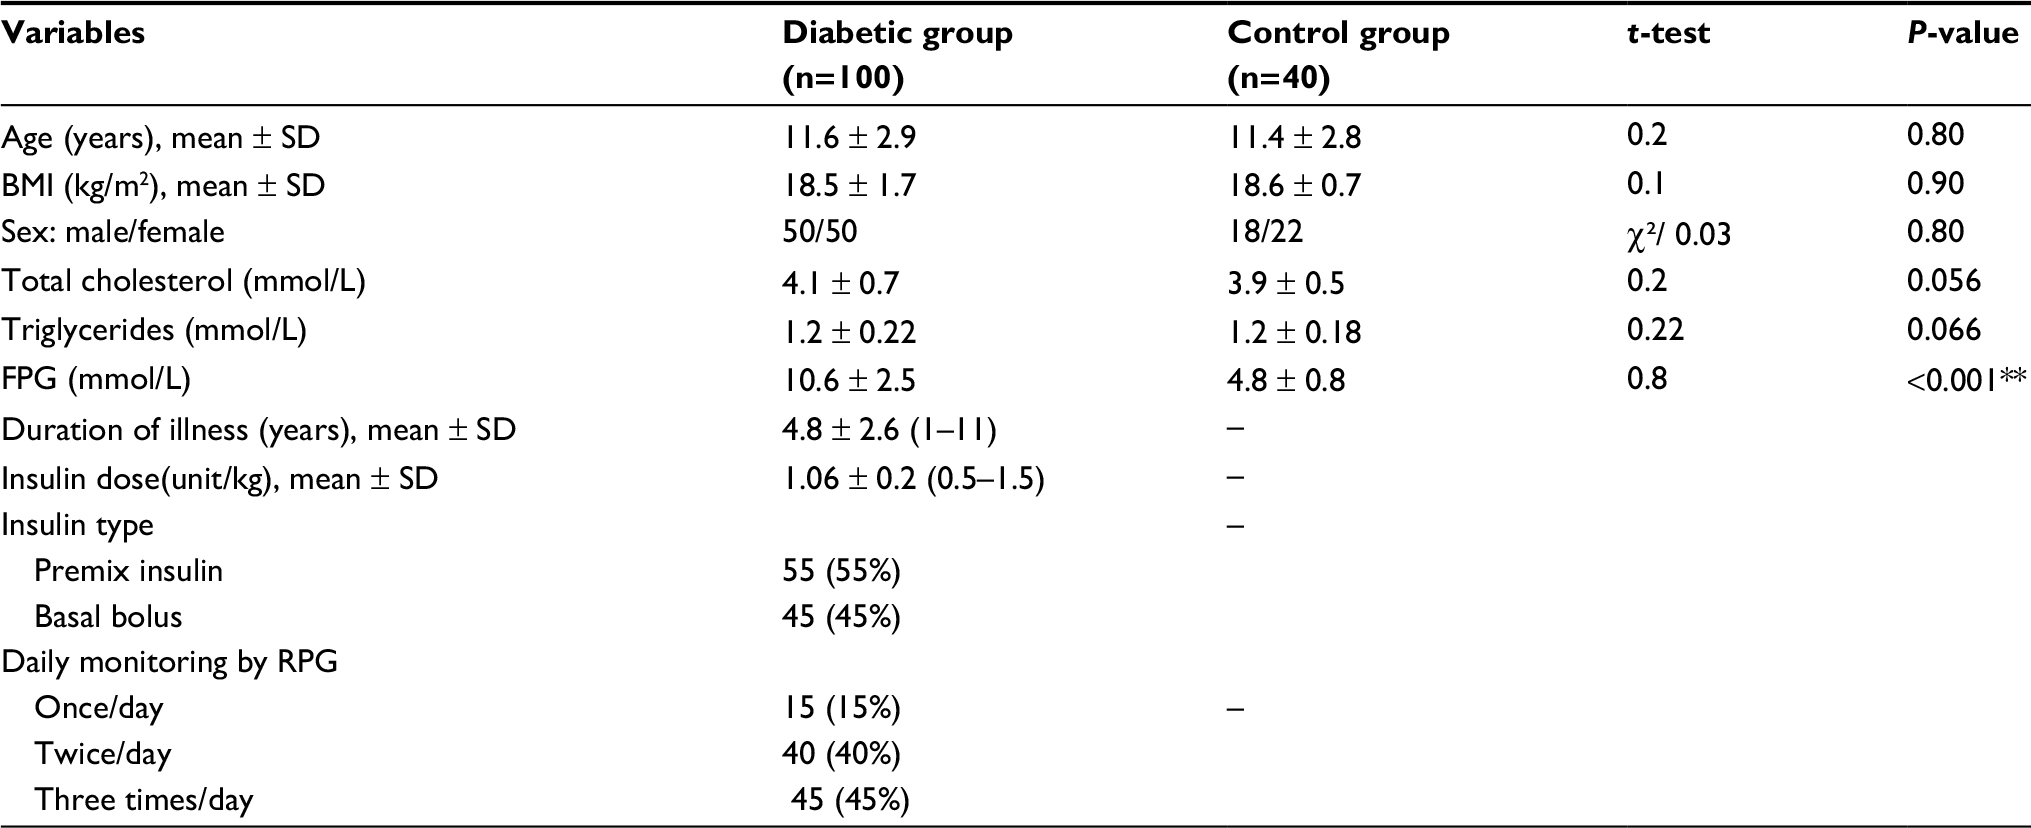 | Table 1 Demographics, clinical, and routine laboratory data of the studied groups Note: **Highly significant. Abbreviations: FPG, fasting plasma glucose; RPG, random plasma glucose. |
Serum Se, Cu, erythrocyte GSH, and GPx were highly statistically significantly lower in the diabetic group when compared to the control group (P<0.001). Serum Zn and Mg were statistically significantly lower in the diabetic group when compared to the control group (P<0.05). The A1c % was statistically significantly higher in the diabetic group when compared to the control group (P<0.001) (Table 2).
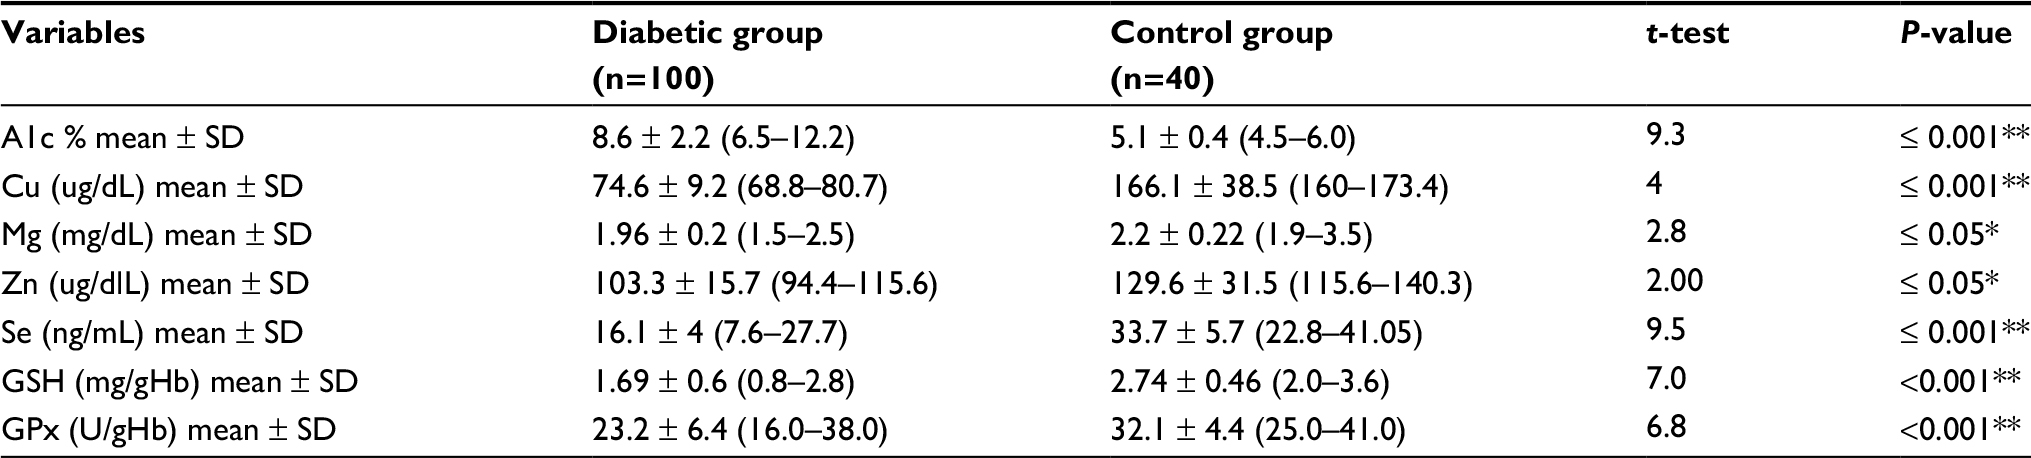 | Table 2 Comparison between the diabetic and control groups in the laboratory investigations Note: *Significant; **Highly significant Abbreviations: A1c %; glycosylated hemoglobin; Cu, copper; GPx, glutathione peroxidase; GSH, reduced glutathione; Mg, magnesium, Se, selenium; Zn, zinc.
|
Serum Se, Zn, Mg, Cu, erythrocyte GSH, and GPx were highly statistically significantly lower in the poorly controlled patients when compared to the good controlled patients (P<0.001). Serum Cu was statistically significantly lower in the poorly controlled patients when compared to the good controlled patients (P<0.05) (Table 3).
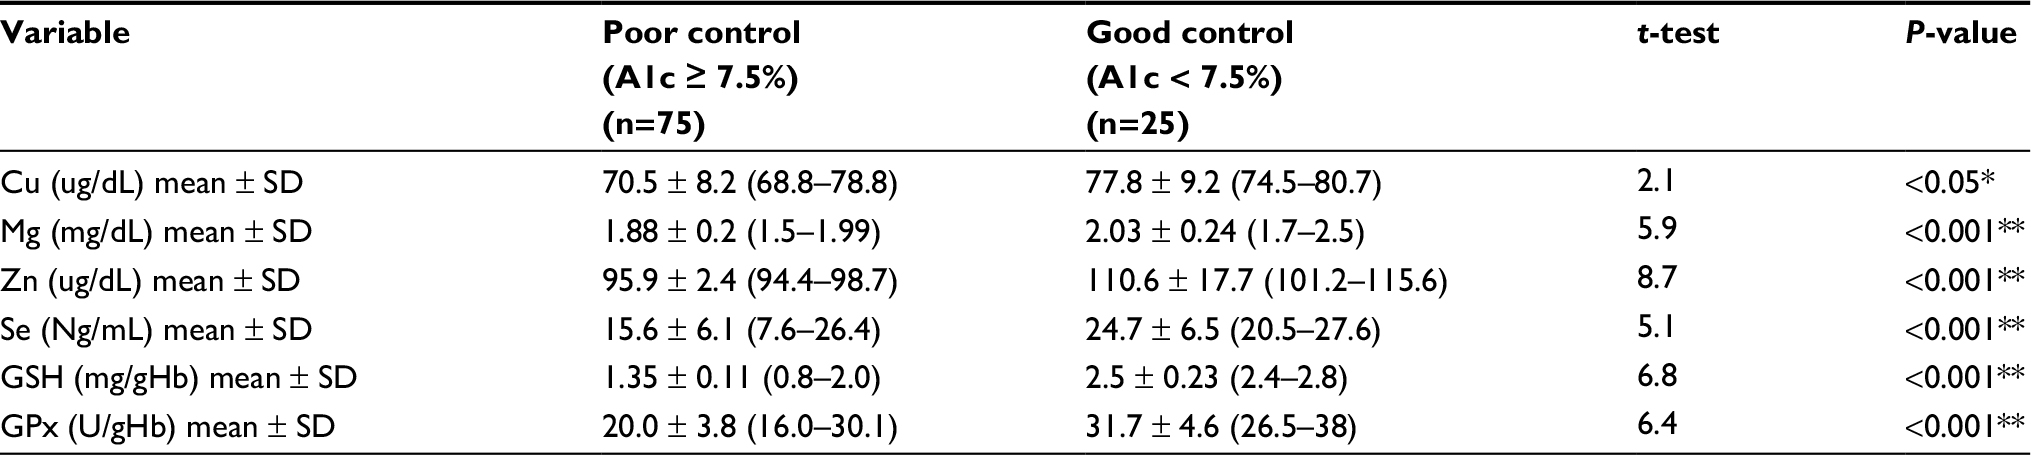 | Table 3 Comparison between poor- and good-controlled diabetics regarding laboratory investigations Note: *Significant; **Highly significant Abbreviations: A1c %, glycosylated hemoglobin; Cu, copper; GPx, glutathione peroxidase; GSH, reduced glutathione; Mg, magnesium, Se, selenium; Zn, zinc. |
The A1c % had a statistically significant positive correlation with the duration of illness (P<0.001), statistically significant negative correlation with Se, Zn, Mg, GSH, and GPx (P<0.05) and no statistically significant correlation with age, BMI, Cu, and insulin dose (P>0.05).
The duration of illness showed a statistically significant positive correlation with the A1c % (P<0.001), statistically significant negative correlation with Se, Zn, Mg, GSH, and GPx and no statistically significant correlation with age, BMI, Cu, and insulin dose (P>0.05).
The insulin dose showed a statistically significant positive correlation with age (P<0.05) and no statistically significant correlation with duration of illness, A1c %, Se, Zn, Mg and Cu (P<0.05) (Table 4). The serum Se had a statistically significant positive correlation with both erythrocyte GSH and GPx ([r=0.56, P<0.001] [r=0.78, P<0.001], respectively) (Figure 1). Scatter plots between A1c % and the corresponding measurement of serum Se, Cu, Zu, Mg, erythrocyte GSH, and GPx are shown in Figure 2.
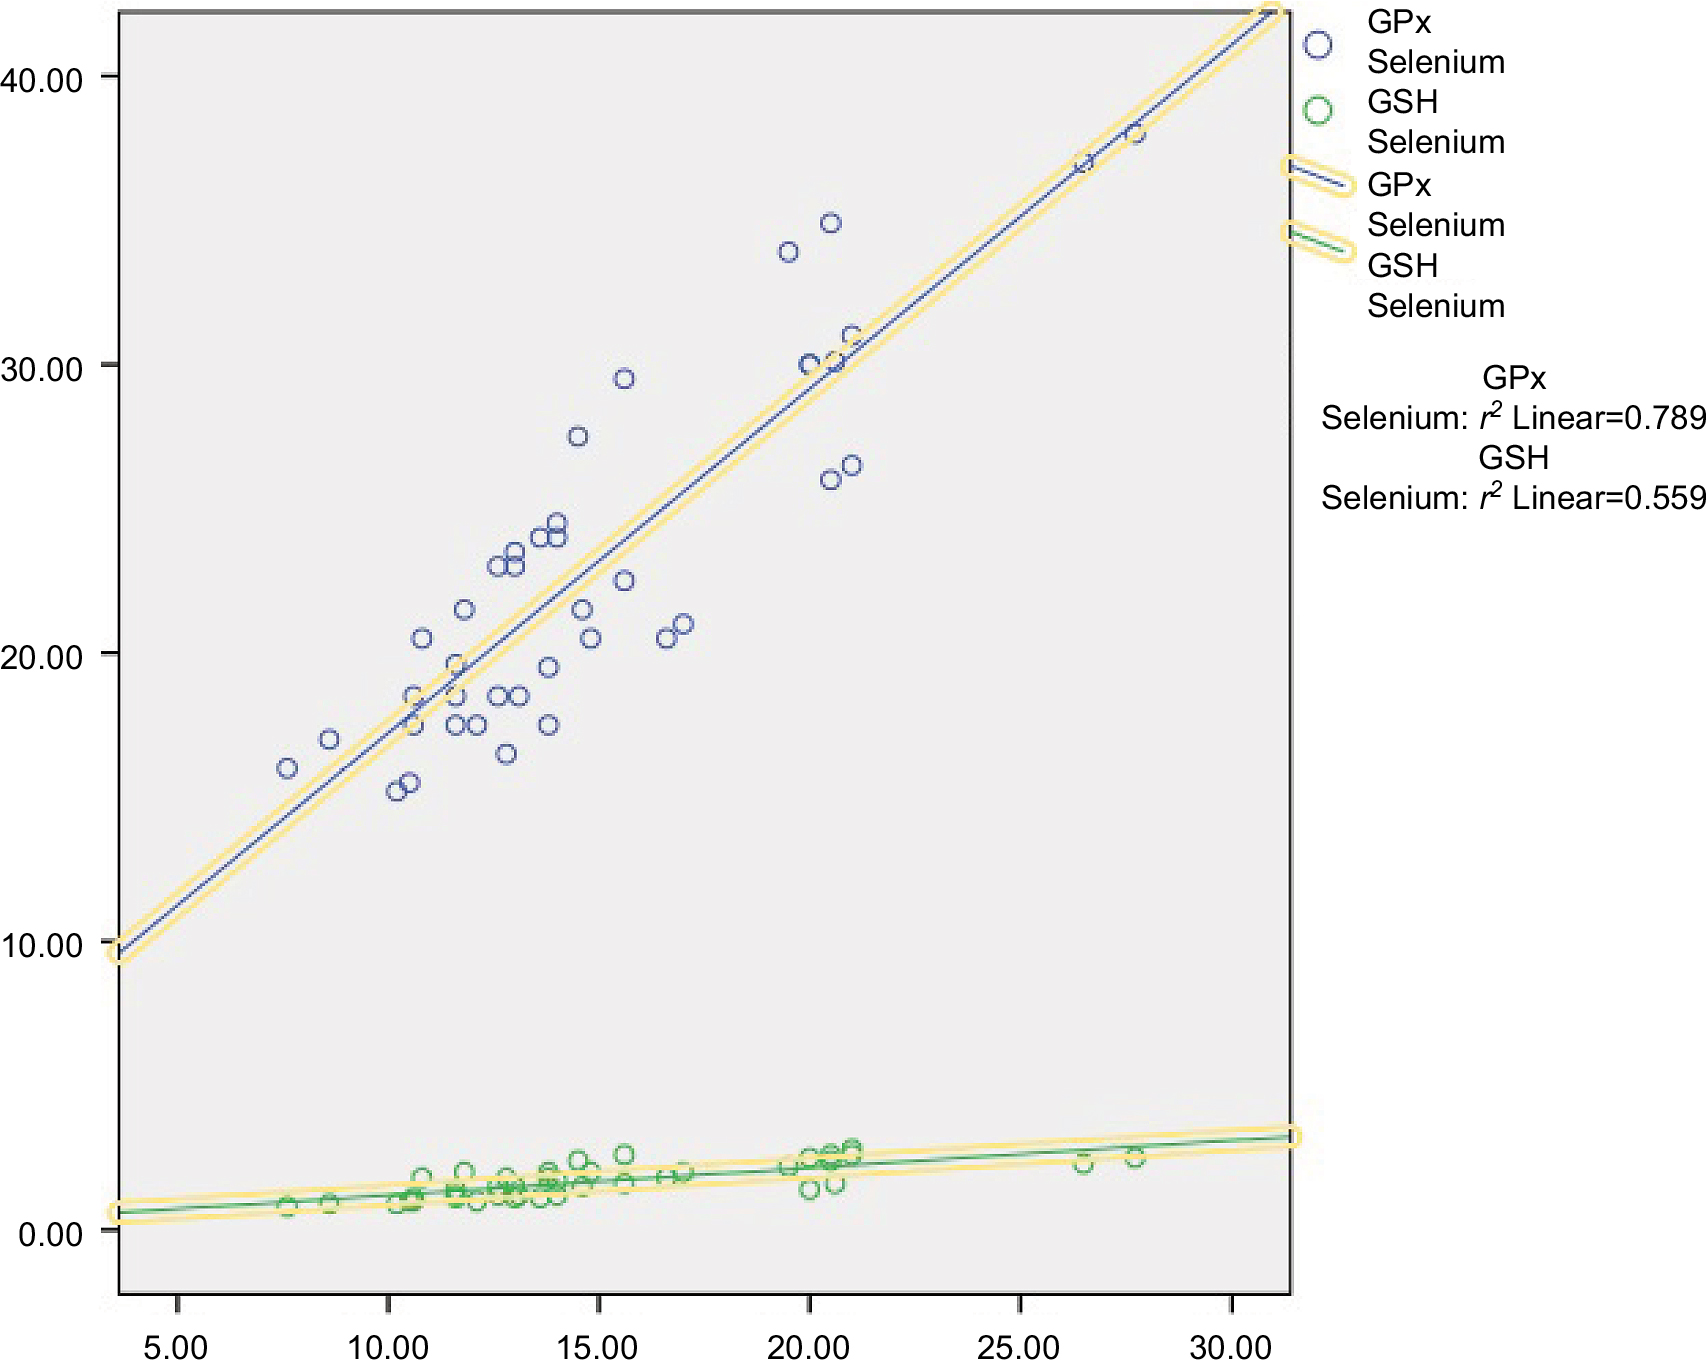 | Figure 1 A correlation study between serum Se level and erythrocyte GSH and GPx. Abbreviations: GPx, glutathione peroxidase; GSH, reduced glutathione. |
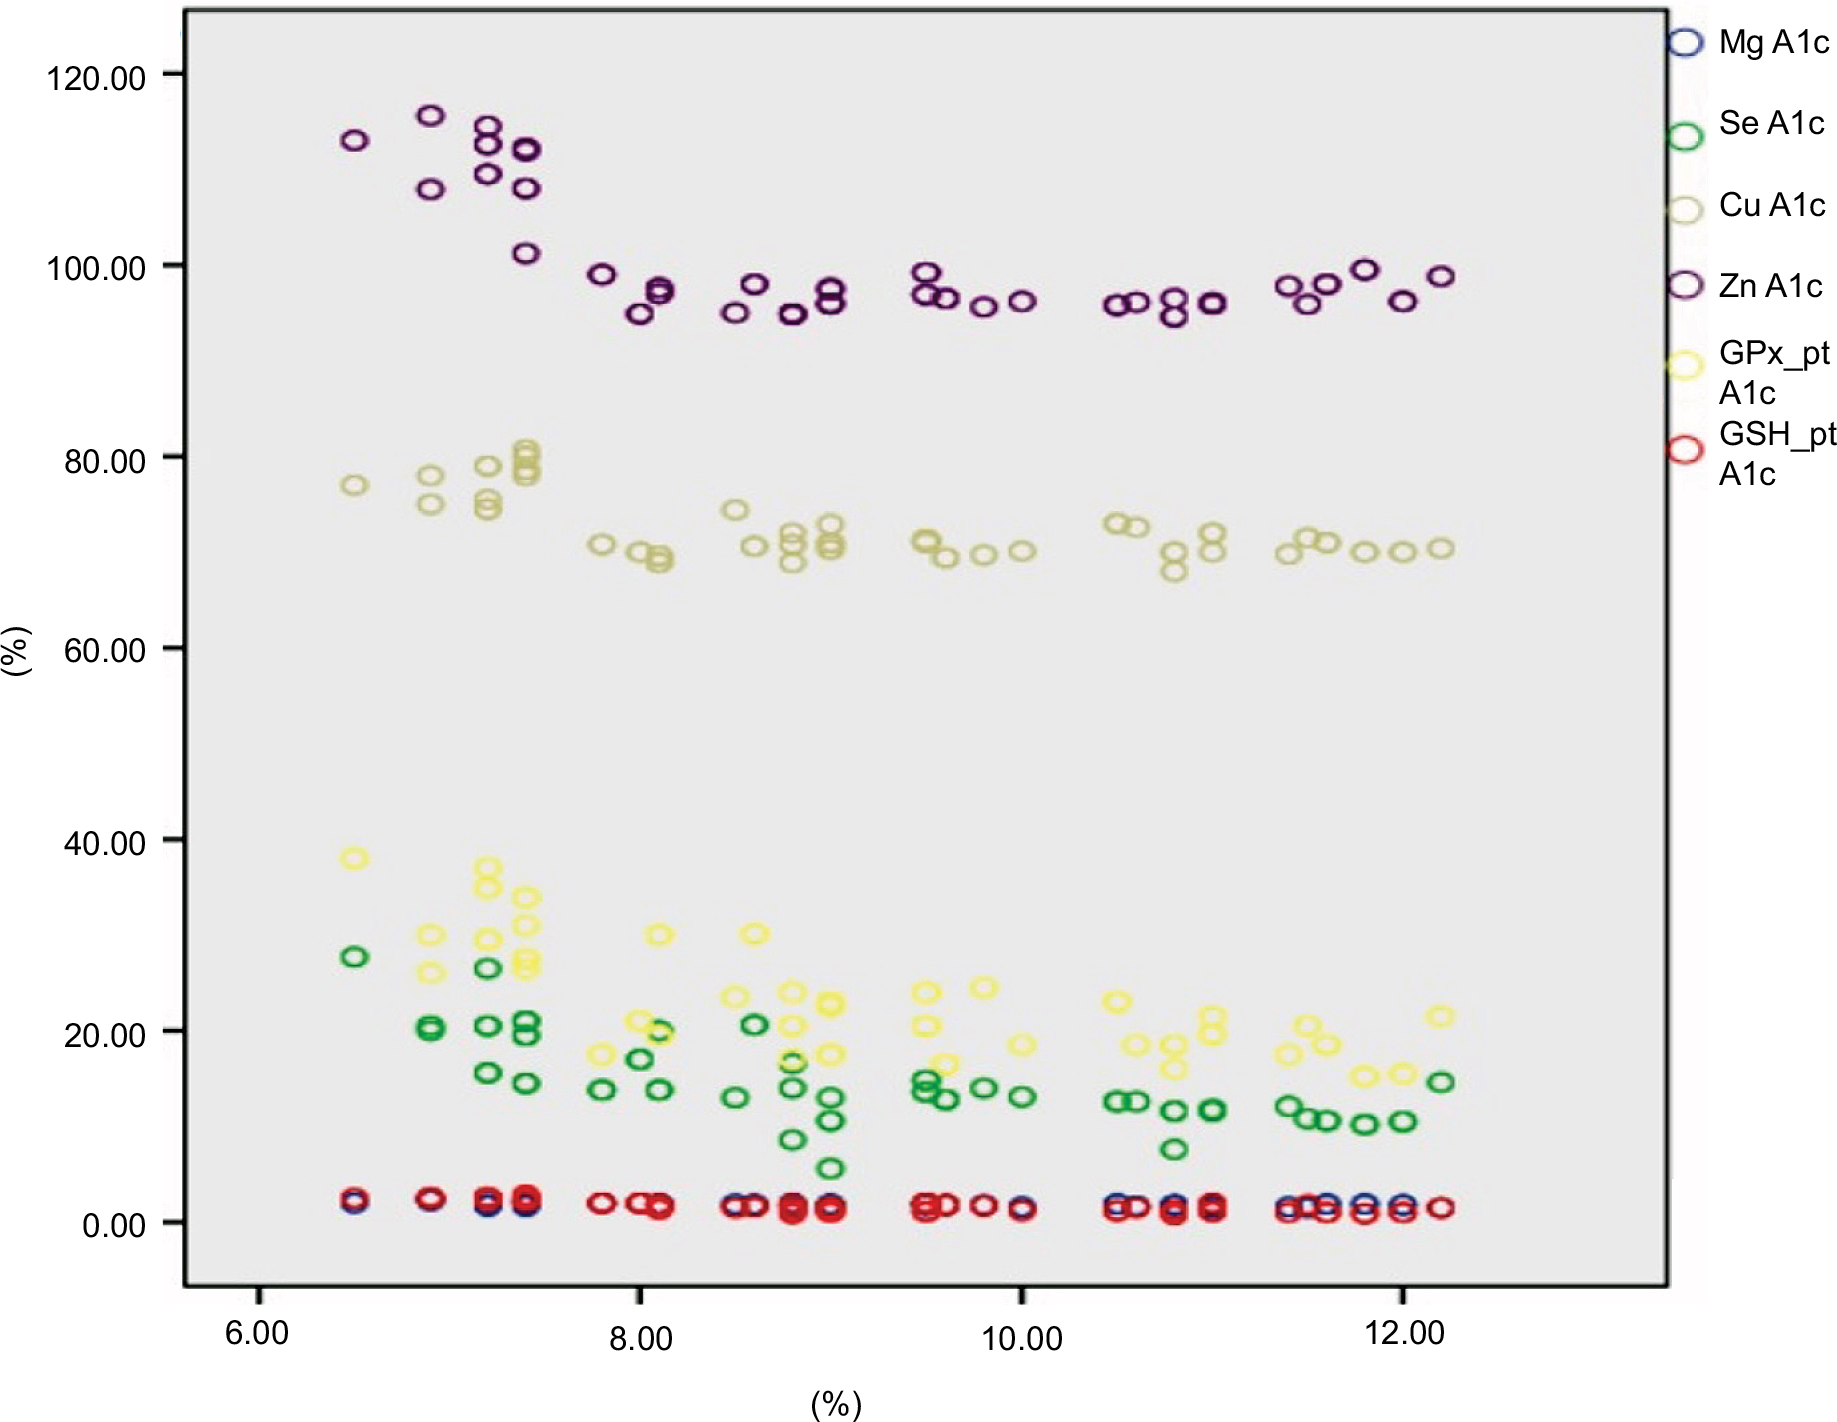 | Figure 2 Scatter plots between A1c % and corresponding measurement serum Se, Cu, Zu, Mg, and erythrocyte GSH and GPx. Abbreviations: A1c %, glycosylated hemoglobin; Cu, copper; GPx, glutathione peroxidase; GSH, reduced glutathione; HbA1c, hemoglobin A1c; Mg, magnesium, Se, selenium, Zn, zinc.
|
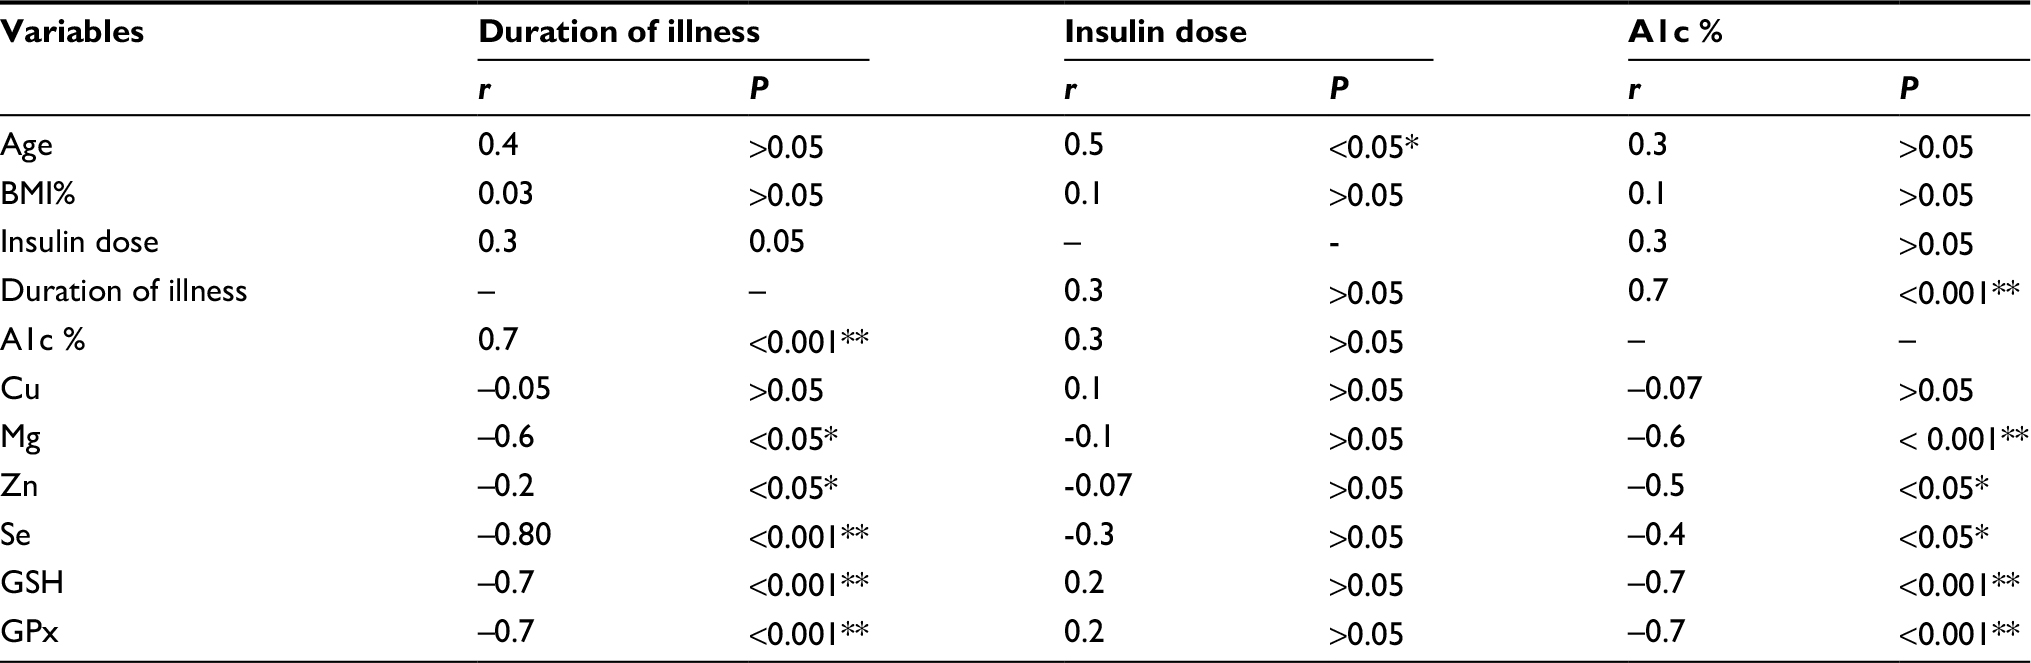 | Table 4 Correlation between duration of illness, insulin dose and A1c % with other parameters of the diabetic group Note: *Significant; **Highly significant Abbreviations: A1c %, glycosylated hemoglobin; Cu, copper; GPx, glutathione peroxidase; GSH, reduced glutathione; Mg, magnesium, Se, selenium; Zn, zinc. |
Discussion
Our study showed that the serum Se, Zn, Mg, and Cu were significantly lower in the diabetic group in comparison to the control group as shown in Table 2. This agrees with Özenç et al who found lower serum Se and Zn and normal serum Cu levels in children with T1D in comparison to controls. They explained the low serum Se level in patients with T1D might be due to its consumption by the increased activity of the antioxidant GSH-GPx system in order to reduce the free radicals produced by increased oxidative stress.1
Also, Maher and Shaaban reported lower serum Mg, Zn, and Cu in diabetic children than in controls.14 The decrease in Mg may be explained by the increased urinary Mg excretion, Mg conservation in the loop of Henle and distal tubule by insulin, inadequate Mg intake or gastrointestinal disorders.15 The low serum Cu in T1D may be secondary to excessive loss of Cu in the urine.16
Another study was done by Salmonowicz et al, which compared diabetic children to their sibling and to a control group. They found comparable levels of serum Se between all groups and lower levels of serum Mg and Zn and higher serum Cu in children with T1D compared with the control and sibling groups.17 The lower serum zinc in T1D cases is probably due to diabetes-related hyper zin-curia and impaired intestinal absorption of zinc.14
However, Zargar et al found higher serum Zn level and normal serum Cu and Mg levels in T1D.18 Another large study done in diabetic adults found increased serum Se, Zn, and Cu and decreased serum Mg in diabetic patients than in controls.19 Other studies reported either lower levels of serum Mg and normal Zn,20 or lower serum Zn and increased serum Cu levels,21 or normal serum Zn 22 in T1D in comparison to controls.
The variability of the results in the levels of trace elements in different studies may be due to the differences in the sample sizes, the age of patients, the surrounding environment, duration of the disease, ethnicity, nutritional habits and status, and glycemic control of the patients under the study.
Oxidative stress parameters (erythrocyte GSH and GPx) in our study showed a significant difference between diabetic and control groups being lower in the diabetic group as shown in Table 2. Previous studies found a low level of GSH either in the plasma or in the erythrocytes both in children and adults.23–25 The low erythrocyte GSH may be due to extensive oxidative stress with over-consumption of GSH,25 or secondary to the sluggish production of NADPH by the pentose phosphate pathway which is stimulated by insulin, thus lowering GSH activity and reduced GSH recycle.26
Studies done on serum or erythrocyte GPx activities in diabetics were variables, either increased or decreased or normal GPx activity was reported in children with T1D.23,27–30 The decreased GPx activity may be due to low glutathione content or enzyme inactivation under severe oxidative stress.24,31
The diabetic group was classified into two groups according to A1c % (7.5 %). Diabetic children were considered poorly controlled if A1c % was ≥ 7.5 %. We found a statistically significant difference between poor and good controlled groups in Mg, Zn, Se, Cu, erythrocyte GSH, and GPx being lower in the poorly controlled group as shown in Table 3. This is in agreement with previous different studies that found the same results, but with higher A1c % (≥ 9%) as a cutoff value for the poor control of diabetic children in their studies and on variable trace elements.7,14.15 The results of our study usually occurred due to the poor glycemic control of most our patients evidenced by higher mean A1c % level (8.6±2.2) than optimum A1c % (less than 7.5%) for good control of diabetic children, 75% of the patients had A1c % > 7.5% and higher mean FPS (10.6 ± 2.5) mmol/L. The presence of comparable BMI between patients and controls and average nutritional history somewhat excludes the nutrition status as the main cause for low levels of trace elements in our study.
In the current study, we found that there was a significant negative correlation between A1c % and serum Mg, Zn, Se, erythrocyte GSH, and GPx, and no statistically significant correlation with age, BMI and Cu in the case group as shown in Table 4. This agrees with Özenç et al who found a negative correlation between the A1c % with serum Se, Zn, and erythrocyte GPx and no correlation was detected between A1c % and serum Cu.1 Also, Maher and Shaaban found that serum Zn, Mg, and Cu levels were negatively correlated with A1c %.14 Another study found a negative correlation between GSH with FPG and no correlation between GPx with FPG.23
Other studies found a negative correlation between A1c % with Mg15 and between A1c % with Se.7 However, Salmonowicz et al. revealed a positive correlation between A1c % and serum Mg, Cu, and Zn; with a tendency to statistical significance with Se (P=0.06).17 Other studies found no correlations between A1c % and serum Zn and Cu20 or between A1c % and serum Zn.22
The duration of illness showed a significant positive correlation with A1c % (P=0.001), a significant negative correlation with serum Se, Zn, Mg, erythrocyte GSH, and GPx and no significant correlation with serum Cu, age, BMI, and insulin dose as shown in Table 4. In accordance with Maher and Shaaban study who found the same results regarding serum Mg, Zn, and Cu. They explained the low Cu level with prolonged diabetes duration may be due to Cu consumption in the oxidation–reduction reactions because it acts as cofactors for cytochrome oxidase and superoxide dismutase.14 Insulin deficiency and resistance can affect tubular reabsorption of Mg and this explains negative correlation between Mg level and diabetes duration.32 Other studies found no correlation between diabetes duration with serum Se, Zn, or Mg.6,20,22
In the diabetic group, we found that there was a significant positive correlation between insulin dose and age (P=0.01). This agrees with Lin et al’s study which found that T1D children needed to increase the insulin dose with the increase of the age of the child.21
In our study, the serum Se showed a significant positive correlation with the erythrocyte levels of GSH and GPx denoting that low Se level affects the GSH-GPx system levels and function by altering its role in protecting the cell membrane against oxidants. This occurs as Se enters into the structure of the GSH-GPx system.5 Sedighi et al found low Se and GPx levels in adults with diabetic nephropathy and both were correlated with the degree of albuminuria.33
Conclusion
Children with T1D especially poorly controlled, had low serum Se, Zn, Mg, Cu, erythrocyte GSH, and GPx. The low serum Se in diabetic children may play an important role in the dysfunction of the GSH-GPx system. We recommend for good glycemic control, follow-up of serum trace elements in diabetic children and more studies on other trace elements and their relation to indicators of oxidative stress.
Disclosure
The authors report no conflicts of interest in this work.
References
Özenç S, Saldir M, Sarı E, et al. Selenium, zinc, and copper levels and their relation with HbA1c status in children with type 1 diabetes mellitus. Int J Diabet Dev Countries. 2015;35(4):514–518. | ||
Viktorínová A, Toserová E, Krizko M, Duracková Z. Altered metabolism of copper, zinc, and magnesium are associated with increased levels of glycated hemoglobin in patients with diabetes mellitus. Metabolism. 2009;58(10):1477–1482. | ||
Praveeena S, Pasula S, Sameera K. Trace elements in diabetes mellitus. J Clin Diagn Res. 2013;7(9):1863–1865. | ||
Laclaustra M, Stranges S, Navas-Acien A, Ordovas JN, Guallar E. Serum selenium and serum lipid in U.S Adult: national health and nutrition examination survey (NHANES) 2003–2004. Atherosclerosis. 2010;2010(2):643–648. | ||
Rayman MP. The importance of selenium to human health. Lancet. 2000;356(9225):233–241. | ||
Forte G, Bocca B, Peruzzi A, et al. Blood metals concentration in type 1 and type 2 diabetics. Biol Trace Elem Res. 2013;156(1–3):79–90. | ||
Ruiz C, Alegria A, Barberá R, Farré R, Lagarda J. Selenium, zinc, and copper in plasma of patients with type 1 diabetes mellitus in different metabolic control states. J Trace Elem Med Biol. 1998;12(2):91–95. | ||
Gardiner PHE, Littlejohn D, Halls DJ, Fell GS. Direct determination of selenium in human blood serum and plasma by electrothermal atomic absorption spectrometry. Trace Elem Med Biol J. 1995;9(2):74–81. | ||
Johnsen O, Eliasson R. Evaluation of a commercially available kit for the colorimetric determination of zinc. Int J Androl. 1987;10(2):435–440 | ||
Abe A, Yamashita S, Noma A. Sensitive, direct colorimetric assay for copper in serum. Clin Chem. 1989;35(4):552-554. | ||
Ginder EM, Heth DA. Colorimeter determination with bound “Calmagite” of magnesium in human blood serum. Clin Chem. 1971; 17:662. | ||
Paglia DE, Valentine WN. Studies on the quantitative and qualitative characterization of erythrocyte glutathione peroxidase. J Lab Clin Med. 1967;70:158–169. | ||
Beutler E, Duron O, Kelly BM. The improved method for the determination of blood glutathione. J Lab Clin Med. 1963;61:882–888. | ||
Ahmed MM, Helal SR. Study of serum magnesium, zinc, copper, and glyco-hemoglobin in children with type 1 diabetes mellitus. Alexandria J Ped. 2002;16(2):285–289. | ||
Galli-Tsinopoulou A, Maggana I, Kyrgios I, et al. Association between magnesium concentration and HbA1c in children and adolescents with type 1 diabetes mellitus. J Diabetes. 2014;6(4):369–377. | ||
Zheng, Y, Li, XK, Wang, Y, Cai L. The role of zinc, copper, and iron in the pathogenesis of diabetes and diabetic complications: therapeutic effects by chelators. Hemoglobin. 2008;32(1–2):135–145. | ||
Salmonowicz B, Krzystek KM, Noczyńska A. Trace elements, magnesium and the efficacy of antioxidant systems in children with type 1 diabetes mellitus and in their siblings. Adv Clin Exp Med. 2014;23(2):259–268. | ||
Zargar, AH, Bashir, MI., Masoodi, SR, et al. Copper, zinc and magnesium levels in type-1 diabetes mellitus. Saudi Med J. 2002;23(5):539–542. | ||
Zanagh H, Yan C, Yang Z, et al. Alterations of serum trace elements in patients with type 2 diabetes. J Trace Elem Med Biol. 2017;40:91–96. | ||
Lin CC, Tseng GJ, Lee CF, Chen BH, Huang YL. Magnesium, zinc, and chromium levels in children, adolescents, and young adults with type 1 diabetes. Clin Nutr. 2016;35(4):880–884. | ||
Lin CC, Huang HH, Hu CW, et al. Trace elements, oxidative stress and glycemic control in young people with type 1 diabetes mellitus. J Trace Elem Med Biol. 2014;28(1):18–22. | ||
Estakhri M, Djazayery A, Eshraghian M, et al. Serum zinc levels in children and adolescents with type-1 diabetes mellitus. Iran J Public Health. 2011;40(4):83–88. | ||
Likidilid A, Patchanans N, Poldee S, Peerapatdit T. Glutathione and glutathione peroxidase in type 1 diabetes mellitus. J Med Assoc Thai. 2007;90(9):1759–1767. | ||
Mishra N, Singh N. Blood viscosity, lipid profile, lipid peroxidation in type-1 diabetic patients with good and poor glycemic control. N Am J Med Sci. 2013;5(9):562–566. | ||
Stambouli-Guerriche BA, Mokhtari-Soulimane N, Merzouk H, Merzouk S-A, Bendedouche SA. Elevation of oxidative stress markers in type 1 diabetic children. J Diabetes Endocrinol. 2015;6(2):5–11. | ||
Wierusz-Wysocka B, Wysocki H, Byks H, Zozulińska D, Wykretowicz A, Kaźmierczak M. Metabolic control quality and free radical activity in diabetic patients. Diabetes Res Clin Pract. 1995;27(3):193–197. | ||
Ndahimana J, Dorchy H, Vertongen F. Erythrocyte and plasma antioxidant activity in diabetes mellitus type 1. Presse Méd. 1996;25(5):188–192. | ||
Ezeiruaku FC, Udenwoke IO. Evaluation of plasma glutathione peroxidase (GPX) enzyme in type 1 and type 2 chronic diabetes mellitus patients in Yenegoa, Bayelsa State of Nigeria. Int Res Med Sci. 2016;4(3):050–054. | ||
Domínguez C, Ruiz E, Gussinye M, Carroscosa A. Oxidative stress at onset and in early stages of type 1 diabetes in children and adolescents. Diabetes Care. 1998;21(10):1736–1742. | ||
Majchrzak, A, Zozulińska, D, Wierusz-Wysocka, WB. Evaluation of selected components in antioxidant systems of blood in patients with diabetes. Pol Merkur Lekarski. 2001;10(57):150–152.[Article in Polish] | ||
Faure P, Benhamou, PY, Perard, A, Halimi S, Roussel AM. Lipid peroxidation in insulin-dependent diabetic patients with early retina degenerative lesions: effects of an oral zinc supplementation. Eur J Clin Nutr. 1995;49:282–288. | ||
Arpaci D, Tocoglu, A, Ergenc H, Korkmaz S, Acar A, Tamer A. Associations of serum magnesium levels with diabetes mellitus and diabetic complications. Hippokratia. 2015;19(2):153–157. | ||
Sedighi O, Makhlough A, Shokrzadeh M, Hoorshad S. Association between plasma selenium and glutathione peroxidase levels and severity of diabetic nephropathy in patients with type two diabetes mellitus. Nephrourol Mon. 2014;6(5):e21355. |
 © 2018 The Author(s). This work is published and licensed by Dove Medical Press Limited. The full terms of this license are available at https://www.dovepress.com/terms.php and incorporate the Creative Commons Attribution - Non Commercial (unported, v3.0) License.
By accessing the work you hereby accept the Terms. Non-commercial uses of the work are permitted without any further permission from Dove Medical Press Limited, provided the work is properly attributed. For permission for commercial use of this work, please see paragraphs 4.2 and 5 of our Terms.
© 2018 The Author(s). This work is published and licensed by Dove Medical Press Limited. The full terms of this license are available at https://www.dovepress.com/terms.php and incorporate the Creative Commons Attribution - Non Commercial (unported, v3.0) License.
By accessing the work you hereby accept the Terms. Non-commercial uses of the work are permitted without any further permission from Dove Medical Press Limited, provided the work is properly attributed. For permission for commercial use of this work, please see paragraphs 4.2 and 5 of our Terms.