")
Back to Journals » Infection and Drug Resistance » Volume 10
Assessing the oseltamivir-induced resistance risk and implications for influenza infection control strategies
Authors Hsieh NH, Lin YJ, Yang YF, Liao CM
Received 29 March 2017
Accepted for publication 15 June 2017
Published 20 July 2017 Volume 2017:10 Pages 215—226
DOI https://doi.org/10.2147/IDR.S138317
Checked for plagiarism Yes
Review by Single anonymous peer review
Peer reviewer comments 2
Editor who approved publication: Professor Suresh Antony
Nan-Hung Hsieh,1 Yi-Jun Lin,2 Ying-Fei Yang,2 Chung-Min Liao2
1Department of Veterinary Integrative Biosciences, College of Veterinary Medicine and Biomedical Sciences, Texas A&M University, College Station, Texas, USA; 2Department of Bioenvironmental Systems Engineering, National Taiwan University, Taipei, Taiwan
Background: Oseltamivir-resistant mutants with higher drug resistance rates and low transmission fitness costs have not accounted for influenza (sub)type viruses. Predicting the impacts of neuraminidase inhibitor therapy on infection rates and transmission of drug-resistant viral strains requires further investigation.
Objectives: The purpose of this study was to assess the potential risk of oseltamivir-induced resistance for influenza A (H1N1) and A (H3N2) viruses.
Materials and methods: An immune-response-based virus dynamic model was used to best fit the oseltamivir-resistant A (H1N1) and A (H3N2) infection data. A probabilistic risk assessment model was developed by incorporating branching process-derived probability distribution of resistance to estimate oseltamivir-induced resistance risk.
Results: Mutation rate and sensitive strain number were key determinants in assessing resistance risk. By increasing immune response, antiviral efficacy, and fitness cost, the spread of resistant strains for A (H1N1) and A (H3N2) were greatly decreased. Probability of resistance depends most strongly on the sensitive strain number described by a Poisson model. Risk of oseltamivir-induced resistance increased with increasing the mutation rate for A (H1N1) only. The ≥50% of resistance risk induced by A (H1N1) and A (H3N2) sensitive infected cells were 0.4 (95% CI: 0.28–0.43) and 0.95 (95% CI 0.93–0.99) at a mutation rate of 10−6, respectively. Antiviral drugs must be administrated within 1–1.5 days for A (H1N1) and 2–2.5 days for A (H3N2) virus infections to limit viral production.
Conclusion: Probabilistic risk assessment of antiviral drug-induced resistance is crucial in the decision-making process for preventing influenza virus infections.
Keywords: influenza, resistance risk, oseltamivir, probabilistic risk assessment
Introduction
Influenza epidemics and occasional pandemics have caused >20 million people died in the world.1 A public health priority thus focuses on the effective measures to limit the spread and morbidity of virus infection caused by the potential impact of pandemic influenza. The antiviral drugs are essential requirements for control of initial influenza outbreaks caused by a new virus. There is also a heavy reliance on drug stockpiles in prepandemic plans. Report estimated that over 200 million doses had been stockpiled all over the world.2
A virus surface glycoprotein called neuraminidase (NA) is the principal target for these drugs. NA can facilitate the release of nascent virus and thus the spread of infection. Currently, two of the commonly used NA inhibitors against influenza are oseltamivir (Tamiflu) and zanamivir (Relenza) that are developed based on the knowledge of the enzymatic structure.3,4 Oseltamivir can bind to the active site of NA enzyme expressed on the virion surface to attenuate the NA activity, inhibiting the release of newly formed virions from infected cells and reducing the virus infectivity.5,6 Moreover, it can limit the virus-penetrating ability in airway mucus.7 Gubareva et al8 reported that a small fraction of volunteers infected with the seasonal human H1N1 influenza strain have shed resistant viruses during clinical testing of oseltamivir. The oseltamivir-resistant viruses could carry a mutation of histidine to tyrosine at NA residue 274 (His274Tyr, H274Y) and further causes the weakening of oseltamivir binding.9,10 Viruses containing H274Y rapidly became predominant among human seasonal H1N1 isolates since 2007–2008.3
In Taiwan, influenza A (H1N1) viruses predominantly circulated and the viruses were all oseltamivir sensitive during 2007–2008 influenza season.11 However, Wu11 reported that an average of 46% resistance (22/48) with H274Y mutation in the NA was detected by Taiwan Centers for Disease Control starting from September to December 2008. Moreover, oseltamivir-resistant H274Y seasonal H1N1 viruses have appeared worldwide during 2007–2009 influenza seasons.12–16 Chen et al17 indicated that the pandemic swine-origin 2009 A (H1N1) viruses that swept the globe remain mostly oseltamivir-sensitive, yet scattered H274Y isolates have emerged.
There are two key factors that affect the epidemiology of drug resistance in influenza: 1) the rate at which treated individuals developed drug resistance and 2) the fitness cost of resistance associated with mutation rate.18 To date, oseltamivir-resistant mutants with higher drug-resistant rates and low transmission fitness costs have not accounted for the influenza (sub)type viruses. Predicting the impacts of NA inhibitor therapy on infection rates and transmission of drug-resistant viral strains will require a multitude of perspectives and approaches.18–24
Here we best fitted the immune response (IR)-based virus dynamic models that built on past models of host–pathogen interactions to oseltamivir-resistant influenza A (H1N1) and A (H3N2) infection data to estimate key parameters including fitness cost, mutation rate, and antiviral efficacy.19,25 We compared the results for parameter changes to previous models and extended the model to assess the potential risk of the generation and spread of oseltamivir-resistant influenza virus infections. Finally, we applied the proposed virus dynamic model to simulate the dynamics of sensitive and resistant viruses that varied with mutation rates and to further estimate the risk probability of resistance emergence under different scenarios. The results were also discussed in the context of current efforts to assess the effective opportunity for treatment.
Materials and methods
Study data
To understand the (sub)type viruses and geographic effects on oseltamivir resistance risk of generation and spread, two valuable datasets provided by Gubareva et al8 (in the USA) and Kiso et al26 (in Japan) were used.
Gubareva et al8 investigated the potential for the emergence of oseltamivir-resistant variants in 80 adult healthy human volunteers (18–40 years old) treated with this NA inhibitor (twice daily at 20, 100, or 200 mg, or once daily at 200 mg), after experimental infection with a specific influenza A (H1N1) virus (~106 TCID50 [50% tissue culture infective dose]). Drug administration began 28 h after influenza virus inoculation to subjects and continued for 5 days, whereas nasal washes were collected for 8 days. They found that 4% (2 of 54) resistant viruses carrying the H274Y mutation were detected.
Kiso et al26 investigated oseltamivir resistance in 50 children (2 months–15.8 years old) treated for influenza A (H3N2) in Japan. Oseltamivir was treated with 4 mg kg−1 daily in divided doses twice a day. Viral sequences of specimens before and on days 3–8 of drug administration were analyzed to assure the temporal pattern of emergence of oseltamivir-resistant viruses. Oseltamivir-resistant viruses were first detected at day 4 of treatment and on the following days of the study. They found that 18% (9 of 50) NA mutations in viruses carrying the Arg292Lys (six of nine), Glu119Val (two of nine), and Asn294Ser (one of nine) mutations were detected. They also concluded that children could be a source of viral transmission even after 5 days of treatment with oseltamivir.
IR-based virus dynamic model
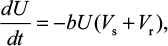
A model of IR-based influenza virus dynamics that builds on the past well-developed models by Baccam et al25 and Handel et al19 was used to explore the consequences of host–pathogen interactions. The model contains three levels: 1) cell level, 2) virus level, and 3) human IR level. The essential features of the present model are depicted in Figure 1A. The system of ordinary differential equations corresponding to the model in Figure 1A can be expressed as follows:
|
|
|
|
|
|
|
|
|
|
|
|

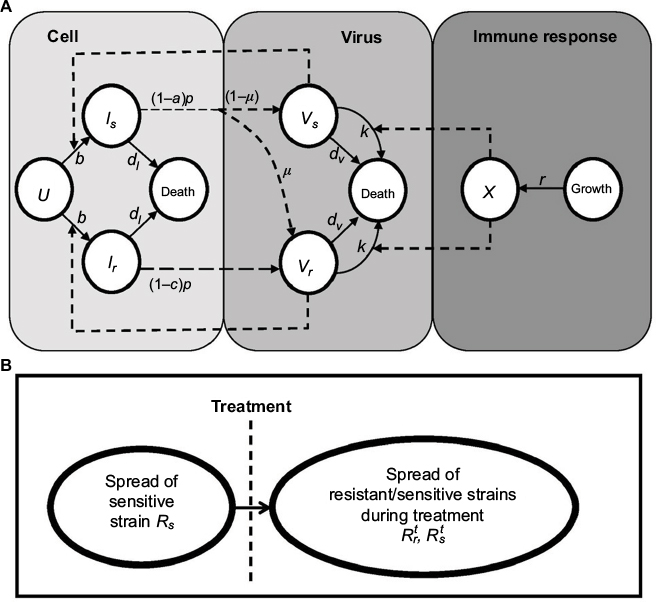 | Figure 1 Schematic representations of (A) immune response (IR)-based influenza virus dynamic model and (B) generation and spread of sensitive and resistance strains. |
where U is the number of uninfected target cells, Is is the number of sensitive infected cells, Ir is the number of resistant infected cells, Vs is the sensitive viral load (TCID50 mL−1), Vr is the resistant viral load (TCID50 mL−1), X is the IR (–), b is the infection rate (mL d−1 TCID50−1), dI is the death rate of infected cells (d−1), a is the antiviral efficacy, µ is the mutation rate per sensitive infected cell division, p is the virus production rate (TCID50 d−1 mL−1), dV is the death rate of virus (d−1), k is the unit conversion constant (d−1), c is the fitness cost of resistance, and r is the growth rate of IR (d−1).
The basic reproduction number of untreated strains can be determined based on the virus dynamics shown in Equations 1–6 as in Nowark and May27:
|
|
where U0 is the initial number of target uninfected cells and X0 is the initial IR.
Therefore, the production number of treated sensitive infected cells ( ) and resistant infected cells
 can also be determined by the following equation:
|
|
|
|
Equations 7–9 can be used to characterize the generation and spread of oseltamivir resistance in influenza virus (Figure 1B).
Probability of oseltamivir-induced resistance risk
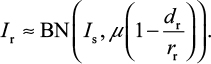
To understand the likelihood that a resistant mutant appeared during the NA inhibitor treatment, we calculated the probability of resistant virus emergence. Under the assumption of complete resistance, the probability of extinction of a resistant virus infected starting from one resistant infected cell can be determined by the ratio of the death rate and the growth rate of resistant infected cells (i.e., dr/rr) during treatment.28 The number of resistant infected cells produced from the sensitive infected cell population is generally proportional to the number of sensitive infected cell divisions (Is). The mutation rate (µ) is involved in relating the numbers of resistant and sensitive infected cells28.
After some mathematical manipulations, Foo and Michor28 showed that the number of surviving resistant infected cells (Ir) produced from the sensitive infected cell population during a given treatment can be described by a binomial (BN) distribution with parameters involving Is, µ, and dr/rr as
|
|
To estimate the probability of resistance (Pr) describing at least one surviving resistant infected cell produced before the extinction of sensitive infected cells, we approximated Pr by the probability of extinction of a branching system. The number of resistant infected cells (Ir) can be described by a BN distribution (Equation 10) with a mean of Isµ (1–dr/rr)29.
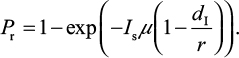
Explicitly, the proposed IR-based virus dynamic model reveals two properties of dr≡dI and rr≡r. Based on these two properties, the probability of oseltamivir-induced resistance Pr can then be approximated by a Poisson distribution with a mean of Isµ (1–dI/r)28–30:
|
|
This equation can also be treated as a conditional probability distribution of probability of resistance for a given influential parameter. Antia et al30 and Handel et al25 implicated that sensitive infected cells (Is) played a crucial role in determining the probability of resistance emergence. Given Is as the most important determinant, the conditional probability in Equation 11 can be rewritten mathematically as a form of conditional probability distribution of  .
.
The risk of resistance can be calculated as the probability density function of sensitive infected cells multiplied by the conditional probability distribution of. Therefore, the probability of oseltamivir-induced resistance risk in influenza (sub)type viruses can be estimated by a joint probability function as
|
|
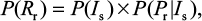
where P(Rr) represents the oseltamivir-induced resistance risk estimate of influenza (sub)type virus infections.
Uncertainty and data analysis
Optimal statistical models were selected on the basis of least-squared criterion from a set of nonlinear models provided by TableCurve 2D packages (AISN Software Inc., Mapleton, OR, USA). This study judged the significance when p-value <0.05. We used Monte Carlo (MC) technique to quantify the uncertainty and its impact on the estimation of expected risk. An MC simulation was also performed with 10,000 iterations to generate 2.5 and 97.5 percentiles as the 95% CI for all fitted models. The Crystal Ball software (version 2000.2; Decisionerring, Inc., Denver, CO, USA) was employed to implement MC simulation. Model simulations of virus dynamics were performed by using Mathematica (version 5.1; Wolfram Research Inc., Champaign, IL, USA). The techniques of analysis for influenza infection have also been described in our previous studies.31,32
Results
Fitting models to data
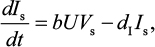
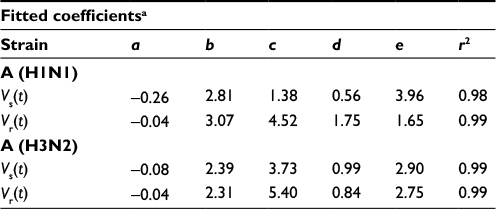
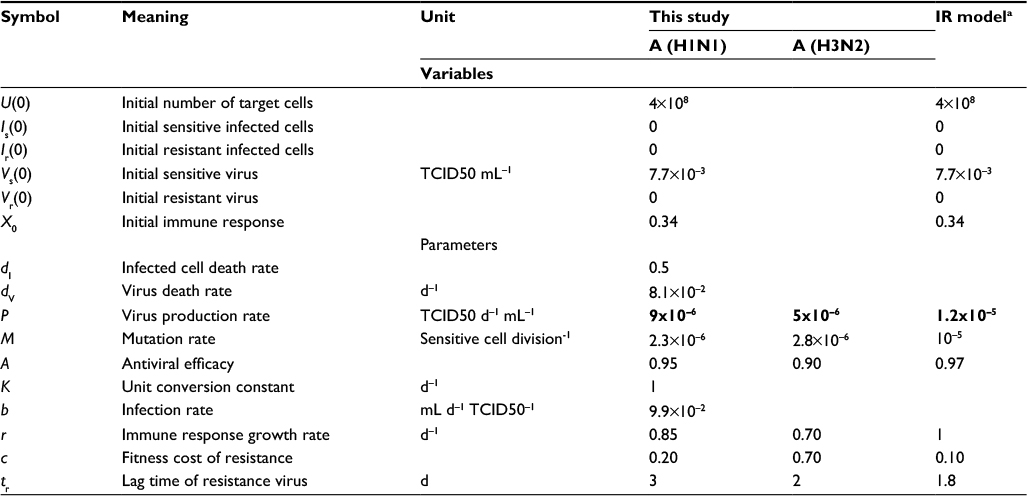
Gamma distribution was selected to be the best-fitted model to the data of sensitive and resistant infected cells, respectively, with r2 ranging from 0.98 to 0.99 (Figure 2, Table 1). To obtain the essential key parameters in IR-based virus dynamics, the proposed IR-based virus dynamic model was used to fit the total sensitive and resistant data of A (H1N1) and A (H3N2) viruses, respectively (Figure 2). The results were in a good agreement with the data (r2=0.77 for A [H1N1] and r2=0.85 for A [H3N2]) (Figure 2A and B). The resulting estimated parameter values are listed in Table 2.
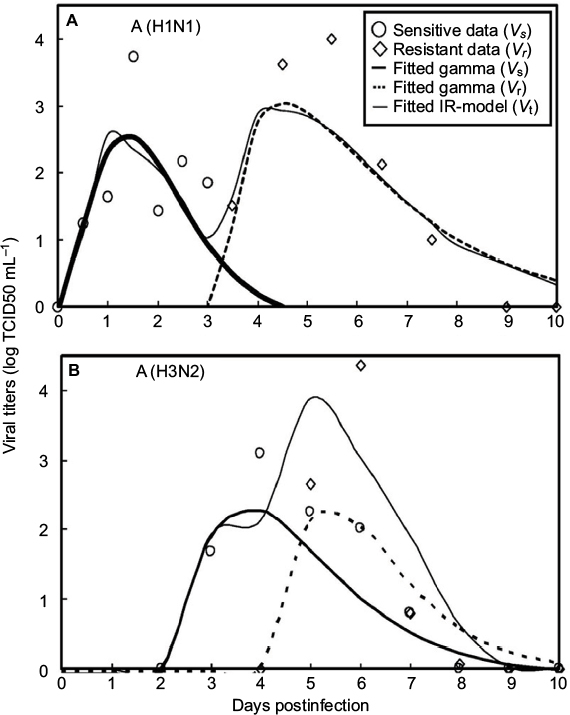 | Figure 2 Fitted gamma models for sensitive (Vs) and resistant (Vr) data and fitted IR-based viral dynamic model to total viruses (Vt) for (A) A (H1N1) adapted from Gubareva et al8 and (B) A (H3N2) adapted from Kiso et al.26 |
 | Table 1 Fitted gamma models to the study data of sensitive (Vs(t)) and resistant (Vr(t)) strains for A (H1N1) and A (H3N2) with the resulting fitted coefficients Notes: aGamma distribution is selected as the best-fitted model (Figure 2): f(t) = a + b exp (–(t – c)/d) x (((t – c)/d) + e – 1)/(e – 1) e–1. |
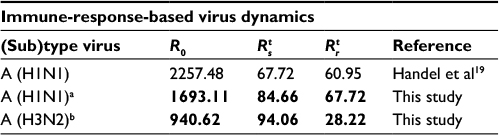
 | Table 2 Summary of parameter values used in the present IR-based virus dynamic model Notes: aOriginal data adapted from Handel et al19. Bold values denote values estimated by this study. Abbreviations: IR, immune response; TCID, tissue culture infective dose. |
Our results showed that the mutation rate per sensitive cell division (µ) was estimated to be 2.3×10⁻⁶ for A (H1N1) and 2.8×10⁻⁶ for A (H3N2) based on the initial number of uninfected epithelial cells of 4×10⁸. The fitness cost of resistance (c) was estimated to be 0.20 for A (H1N1) and 0.70 for A (H3N2). The IR growth rate (r) and antiviral efficacy (a) used to calculate the reproduction numbers of treated sensitive and resistant infected cells were estimated to be 0.85 d−1 and 0.95 for A (H1N1) and 0.70 d−1 and 0.90 for A (H3N2), respectively. The estimated virus production rate (p) was 9×10⁻⁶TCID50 d−1 mL−1 for A (H1N1) and 5×10⁻⁶TCID50 d−1 mL−1 for A (H3N2).
Table 3 shows that the estimates of basic reproduction numbers of treated sensitive infected cells () and treated resistant infected cells (), respectively, are 85 and 68 for A (H1N1) and 95 and 29 for A (H3N2), respectively. On the other hand, the estimated basic reproduction number of resistant infected cells for A (H1N1) was higher than that of A (H3N2). Note, however, that our estimates of A (H1N1) viruses were apparently close to the published data (Table 3).
 | Table 3 Basic reproduction numbers obtained from the published literature together with estimates obtained from this study Notes: Estimates obtained from this study are shown in bold. aOriginal data adapted from Gubareva et al8, bOriginal data adapted from Kiso et al.26 |
Generation and spread of resistance
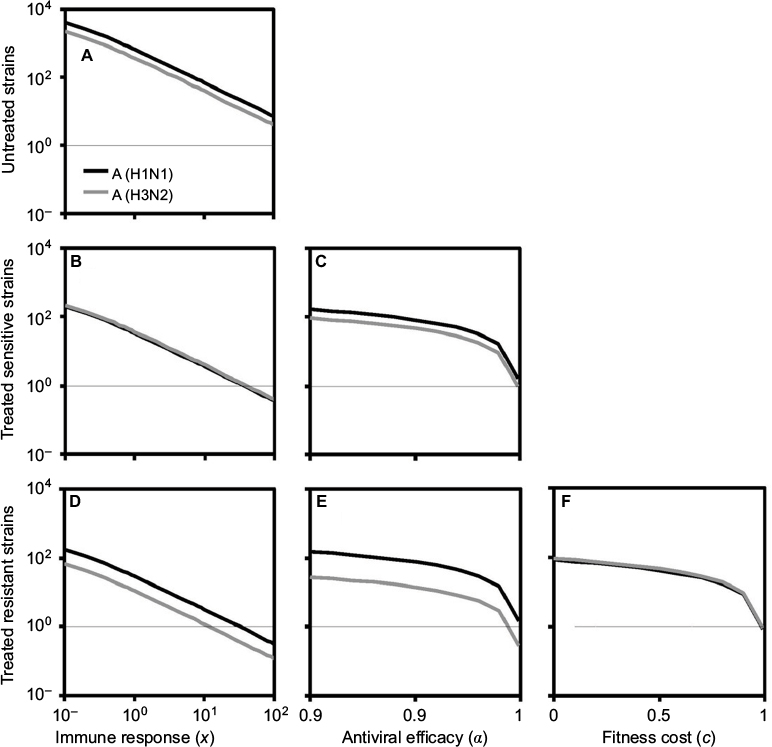
We began with the spread of sensitive strains before treatment described by R0 in Equation 7 for A (H1N1) and A (H3N2). We showed that an increase in IR greatly reduced the spread of sensitive strains. Under the specific antiviral efficacy for oseltamivir-treated A (H1N1) and A (H3N2) infections, the spread of sensitive strains decreased with the increase in IR in two different viral strains. The results showed that a similar extinction fashion for free virus generation (<1) may occur when IR reached 35.6 and 39.6 for A (H1N1) and A (H3N2), respectively. We showed the generation of sensitive strains under antiviral efficacies ranging from 0.9 to 1 for oseltamivir treatment, indicating that the treatment became effective when the antiviral efficacies ranged from 0.99 to 1.
As should be expected, the resistant strains decreased with the increase in IR, antiviral efficacy, and fitness cost. The extinction for generation of resistant A (H1N1) and A (H3N2) virus may occur when IR exceeded 32 and 11, respectively. On the other hand, oseltmivir-resistant strains for A (H3N2) and A (H1N1) decreased with the increase in antiviral efficacy, whereas A (H3N2) had better removing efficiency than A (H1N1). Both A (H1N1) and A (H3N2) viruses had the similar behavior in response to the variation in fitness cost, indicating that resistance strains decreased with the increase in fitness cost.
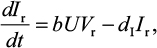
Figure 3 shows that sensitive and resistant infected cells of A (H1N1) and A (H3N2) as a function of days postinfection varied with the mutation rate ranging from 10−5 to 10−1. A different time course for sensitive infected cells of A (H1N1) and A (H3N2) was obvious (Figure 3B, C, E). We found out that when treatment was started 1 day after the infection for A (H1N1), the peak resistant infected cells were reduced to nearly 106 from 107; however, treatment on days 1–1.5 or later had little effect (Figure 3A).
 | Figure 3 Local sensitivity analysis for the sensitive and resistant infected cells of A (H1N1) and A (H3N2). Notes: The dynamics of (A) resistant and (B) sensitive infected cells for A (H1N1) varied with the mutation rate ranging from 10–5 to 10–1 where the thin, gray lines are the corresponding treatment day. (C) Enhanced details for sensitive infected cells during days 3–5. The time course of (D) resistant and (E) sensitive infected cells for A (H3N2) varied with the mutation rate ranging from 10–5 to 10–1. (F) The time course of resistant infected cells varied with the fitness cost from 0 to 1. |
On the other hand, the peak resistant infected cells of A (H3N2) reduced from nearly 8×10⁸ to 107 when drugs were administrated within 2–2.5 days after infection and had little impact when treatment started later than day 2.5 (Figure 3D). Overall, our results indicated that an antiviral drug affecting virus production was only effective when administrated within 1–2.5 days for A (H1N1) and A (H3N2) viruses.
Risk estimates of resistance
Here we performed an MC simulation with 10,000 iterations to Equation 12 to generate dose–response profiles describing the relationship between the probability of resistance and sensitive infected cells based on a mutation rate distribution for A (H1N1) and A (H3N2), respectively (Figure 4). Figure 4 indicates that the sensitive infected cells that caused 50% resistance probabilities were estimated to be 7.5×10⁵ (95% CI: 6.1×10⁵–9.5×10⁵) for A (H1N1) and 8.7×10⁵ (95% CI: 7.5×10⁵–1.1×10⁶) for A (H3N2).
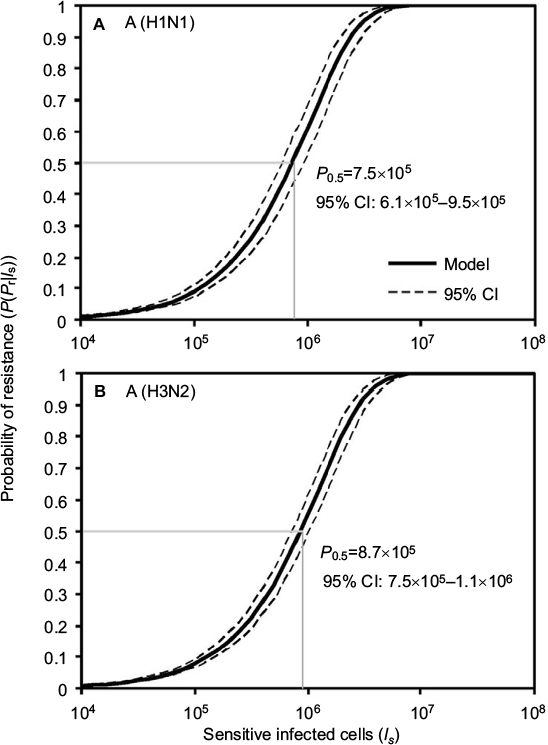 | Figure 4 Reconstructed dose–response relationships between the probability of resistance and sensitive infected cells for (A) A (H1N1) and (B) A (H3N2). |
Figure 5 demonstrates the predicted exceedance risks for A (H1N1) and A (H3N2) viruses under three sensitive infected cell distributions varying with mutation rates (µ) of 10−6–10−4 (Figure 5B–D, and F–H) based on the constructed response curves of resistance probability−sensitive infected cells (Figure 5). The results indicate that the probabilities that ≥50% of the resistance risk were induced by A (H1N1) sensitive infected cells were estimated to be 0.42 (95% CI: 0.35–0.49), 0.9 (95% CI: 0.86–0.94), and 1 for µ=10−6, 10−5, and 10−4, respectively (Figure 5A).
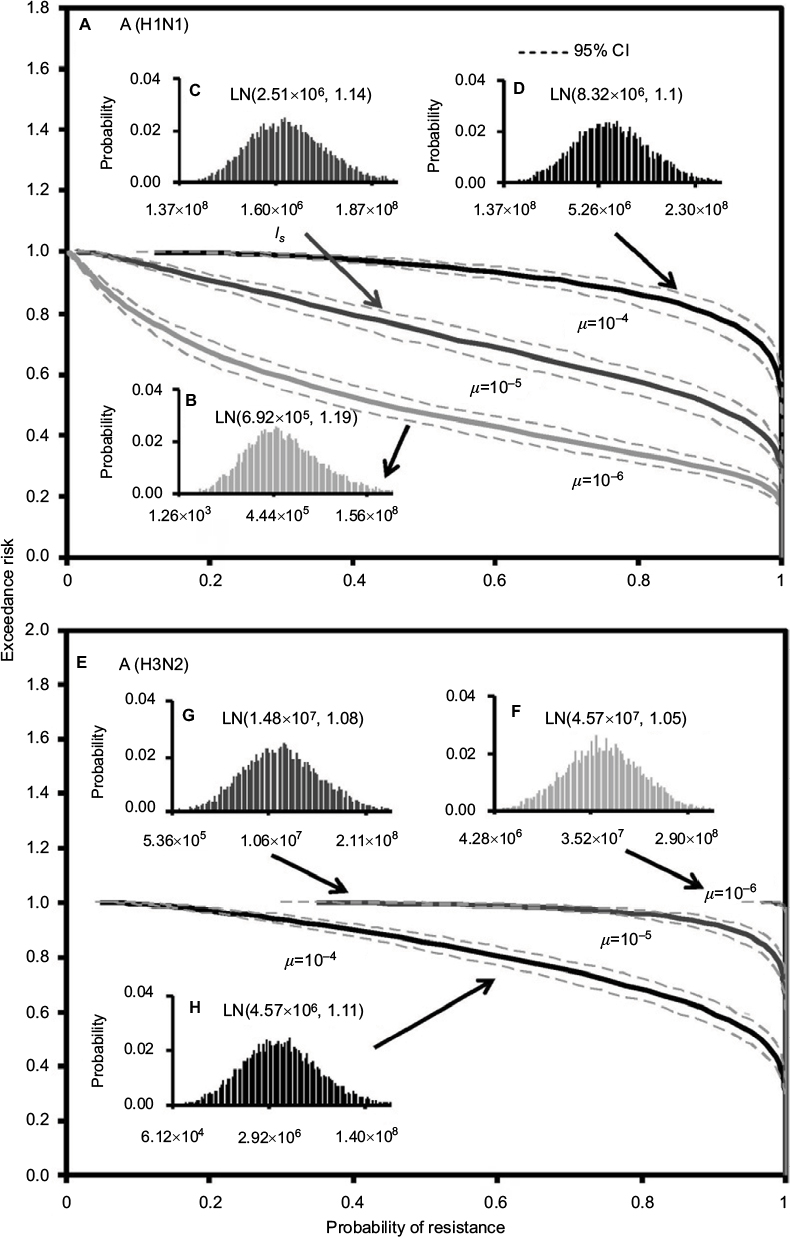 | Figure 5 Predicted exceedance risks of resistance probability for (A) A (H1N1) based on three different fitted lognormal (LN) distributions of sensitive infected cells (Is) varied with mutation rates of (B) μ=10–6, (C) μ=10–5, and (D) μ=10–4 as well as for (E) A (H3N2) at (F) μ=10–6, (G) μ=10–5, and (H) μ=10–4, respectively. |
On the contrary, for an exceedance risk of 0.5, A (H3N2) virus had 0.95 (95% CI: 0.93–0.99) and 1 of resistance probabilities caused by sensitive infective cells at µ=10−4 and 10−5–10−6, respectively (Figure 5E). Therefore, the results revealed that the risk of oseltamivir-induced resistance increased with the increase in the mutation rate for A (H1N1) virus, but not for A (H3N2) virus. The reason may due in part to the number of A (H3N2) sensitive infected cells increasing with the decrease in the mutation rate (Figures 3E and 5F–H).
Discussion
It is known that influenza viruses can develop resistance to oseltamivir that can prevent viral particles from being released by the infected human cells. The benefits of antiviral drug used to control an influenza pandemic may be reduced by the resistance in the virus. Thus, the purpose of this study was to assess the likely risk of resistance strains during an influenza pandemic and how they spread once they had emerged. The impact of antiviral drugs on the emergence and transmission of influenza infections was also presented mechanistically.
Mathematical models are useful tools to explore the complicated relationships of infectious disease transmission processes.33,34 In our experience, the accuracy of the estimates for the parameters can well govern the model dynamics.31 Good parameter estimates can help to understand the model predictions of the potential spread of influenza. Interpretation of available data from experimental infection studies can provide a platform to apply the mathematical model in disease prediction. Moreover, the dynamics of viral shedding following influenza virus infection are key factors when considering epidemic control measures.25,35
This study applied an IR-based virus dynamic model that builds on the past models of a target cell-limited model with delayed virus production introduced by Baccam et al25and Handel et al.19 The proposed model is capable of pointing to a mechanistic explanation for associations among epithelial cell, virus, and human IR levels. We first used the proposed IR-based virus dynamic model to fit the total sensitive and resistant data to obtain essential key parameters characterizing the viral dynamics. Then we used the present parameterized model to explore the generation and spread of resistance.
We found that IR growth rate is the key parameter to determine the growth of virus spread for sensitive and resistant strains. To estimate the IR-based basic reproduction number for sensitive and resistant infected cells, we further derived Equations 7–9 to better understand how IR affects virus generation. The parameter of IR growth rate (r) plays the crucial role in shaping the virus dynamics. The study result was consistent with the previous studies.36,37 In our model, the exponential growth variables reflect their capability on viral killing. The infected cell death rate was set in the constant value of 0.5 per day in this study, the equivalent of 2 days for infected cell’s survival time. The cellular IR also plays an important role in this part. As the cytotoxic T lymphocytes can kill cells that are already infected by the virus, the mechanism can be incorporated into the parameter estimates of infected cell death rate in our model.
Nevertheless, we did not use IR growth rate to calculate the basic reproduction number because the parameter was time varying. To calculate the basic reproduction number, we used initial IR to capture the initial conditions for virus spread. Although there had been limitation for the consideration of the relationship between IR growth rate and basic reproduction number, we attempted to use the variable of IR to characterize the generation of virus strains during infection. According to sensitivity analysis, the result showed that oseltamivir resistance for A (H1N1) was greater than that for A (H3N2).
In addition, antiviral efficacy (a) and fitness cost (c) were also the important model parameters in determining the spread of sensitive and resistant strains. The fitness cost can reflect the resistant virus survival probability in their mutation. Furthermore, it can influence the resistant strain generation. Das et al38 indicated that fitness costs can limit influenza A virus hemagglutinin glycosylation and restrict its deployment in immune evasion. Note, however, that the resistance strains did not grow to increase the danger of resistance generation with the increase in antiviral efficacy, although better treatment may remove the sensitive strains. Our study also revealed that increasing the fitness cost greatly reduced the spread of resistant strains for A (H1N1), whereas a change in fitness cost had little impact on the spread of A (H3N2) resistant strains. Collectively, we found that the three crucial parameters of r, a, and c can be improved to explain the virus spread and generation realistically. Moreover, the spread of resistant H1N1 virus in 2008 was because of a compensatory mutation that eliminated the fitness loss.
To limit viral infection and/or production, we also suggest that antiviral drugs must be administrated within 1–1.5 days for A (H1N1) and 2–2.5 days for A (H3N2) virus infections, with a benefit of combination therapy when administered early. Lee et al 39also suggested that lowering the viral load or spread within 2 days of infection allows the rapid control of the influenza A virus infection. The NA inhibitors inhibit viral release by infected cells but are only effective when given within 2 days of symptom onset.4,40
In this study, a probabilistic risk assessment model was developed by incorporating a branching process-derived probability distribution of resistance to estimate oseltamivir-induced resistance risk. Two key determinants govern the probabilistic risk model: 1) the mutation rate (µ) and 2) the number of sensitive infected cells (Is). Here the mutation rate can be used to link the numbers of resistant and sensitive cells. Thus, the probability of emergence depends on the probability of evolution and the probability that the evolved infections do not go extinct because of stochastic effects.29
We found that the probability of resistance depended most strongly on the number of sensitive infected cells that increased sigmoidally with the sensitive infected cells in a Poisson fashion. On the other hand, the risk of resistance depended strongly on the mutation rate, implicating that the mutation rate incorporated not only the mutation rate of virus but also its dynamics within the host and its transmissibility.30
The key findings of this study related to risk estimates of resistance were that 1) the average numbers of sensitive infected cells that caused 50% resistance probability were nearly 8×10⁵ for A (H1N1) and 9×10⁵ for A (H3N2), and 2) the risk of oseltamivir-induced resistance increased with the increase in mutation rate for A (H1N1) virus, but this outcome was not seen in A (H3N2) virus. Thus, to predict the virus-specific oseltamivir-induced resistance risk, we have to take into account both the mutation rate and the number of sensitive infected cells.
The reasonable estimation of model parameters is important in the biological modeling. In view of the previous research, the mutation rate at which NI-resistant mutants were produced for influenza A had been estimated to be nearly 2×10⁻⁶–7×10−5.41–43 Based on our simulations, we estimated the mutation rates to be 2.3×10⁻⁶ and 2.8×10⁻⁶ for H1N1 and H3N2, respectively. Based on the computational experiment results for viral load data with resistant mutants, the obtained fitness cost ranged from 9% to 49% for different mutants.19,44 Our result shows that the fitness costs were 20% and 70% for H1N1 and H3N2, respectively. The IR growth rates were assumed to be a simple rate constant and independent of viral loads, whereas the best-fitted result shows that the IR growth rates were 0.85 and 0.7 for H1N1 and H3N2, respectively. Moreover, the 95% CI of virus production rate ranged between 8.8×10⁻⁶ and 8.3×10⁻⁵ from the human experimental influenza infection examination.25 In our estimation, the virus production rates were 9×10⁻⁶ and 5×10⁻⁶ for H1N1 and H3N2, respectively. The lag times of resistant virus and antiviral efficacy were dependent on the pharmaceutical properties and different subtypes of influenza virus. The estimation values were slightly different with the previous study yet still in the reasonable range.
We think that the parameter comparison between the study results from our current research and Handel et al19 would be sufficient if these two similar parameter estimations can be well fitted to the different datasets of viral shedding. Although in vitro data study data could be useful in comparing and verifying the modeling results, the in vivo test that incorporated with model simulations could be more effective in the current study.
Data gaps are the limitation of the model. Because of the limited clinical data for oseltmivir-resistant experiment, we adopted two valuable datasets Gubareva et al8 and Kiso et al,26 which can represent oseltmivir-resistant A (H1N1) and A (H3N2), respectively. Although the unrealistic assumptions may occur in our parameter estimation, we compared the estimated parameters from Handel et al19 to reduce the differences and to approximate the real situation.
The population variability could cause the different oseltamivir-induced resistance risk for influenza infection. The age ranges of our examining data for H1N1 were sourced from adult population aged from 18 to 40 years. However, the H3N2 experimental data were mainly for children aged from 2 months to 15.8 years. The data limitation may have several effects on our parameter estimations and study results. As the lack of consistent data could currently prevent us from obtaining quantitative results, more experimental viral shedding data are needed in future studies.
Our model is parsimony of a complex biological process. The validation of the assumptions made in constructing the model and the parameter values used to perform it affect its accuracy. The model could be improved further by direct experimental verification of those parameters, particularly those for which direct measurements were not available. It is obvious that several of the model predictions will need to be experimentally tested. Although we selected two valuable datasets for distinguishing the sub(type) and geographic effects on oseltamivir-induced resistance risk of generation and spread, we would like to stress the importance of publishing detailed quantitative data on the dynamics of sensitive and resistant strains and dose–response relationships between sensitive infected cells and the probability of resistance.
It is also important to estimate the growth and death rates of sensitive and resistant infected cells during administration of antiviral drugs. Moreover, if the parameters of the model can also be estimated from treatment or prophylaxis, then the model can be applied to these control choices to provide the best control strategy to prevent resistance emergence. Therefore, this methodology together with key parameters derived experimentally can aid the design of optimum administration strategies of treatment options for sub(type) influenza viruses that evolve resistance.
There are some practical implications of this study. First, our results implicated that if we are able to detect an outbreak early and intervene quickly, it might be possible to control a sensitive outbreak and to prevent the emergence and spread of resistance. On the other hand, if control measures are not able to contain the outbreak, or intervention is not quick enough, then the emergence of resistance is very likely. Therefore, to carefully assess intervention methods that take into account drug availability, as well as detailed in drug delivery, for example, at what day postinfection people start taking the drug, for how long they continue to do so, and how that affects transmission, more detailed models are required.19–24
Second, our study suggests that the risk of resistance would be considered into pandemic planning and monitored closely during a pandemic.20 Although predicting whether resistance will disappear, persist, or increase in the next season is difficult, our findings suggest that resistance risk increase should be included in the decision-making process for prevention of influenza. Future modeling studies should also address other relevant issues such as the use of oseltamivir–zanamivir combination or cycling therapy approaches to retain the protection offered by current antiviral drugs.11,45
Acknowledgment
The authors acknowledge the financial support of the Ministry of Science and Technology, Republic of China, under Grant MOST 104-2221-E-002-030-MY3.
Author contributions
All authors contributed toward data analysis, drafting, and revising the paper, and agree to be accountable for all aspects of the work.
Disclosure
The authors report no conflicts of interest in this work.
References
Johnson NP, Mueller J. Updating the accounts: global mortality of the 1918-1920 “Spanish” influenza pandemic. Bull Hist Med. 2002;76(1):105–115. | ||
Wan PAL, Farndon P, Palmer N. Maximizing the value of drug stockpiles for pandemic influenza. Emerg Infect Dis. 2009;15:1686–1687. | ||
Moscona A. Global transmission of oseltamivir-resistant influenza. N Engl J Med. 2009;360(10):953–956. | ||
Tonelli M, Cichero E. Fight against H1N1 influenza A virus: recent insights towards the development of druggable compounds. Curr Med Chem. 2016;23(18):1802–1817. | ||
Liu C, Eichelberger MC, Compans RW, Air GM. Influenza type A virus neuraminidase does not play a role in viral entry, replication, assembly, or budding. J Virol. 1995;69(2):1099–1106. | ||
Suzuki T, Takahashi T, Guo CT, et al. Sialidase activity of influenza A virus in an endocytic pathway enhances viral replication. J Virol. 2005;79(18):11705–11715. | ||
Matrosovich MN, Matrosovich TY, Gray T, Roberts NA, Klenk HD. Neuraminidase is important for the initiation of influenza virus infection in human airway epithelium. J Virol. 2004;78(22):12665–12667. | ||
Gubareva LV, Kaiser L, Matrosovich MN, Soo-Hoo Y, Hayden FG. Selection of influenza virus mutants in experimentally infected volunteers treated with oseltamivir. J Infect Dis. 2001;183(4):523–531. | ||
Russell RJ, Haire LF, Stevens DJ, et al. The structure of H5N1 avian influenza neuraminidase suggests new opportunities for drug design. Nature. 2006;443(7107):45–49. | ||
Collins PJ, Haire LF, Lin YP, et al. Crystal structures of oseltamivir-resistant influenza virus neuraminidase mutants. Nature. 2008;453(7199):1258–1261. | ||
Wu JT, Leung GM, Lipsitch M, Cooper BS, Riley S. Hedging against antiviral resistance during the next influenza pandemic using small stockpiles of an alternative chemotherapy. PLoS Med. 2009;6(5):e1000085. | ||
Cheng PK, Leung TW, Ho EC, et al. Oseltamivir- and amantadine-resistant influenza viruses A (H1N1). Emerg Infect Dis. 2009;15(6):966–968. | ||
Hurt AC, Holien JK, Parker MW, Barr IG. Oseltamivir resistance and the H274Y neuraminidase mutation in seasonal, pandemic and highly pathogenic influenza viruses. Drugs. 2009;69(18):2523–2531. | ||
Meijer A, Lackenby A, Hungnes O, et al. Oseltamivir-resistant influenza virus A (H1N1), Europe, 2007–08 season. Emerg Infect Dis. 2009;15(4):552–560. | ||
Kiso M, Shinya K, Shimojima M, et al. Characterization of oseltamivir-resistant 2009 H1N1 pandemic influenza A viruses. PLoS Pathog. 2010;6(8):e1001079. | ||
Ujike M, Shimabukuro K, Mochizuki K, et al. Oseltamivir-resistant influenza viruses A (H1N1) during 2007–2009 influenza seasons, Japan. Emerg Infect Dis. 2010;16(6):926–935. | ||
Chen H, Cheung CL, Tai H, et al. Oseltamivir-resistant influenza A pandemic (H1N1) 2009 virus, Hong Kong, China. Emerg Infect Dis. 2009;15(12):1970–1972. | ||
Regoes RR, Bonhoeffer S. Emergence of drug-resistant influenza virus: population dynamical considerations. Science. 2006;312(5772):389–391. | ||
Handel A, Longini IM Jr, Antia R. Neuraminidase inhibitor resistance in influenza: assessing the danger of its generation and spread. PLoS Comput Biol. 2007;3(12):e240. | ||
Lipsitch M, Cohen T, Murray M, Levin BR. Antiviral resistance and the control of pandemic influenza. PLoS Med. 2007;4(1):e15. | ||
Moghadas SM, Bowman CS, Röst G, Wu J. Population-wide emergence of antiviral resistance during pandemic influenza. PLoS One. 2008;3(3):e1839. | ||
Eichner M, Schwehm M, Duerr HP, et al. Antiviral prophylaxis during pandemic influenza may increase drug resistance. BMC Infect Dis. 2009;9:4. | ||
Van Den Dool C, Hak E, Bonten MJ, Wallinga J. A model-based assessment of oseltamivir prophylaxis strategies to prevent influenza in nursing homes. Emerg Infect Dis. 2009;15(10):1547–1555. | ||
Handel A, Longini IM Jr, Antia R. Antiviral resistance and the control of pandemic influenza: the roles of stochasticity, evolution and model details. J Theor Biol. 2009;256(1):117–125. | ||
Baccam P, Beauchemin C, Macken CA, Hayden FG, Perelson AS. Kinetics of influenza A virus infection in humans. J Virol. 2006;80(15):7590–7599. | ||
Kiso M, Mitamura K, Sakai-Tagawa Y, et al. Resistant influenza A viruses in children treated with oseltamivir: descriptive study. Lancet. 2004;364(9436):759–765. | ||
Nowark MA, May RM. Virus Dynamics: Mathematical Principles of Immunology and Virology. Oxford: Oxford University Press; 2000. | ||
Foo J, Michor F. Evolution of resistance to targeted anti-cancer therapies during continuous and pulsed administration strategies. PLoS Comput Biol. 2009;5(11):e1000557. | ||
Taylor HM, Karlin S. An Introduction to Stochastic Modeling. Waltham, MA: Academic Press; 1994. | ||
Antia R,Regoes RR, Koella JC, Bergstrom CT. The role of evolution in the emergence of infectious diseases. Nature. 2003;426(6967):658–661. | ||
Liao CM, Yang SC, Chio CP, Chen SC. Understanding influenza virus-specific epidemiological properties by analysis of experimental human infections. Epidemiol Infect. 2010;138(6):825–835. | ||
Liao CM, Hsieh NH, Chio CP, Chen SC. Assessing the exacerbations risk of influenza-associated chronic occupational asthma. Risk Anal. 2010;30(7):1062–1075. | ||
Canini L, Conway JM, Perelson AS, Carrat F. Impact of different oseltamivir regimens on treating influenza A virus infection and resistance emergence: insights from a modelling study. PLoS Comput Biol. 2014;10(4):e1003568. | ||
Chen SC, Hsieh NH, You SH, Wang CH, Liao CM. Behavioural response in educated young adults towards influenza A (H1N1) pdm09. Epidemiol Infect. 2015;143(9):1846–1857. | ||
Hayden FG, Fritz R, Lobo MC, Alvord W, Strober W, Straus SE. Local and systemic cytokine responses during experimental human influenza A virus infection. Relation to symptom formation and host defense. J Clin Invest. 1998;101(3):643–649. | ||
Dobrovolny HM, Reddy MB, Kamal MA, Rayner CR, Beauchemin CA. Assessing mathematical models of influenza infections using features of the immune response. PLoS One. 2013;8(2):e57088. | ||
Ben-Shachar R, Koelle K. Minimal within-host dengue models highlight the specific roles of the immune response in primary and secondary dengue infections. J R Soc Interface. 2015;12(103):20140886. | ||
Das SR, Hensley SE, David A, et al. Fitness costs limit influenza A virus hemagglutinin glycosylation as an immune evasion strategy. Proc Natl Acad Sci U S A. 2011;108(51):E1417–E1422. | ||
Lee N, Chan PK, Hui DS, et al. Viral loads and duration of viral shedding in adult patients hospitalized with influenza. J Infect Dis. 2009;200(4):492–500. | ||
De Clercq E. Antiviral agents active against influenza A viruses. Nat Rev Drug Discov. 2006;5(12):1015–1025. | ||
Parvin JD, Moscona A, Pan WT, Leider JM, Palese P. Measurement of the mutation rates of animal viruses: influenza A virus and poliovirus type 1. J Virol. 1986;59(2):377–383. | ||
Drake JW. Rates of spontaneous mutation among RNA viruses. Proc Natl Acad Sci U S A. 1993;90(9): 4171–4175. | ||
Nobusawa E, Sato K. Comparison of the mutation rates of human influenza A and B viruses. J Virol. 2006;80(7):3675–3678. | ||
Yen HL, Herlocher LM, Hoffmann E, et al. Neuraminidase inhibitor-resistant influenza viruses may differ substantially in fitness and transmissibility. Antimicrob Agents Chemother. 2005;49(10):4075–4084. | ||
Duval X, van der Werf S, Blanchon T, et al. Efficacy of oseltamivir-zanamivir combination compared to each monotherapy for seasonal influenza: a randomized placebo-controlled trial. PLoS Med. 2010;7(11):e1000362. |
 © 2017 The Author(s). This work is published and licensed by Dove Medical Press Limited. The full terms of this license are available at https://www.dovepress.com/terms.php and incorporate the Creative Commons Attribution - Non Commercial (unported, v3.0) License.
By accessing the work you hereby accept the Terms. Non-commercial uses of the work are permitted without any further permission from Dove Medical Press Limited, provided the work is properly attributed. For permission for commercial use of this work, please see paragraphs 4.2 and 5 of our Terms.
© 2017 The Author(s). This work is published and licensed by Dove Medical Press Limited. The full terms of this license are available at https://www.dovepress.com/terms.php and incorporate the Creative Commons Attribution - Non Commercial (unported, v3.0) License.
By accessing the work you hereby accept the Terms. Non-commercial uses of the work are permitted without any further permission from Dove Medical Press Limited, provided the work is properly attributed. For permission for commercial use of this work, please see paragraphs 4.2 and 5 of our Terms.