")
Back to Journals » International Journal of Nanomedicine » Volume 11
Development of nanostars as a biocompatible tumor contrast agent: toward in vivo SERS imaging
Authors D'Hollander A, Mathieu E, Jans H, Vande Velde G, Stakenborg T, Van Dorpe P, Himmelreich U, Lagae L
Received 28 June 2015
Accepted for publication 4 March 2016
Published 4 August 2016 Volume 2016:11 Pages 3703—3714
DOI https://doi.org/10.2147/IJN.S91340
Checked for plagiarism Yes
Review by Single anonymous peer review
Peer reviewer comments 3
Editor who approved publication: Dr Thomas Webster
Antoine D’Hollander,1–3 Evelien Mathieu,1,4 Hilde Jans,1 Greetje Vande Velde,2,3 Tim Stakenborg,1 Pol Van Dorpe,1,4 Uwe Himmelreich,2,3 Liesbet Lagae1,4
1Department of Life Science Technology, Imec, 2Department of Imaging and Pathology, Faculty of Medicine, Biomedical MRI Unit, 3Faculty of Medicine, Molecular Small Animal Imaging Center (MoSAIC), 4Department of Physics, Faculty of Sciences, Laboratory of Solid State Physics and Magnetism, KU Leuven, Leuven, Belgium
Abstract: The need for sensitive imaging techniques to detect tumor cells is an important issue in cancer diagnosis and therapy. Surface-enhanced Raman scattering (SERS), realized by chemisorption of compounds suitable for Raman spectroscopy onto gold nanoparticles, is a new method for detecting a tumor. As a proof of concept, we studied the use of biocompatible gold nanostars as sensitive SERS contrast agents targeting an ovarian cancer cell line (SKOV3). Due to a high intracellular uptake of gold nanostars after 6 hours of exposure, they could be detected and located with SERS. Using these nanostars for passive targeting after systemic injection in a xenograft mouse model, a detectable signal was measured in the tumor and liver in vivo. These signals were confirmed by ex vivo SERS measurements and darkfield microscopy. In this study, we established SERS nanostars as a highly sensitive contrast agent for tumor detection, which opens the potential for their use as a theranostic agent against cancer.
Keywords: SERS, gold nanostars, cancer imaging, Raman active
Introduction
Diagnosing cancer at an early stage by improved imaging approaches may contribute to increased survival of cancer patients. Optical imaging techniques such as surface-enhanced Raman scattering (SERS) have become more popular in this field where the optical selectivity is used for better tumor-tissue discrimination. SERS exploits the enhanced Raman scattering by bringing a Raman-active molecule close to a metal surface such as on gold nanoparticles. Owing to this, an enhancement by 1010–12 of the Raman signal compared to unlabeled nanoparticles could be realized.1 As a consequence, SERS has made its way into the biomedical field since the technique enables a very sensitive detection of molecules and easy discrimination based on a fingerprint spectrum.
On the one hand, SERS has been introduced for the detection of analytes in a label-free manner where they interact with the metal surface, while on the other hand, SERS-active nanostructures, where Raman-active molecular labels are already coupled to the surface, are used as “SERS labels”, similar to fluorescent labels. SERS offers several advantages compared with conventional fluorescent labels due to their structure sensitivity and absence of photodecomposition.2,3 Examples for the successful use of the Raman labeling approach are the discrimination of different cell types, viruses, and other lab-on-a-chip applications.4–9 Also in vivo, these SERS-active structures, such as nanorods or nanospheres, have shown the potential to discriminate these labels inside different tissues.10,11
Gold nanoparticles have been extensively studied as potential SERS contrast agents for cancer diagnosis.7,10–16 The SERS imaging technique depends on the enhancement factor of the nanoparticle’s Raman signal by creating local high electric fields. For enhancing the Raman signal, several shapes have been introduced, ranging from nanorods, nanostars, dimers, and others.11 All these nanoparticles are equipped with sharp tips that generate high electric fields upon irradiation.17 In particular, nanostars have several sharp tips, which make them efficient surfaces/carriers of SERS labels and enables detection down to pM concentrations.18,19 In vitro applications of sensitive SERS imaging using nanostars have been demonstrated for the study of cellular pathways, intracellular pH sensing, or the detection of specific cells in histology sections.20–22 Despite their high sensitivity, the use of nanostars as SERS contrast agents has not been pursued in vivo, to the best of our knowledge.
In this study, we intend to use the high sensitivity of these nanostars, compared with other nanoparticle shapes, as an in vivo diagnostic agent for the detection of cancer cells. For this, the nanostars have to be decorated with SERS reporters. This is not as straight forward as it sounds, as changing the coating of the nanostars may affect their stability under physiological conditions. Using in vitro experiments, we evaluated the properties and the potential of SERS-labeled nanostars to passively target tumor cells. By an in vivo passive targeting strategy, SERS was used to evaluate accumulation of nanostars in the tumor by the enhanced permeability and retention effect.23,24
Materials and methods
Nanostars synthesis and functionalization
Gold nanostars were prepared based on the procedure described by Hao et al25 and further optimized according to Van de Broek et al.26 In brief, 2 mg bis(sulfonatophenyl) phenylphosphine dihydrate dipotassium (Strem Chemicals, Newburyport, MA, USA) and 100 μL H2O2 (30% v/v, Air Products, Vilvoorde, Belgium) were added to 50 mL 6.8 mM aqueous sodium citrate solution (Acros Organics, Geel, Belgium). Next, 100 μL of 0.075 M HAuCl4 (Acros Organics) was added slowly under constant stirring at room temperature. Compared with previously published articles, by using an Atlas Syringe Pump (Syrris, Ruisbroek, Belgium), a slower addition rate of 12.5 μL/min was used in order to achieve the desired shape and size.25 The 50 mL gold nanostar suspension was centrifuged at 4,500 rpm for 1 hour, and the pellet was resuspended in 10 mL of water. For functionalizing the nanostars with a Raman-active label, 100 μL NaOH (0.5 M) and 1 mL of the desired DTNB concentration was added to the nanostar suspension. After 1.5 hours of shaking, the nanostar suspension was centrifuged for 60 minutes at 4,500 rpm, the supernatant was discarded, and the nanostar pellet resuspended in water. Then, the nanostars were functionalized with self-assembled monolayer (SAM) (HS–(CH2)11–(O–CH2–CH2)6–O–CH2–C4H3NO2)2 according to the same protocol as used for the DTNB label. After functionalization, these nanostars were characterized using ultraviolet–visible absorption spectroscopy (Shimadzu UV-1601PC, Brussels, Belgium), dynamic light scattering (Zetasizer Nano ZS90 DLS, Malvern Nanosizer, Malvern, UK), and transmission electron microscopy (TEM; Tecnai F30, FEI Company, Eindhoven, the Netherlands).
To evaluate their SERS imaging capabilities, the nanostars were either dried on a silicon wafer overnight or loaded into an agar phantom.27 These nanostars were visualized using Raman microscopy (type alpha 300R, WITec, Ulm, Germany; [785 nm, 40 mW, 5 seconds integration time, raster of 40×40 μm]).
Cell culture
SKOV3 cells (ATCC® HTB77, Cedex, France) were cultured in medium (Roswell Park Memorial Institute) 1640 medium supplemented with 10% fetal calf serum, 50 units/L penicillin, 50 μg/mL streptomycin, and 2 mM l-glutamine. Cells were incubated at 37°C in 5% CO2 environment. All cell culture reagents were obtained from Thermo Fisher Scientific (Waltham, MA, USA). The SKOV3 cells were transduced with a lentiviral vector (LV-CMV-eGFP-T2A-fLuc) to stably express eGFP and firefly luciferase.28
Darkfield and Raman microscopy of cell–nanostar interaction
Tumor cells (SKOV3) were seeded with 150,000 nanostars per well in a 12-well plate to study the cell–nanostar interaction. After 24 hours, nanostars with different SAMs (2.3×10¹⁰ particles in 1 mL) were added to the cells and incubated for 3 hours, 6 hours, and 24 hours. After washing with phosphate-buffered saline (PBS), these cells were again incubated overnight with fresh medium. After trypsinization, 300 μL of the cell suspension was either acid digested for inductively coupled plasmon – optical emission spectrometry (ICP-OES) or plated on a coverslip in 1 mL of fresh medium in a 12-well plate and incubated overnight. After fixation with 4% paraformaldehyde in PBS, these coverslips were mounted on a glass slide and visualized by darkfield microscopy (Olympus BX51 equipped with a U-DCW condenser; Olympus, Berchem, Belgium) or Raman microscopy (type alpha 300R, WITec; 785 nm, 40 mW, 5 seconds integration time, raster of 40×40 μm).
Evaluation of in vivo biodistribution
Female Hsd:Athymic Nude-Foxn1nu mice were used (8 weeks; Harlan, Horst, the Netherlands) for these experiments. All animal experiments were approved by the local animal ethics committee of the KU Leuven and were performed according to the national and European regulations. The animals were kept in individually ventilated cages with food and water ad libitum. During all imaging experiments, tumor cells and nanostar injections, the animals were anesthetized with 1.5% isoflurane in 100% O2. The body temperature and respiration rate were monitored and maintained at 37°C and 80–120 minute−1, respectively. A total of 1×10⁷ SKOV3 tumor cells suspended in 100 μL were injected into each hind limb of the mice and left for 2 weeks to grow into solid tumors.29 These tumors (size >150 μm3) were validated using magnetic resonance imaging (MRI) and bioluminescence imaging (BLI).
MRI data acquisition and processing were similar to previous reports.30 In brief, in vivo MRI was performed using a 9.4 T small animal MRI system (BioSpec, Bruker Biospin, Ettlingen, Germany) equipped with a gradient insert and a maximum gradient strength of 600 mT/m. A quadrature transmit–receive coil (Bruker Biospin) with an inner diameter of 7 cm was used for data acquisition. The MRI protocol included a spin echo sequence with repetition time =6,000 ms, echo time =15.8 ms, matrix =200×200 mm, field of view 40×40 mm, slice thickness =0.5 μm and 40 slices.
BLI experiments were performed with an IVIS 100 imaging system (PerkinElmer Inc., Waltham, MA, USA). The mice were injected intravenously (iv) with D-luciferin (126 mg/kg body weight, Promega Corporation, Fitchburg, WI, USA) dissolved in PBS (15 mg/kg). Afterward, they were placed in the IVIS 100 imaging system, and one image frame per second was acquired until a signal intensity plateau was reached. The following settings were used: 1 second exposure time, field of view of 10 cm, binning of 4, and an frame per stop of 8. For in vivo quantification of fLuc reporter gene activity, the data were analyzed as photon flux per second (p/s) from an 1 cm2 circular region of interest located on the tumor using the Living Image software (version 2.50.1, PerkinElmer Inc.). The signal intensity values at different time points (day 0, 1, 5, 8, and 15) were presented relative to the BLI signal of the same mouse at day 0.
After formation of tumors, nanostars (200 μL, 2.3 mg Au/mL) were injected via the tail vein (n=3). After 3 hours, the mice were imaged with Raman microscopy (785 nm, 40 mW, 60 seconds integration time, raster of 40×40 μm) at specific locations: tumor, liver, and skin tissue. Subsequently, the animals were sacrificed and transcardially perfused with 4% paraformaldehyde. The liver, spleen, kidneys, and tumors were dissected and stored in PBS with 0.1% sodium azide (Sigma-Aldrich Co., St Louis, MO, USA). These organs and tumors were visualized ex vivo using the Raman Witeq microscope with the same settings as for the in vivo experiments. For darkfield microscopy, the dissected organs were embedded in paraffin to make sections of 7 μm thickness with a microtome (HM360, Prosan, Merelbeke, Belgium). The sections were placed on microscope slides and deparaffinized before darkfield microscopy.
Results
Nanostar synthesis and functionalization
Nanostars are synthesized so that they absorb light in the near-infrared region approximately 665±9.7 nm with an average hydrodynamic diameter of 66.3±7.8 nm. TEM shows the anisotropic shape of the nanostars (Figure S1). The synthesis and characterization by ultraviolet–visible absorption spectroscopy, dynamic light scattering, and TEM have been described previously.31,32 DTNB was chosen as a SERS label as it has a high Raman cross-section, high reactivity to gold surfaces, and has been used previously.33–37 To find the optimal DTNB concentration for functionalizing the nanostars with this label, a range of concentrations (10 mM, 1 mM, 0.1 mM, 0.01 mM, and 0.001 mM) was tested on these nanostars. An optimal concentration of 0.1 mM was chosen since it did not affect the stability of the nanostars. A broadening and decrease of intensity of the localized surface plasmon resonance (LSPR) band occurred at higher concentrations, indicating instability of the nanostars (Figure S2). This instability was confirmed by a very large hydrodynamic diameter increase of 21.04±0.84 nm when functionalizing the nanostars with 10 mM DTNB (Table S1). Moreover, starting at a functionalization concentration of 0.1 mM, a second band appeared in the absorption spectrum at ~412 nm due to the creation of 3-thio-6-nitrobenzoate (TNB−) molecules in the solution. The successful functionalization of these nanostars with the DTNB molecule was confirmed by a red shift of the absorption band due to a change in the refractive index38 and increase in the hydrodynamic diameter by 8.14±0.63 nm. With only the DTNB label on the nanostar surface, the nanostars are only stable in salt concentrations up to 0.03 M NaCl, losing the blue suspension color at higher salt concentrations (Figure S3).
For increasing the stability under physiological conditions, the nanostars were functionalized afterward with SAM. As for the DTNB functionalization, a red shift in the LSPR band (5.30±1.66 nm) and an increase in the hydrodynamic diameter (6.12±1.57 nm) were measured after SAM functionalization (Figure 1). Nanostars functionalized with a SAM molecule are stable up to a concentration of 1 M NaCl, maintaining their blue color (Figures 1 and S3). After functionalization, the nanostars had an anionic zeta potential of −33.3±3.4 mV.
 | Figure 1 Characterization of the gold nanostars using UV-Vis absorption spectroscopy. |
Due to functionalization with SAM molecules, Raman labels on the nanostars could be replaced. Therefore, the SERS contrast generation (parameters: 785 nm, 40 mW, and 10 seconds integration time) was measured using dried nanostars on a silicon wafer, either from nanostars functionalized with DTNB and SAM or nanostars only functionalized with SAM. As shown in Figure 2, a DTNB Raman spectrum free of contaminating signals could be recorded from the nanostars functionalized with DTNB and SAM, with the highest intensity at 1,333 cm−1, resulting in an spectrum that was identical to what had previously been described in the literature.33,34,39,40 This confirms that the SAM molecules did not replace all the DTNB molecules on the nanostars. As expected for the nanostars–SAM, no SERS signal could be measured.
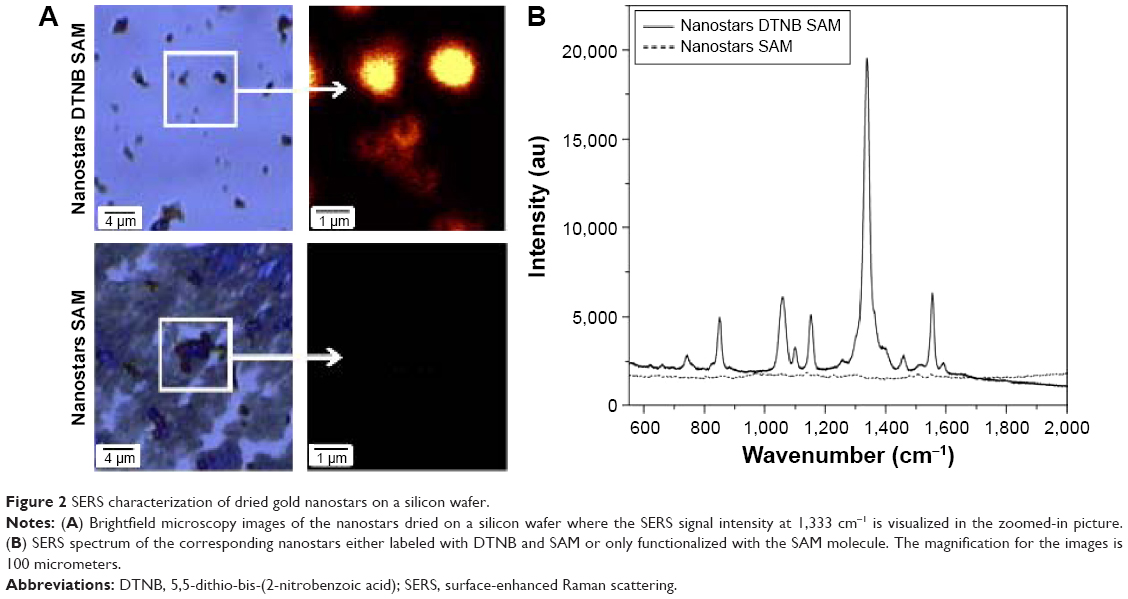 | Figure 2 SERS characterization of dried gold nanostars on a silicon wafer. |
To evaluate the SERS capabilities of nanostars for later in vivo applications, the sensitivity of SERS detection for the different nanostar concentrations (250 μM, 125 μM, 62.5 μM, 31.3 μM, 15.7 μM Au) was evaluated after loading them into an agar phantom. During SERS imaging, they were irradiated with a continuous laser (785 nm, 40 mW, and 60 seconds integration time). A detectable DTNB spectrum was measured with the maximum intensity at 1,333 cm−1 for all nanostar concentrations of the phantom (Figure 3). When plotting the intensity at 1,333 cm−1 for the different gold concentrations, a linear relation was deducted between the Raman intensity and gold concentration. Using a linear fit, a limit of detection (LOD) of 13 μM was calculated.
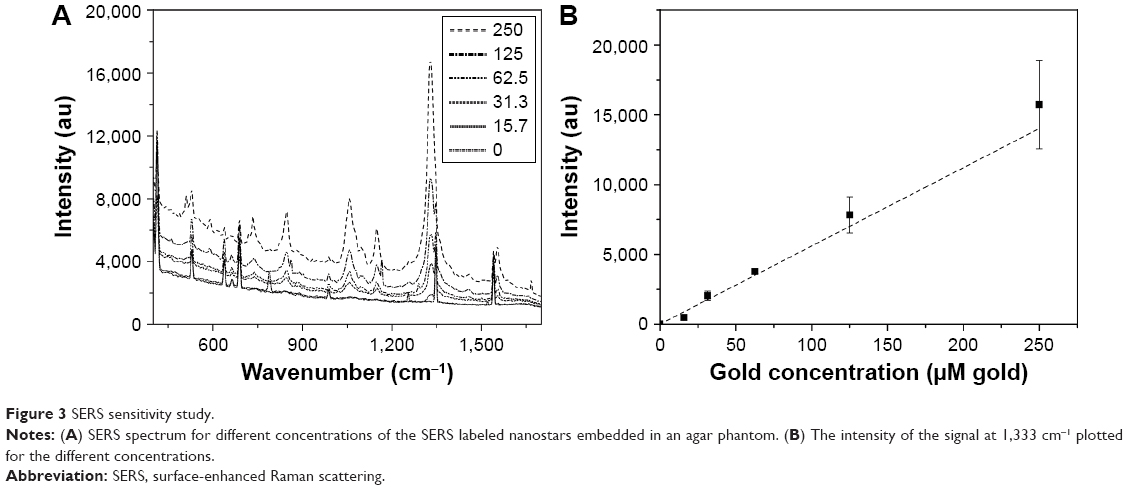 | Figure 3 SERS sensitivity study. |
SERS to visualize the nanoparticle uptake in cultured tumor cells
Prior to using these nanostars in vivo, the in vitro uptake by SKOV3 tumor cells was studied. After 3 hours, 6 hours, and 24 hours of incubation, the increase in the intracellular amount of nanostars was visualized by darkfield microscopy and quantified by ICP-OES. The gold quantity increased over time, going from 1.3±0.9 pg Au/cell after 3 hours to 4.4±0.68 pg Au/cell after 6 hours and to 8.05±1.1 pg Au/cell measured after 24 hours, compared with 0.1±0.05 pg Au/cell for the cells without nanostar labeling using ICP-OES. Darkfield microscopy confirmed the intracellular uptake of nanostars (Figure 4) the TEM images also confirms the intracellular uptake of the nanostars in the cells (Figure S4).
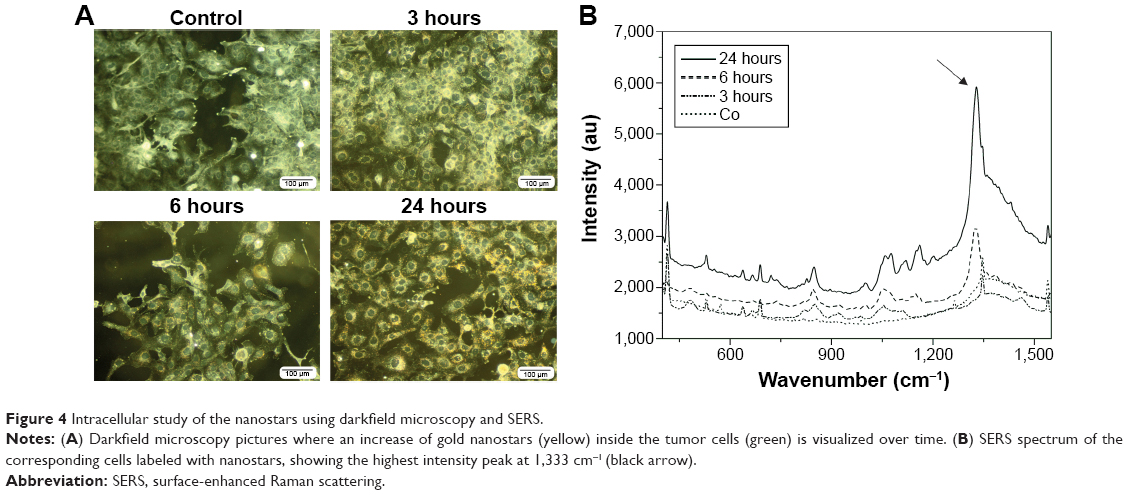 | Figure 4 Intracellular study of the nanostars using darkfield microscopy and SERS. |
On these time points, we also acquired the SERS spectra of the cultured cells by raster scanning with a resolution of 1 μm. Under these conditions, the Raman spectra are dominated by the SERS signal of the nanostars. When acquiring the SERS spectra of the cells labeled for 6 hours and 24 hours with nanostars, a clear SERS signal was measured (Figure 4). A distinct peak at 1,333 cm−1 was detected, which was absent for the spectrum of unlabeled control cells. The strongest SERS response was observed after 24 hours of labeling. Together with the higher Au concentration measured after 24 hours of incubation, this indicates that the SERS label did not detach or exocytose from the nanostars after intracellular uptake. After 3 hours, no distinct Raman peak was seen despite the presence of a small number of nanostars inside the tumor cells, as indicated by darkfield microscopy. Moreover, under all conditions, a significant background signal was observed between 1,300 cm−1 and 1,400 cm−1, which could be attributed to the glass coverslip. Using quartz coverslips reduced the background signal, thus potentially increasing the sensitivity of in vitro detection. As the Raman mapping indicates, the SERS signals originate from specific locations inside the cells (Figure 5).
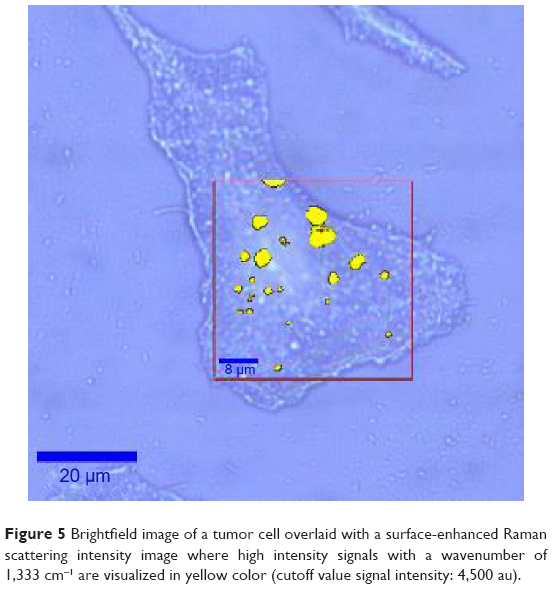 | Figure 5 Brightfield image of a tumor cell overlaid with a surface-enhanced Raman scattering intensity image where high intensity signals with a wavenumber of 1,333 cm−1 are visualized in yellow color (cutoff value signal intensity: 4,500 au). |
SERS as an in vivo imaging tool using gold nanostars as contrast agents
To validate the in vivo SERS imaging capabilities of gold nanostars as a diagnostic agent, the functionalized nanostars were iv injected in mice bearing a SKOV3 xenograft tumor. The animals had a tumor measuring >150 cm3, validated by MRI or a BLI intensity >1010 photon flux (p/s) (Figure S5). These nanostars passively accumulate inside the tumor interstitium through the well-described enhanced permeability and retention effect.41 No immediate adverse effect on the animal’s health or animal deaths occurred due to the particle injections. Concentrations used in this study were also lower than concentrations published before for in vivo experiments and considered to be safe.42,43 Three hours after iv injection of these nanostars, SERS spectra of the tumor, liver, and skin tissue were recorded with the Raman microscope (Figure S2). Both, the SERS spectra of the liver and tumor are shown in Figure 6 after background and skin tissue deduction. A clear SERS band at 1,333 cm−1 was visualized for both tissue types, indicating accumulation of the nanostars in the respective organs. Due to recognition of the nanostars by the reticuloendothelial system, the highest SERS signal intensity was observed in the liver, with an intense peak at 1,333 cm−1. Next to the liver, nanostars also accumulated in the tumor with a corresponding DTNB SERS spectrum. However, due to the inhomogeneous accumulation of the nanostars inside the tumor, the SERS spectrum could not be detected at all locations within the tumor.
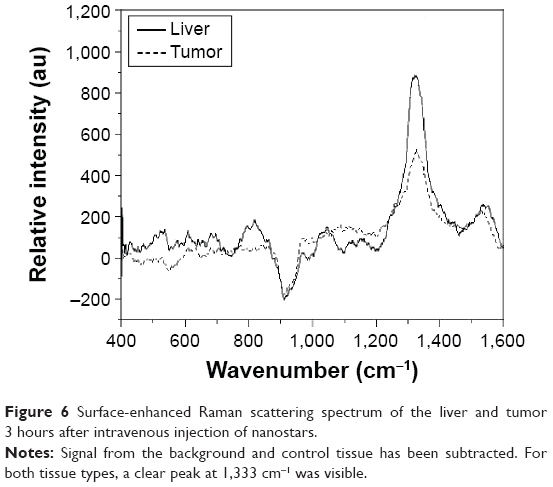 | Figure 6 Surface-enhanced Raman scattering spectrum of the liver and tumor 3 hours after intravenous injection of nanostars. |
After sacrificing the animals, several excised organs were examined to evaluate their nanostar accumulation and corresponding SERS signal ex vivo (Figure 7). By using ex vivo SERS imaging of the organs, clear DTNB spectra were observed for the liver, spleen, and tumor border, confirming the in vivo SERS experiments (Figure 7). No DTNB SERS signals were detected in the kidneys and the center of the tumor, corresponding to the background SERS spectrum that was acquired. Concerning the tumor tissue, the nanostars seemed to preferentially accumulate in its periphery, most likely due to a higher vascular density. These results were confirmed by darkfield images, where nanostars were visualized inside the corresponding tissues.
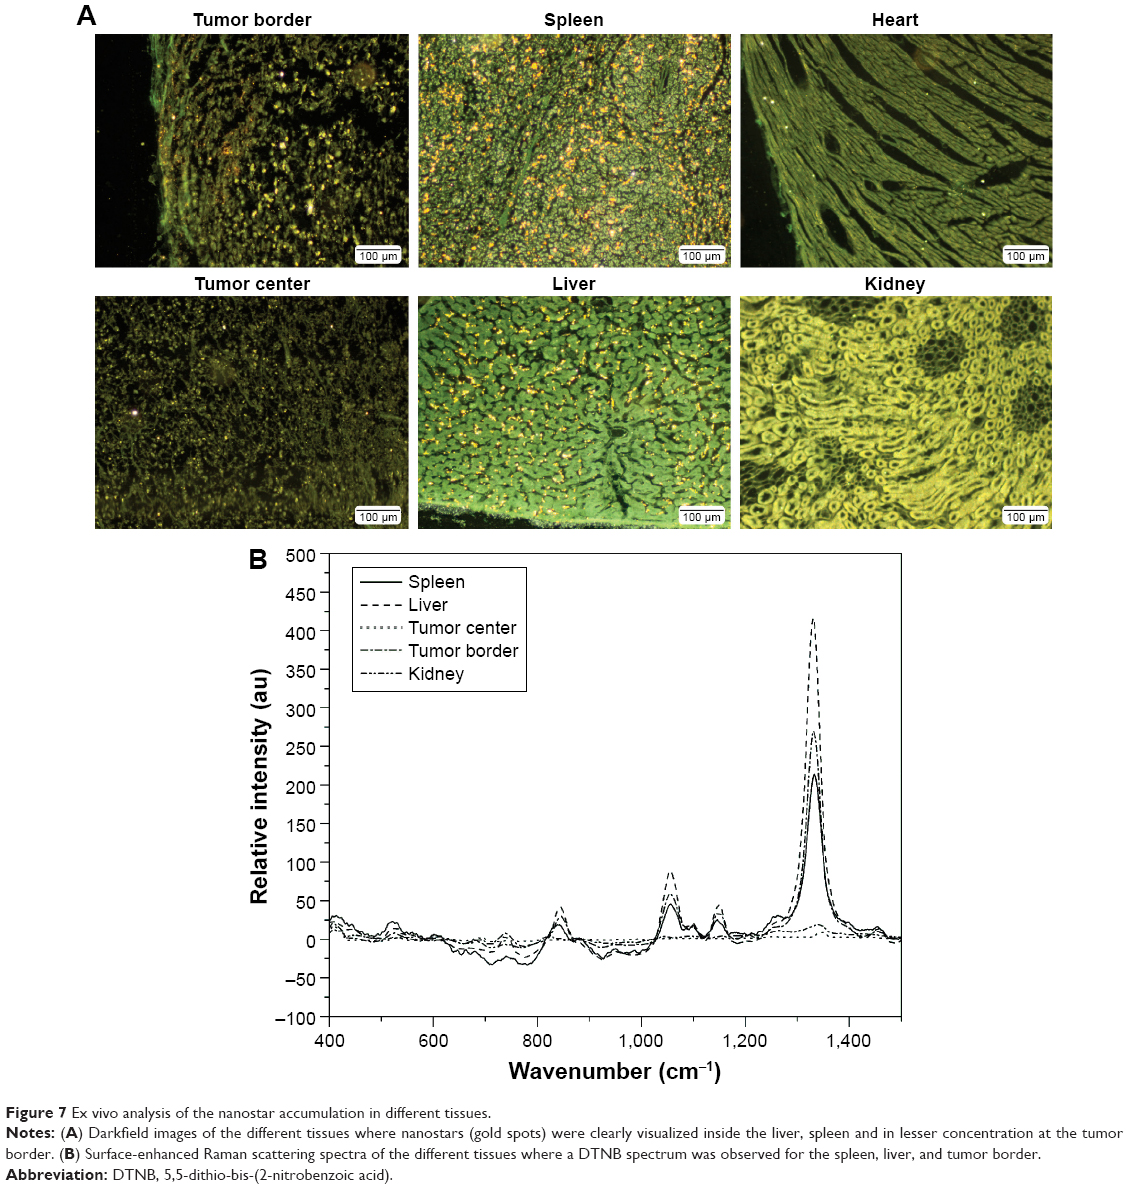 | Figure 7 Ex vivo analysis of the nanostar accumulation in different tissues. |
Discussion
Due to its unique fingerprint on Raman spectroscopy, SERS has recently emerged as one of the most promising tools for in vivo biosensing and imaging. By changing the shape of nanoparticles, different types of SERS-labeled gold structures have been introduced and described.13,44,45 Due to their multiple sharp branches, generating high local electric fields, nanostars have shown a superior SERS enhancement factor compared with nanospheres and nanorods.46 This superior enhancement factor is due to a higher surface area compared with other nanoparticles, inducing a higher loading of the Raman-active molecules on the surface. In addition, for polarization, the nanoparticle surface should have an orthogonal orientation compared with the incoming wavelength to benefit from maximum light absorption. Since the nanostars have several tips, there will always one orthognal compared to the incoming wave length. That is the advantage compared to nanorods. However, the focus for in vivo applications has been mainly on the use of nanorods.11,47 To the best of our knowledge, the use of gold nanostars as an in vivo diagnostic agent for cancer has never been addressed before. In this article, we prove the applicability of these nanostars as an in vivo diagnostic agent for tumors using SERS. By using SERS, the interaction of the nanostars with the cells could be visualized in vitro as well measured in vivo on tissue level.
To maximize the potential op SERS imaging using nanostars, the functionalization conditions of the nanostars with the Raman label had to be examined. An important criterion is the maximum DTNB concentration of 0.1 mM, we have proven that the maximum DTNB concentration to add is 0.1 mM since at higher concentrations the nanostars are unstable.48 Nanostars covered with DTNB, resulted in negatively charged TNB− in solution. These negative moieties induce osmotic depletion in the suspension, inducing instability of the nanostars. The presence of TNB− molecules is confirmed by an absorbance band at ~412 nm, which was measured starting from a concentration of 0.1 mM. However, a negative molecule is more optimal for functionalization as the synthesized nanostars are capped with negative citrate molecules. It is generally known that citrate-capped nanoparticles, as our nanostars after synthesis, are unstable when they are functionalized with a neutral or positively charged molecule without any polyethylene glycol units.31 In other words, adding positively charged molecules will change the zeta potential from negative to positive, thus inducing nanoparticle aggregation, which is notified by a decrease in the intensity of the LSPR band. An extra SAM functionalization step made the nanostars applicable for SERS detection under physiological conditions, overcoming these stability problems. As this decrease is not visible at the same salt concentration for the DTNB SAM functionalized nanostars, we could conclude that these nanostars are stable.
A crucial parameter for having high sensitivity using contract agents as nanoparticles in imaging is the LOD of these nanostars in phantoms. We measured an LOD of 13 μM, which is higher compared to previously reported LODs.18,49–50 There are several potential reasons for this higher concentration. We embedded the nanostars under an agar layer of 2 mm thickness to better mimic in vivo conditions, which decreases the irradiation effectiveness. Another reason is the mismatch between the laser wavelength and the plasmon absorption band (785 nm vs 680 nm). In this way, the LSPR effect generated at the tips is not that strong, resulting in a smaller enhancement of the DTNB Raman signal. The sensitivity could be increased by incorporating the SERS label directly into the SAM molecule, covering the complete nanoparticle with this Raman-active label.34 Another strategy is to have built-in hot spots in the particle itself, which can increase the SERS signal by 10.3,4,44,51,52
In spite of the LOD we measured, the nanostars could be easily visualized by using SERS, as confirmed by ICP-OES, TEM, and darkfield microscopy. These nanostars are taken up by the cells, as mentioned by the protocol used by Trekker et al27 and the TEM images. We established that a minimum concentration of 4.4 pg Au/cell is necessary to visualize the nanostars inside the cells. This concentration value corresponds to the intracellular gold concentration, we have used the same protocol as in those papers where they have concluded that with this protocol you measure the intracellular nanoparticle concentration.27,32 At higher concentrations, a nonlinear relation was noticed between the gold concentration and the SERS signal intensity. While for ICP-OES, an increase of 82% gold per cell was measured between 6 hours and 24 hours, an even higher SERS signal intensity increase of 135% was measured. As the nanostar concentrations shows a linear relationship with the Raman signal in the phantom measurements, the non-linear relationship in vitro is likely due to the creation of hotspots by the nanostars.5 The nanostars will aggregate inside the acidic endosomal structures of the cells, which most likely will create these hotspot. These spots are known to have a larger SERS enhancement signal as observed. At these concentrations, no cell morphology changes have been observed, indicating nontoxic effects of the nanostars.
Here, we demonstrate the use of nanostars as an in vivo diagnostic agent for cancer. The concentration of the nanostars was lower compared with other in vivo studies where no toxicity was notified.42,43 The anionic charge and relatively large size decreases the penetration of these nanostars deeper inside the tumor tissues. By functionalizing these nanostars with a biological ligand targeting an over expressed receptor on the tumor cells, their accumulation within a tumor could potentially increase, as seen before with nanobodies targeting the HER2 receptor on the SKOV3 tumor cells.32
As SERS imaging is limited by a light penetration depth of only 1–2 cm, this imaging modality can be used for detection of tumors under the skin after iv injection by a raster scanning method.11,53,54 SERS can be combined with computed tomography or photoacoustic imaging in a multimodal imaging approach for animal models. By using these other techniques, a full body and three-dimensional image of the tumor with the nanoparticle signal could be provided, which is not possible with SERS alone. Still, further technical developments of SERS can result in two-dimensional imaging tools with fast scanning times by using a Raman microscope. For theranostic purposes, these nanostars could be used as a therapeutic agent for either photothermal therapy by increasing the tumor temperature to a lethal level for the tumor cells or photodynamic therapy by creating singlet oxygen atoms, which are toxic for tumor cells.12,52,54–56 SERS may even be used as an intraoperative imaging tool guiding surgical removal of the tumor benefiting from the high Raman contrast imaging capabilities.57 During surgery, the extent and boundaries of tumors could be determined, which is perfectly feasible with 1–2 cm light penetration limits of SERS imaging. As shown in our study, nanostars will accumulate preferentially at the tumor periphery, delineating the border of the tumor during imaging.
Conclusion
In summary, physiologically stable SERS-labeled nanostars were produced that showed stable SERS signal in agar phantoms down to a concentration of 12 μM. These nanostars were taken up by tumor cells in vitro, with accumulation in endosomal structures. SERS imaging confirmed intracellular uptake, where a concentration as low as 4.4 pg Au/cell could be detected. Using these unique properties, SERS signal from the nanostars could be detected in the liver and tumor after iv injection in a tumor-bearing mouse model. The presence of the nanostars has been confirmed by ex vivo SERS measurements combined with darkfield imaging. Based on our in vivo results, we demonstrated that gold nanostars can be used as an agent for cancer diagnosis using SERS as a cost-efficient and rapid optical imaging technique, with a potential future application intraoperative imaging during surgical tumor removal in patients.
Acknowledgments
The authors are grateful for the financial support provided by the Flemish Foundation for Innovation, Science and Technology for the IWT SBO ‘Imagine’ (080017) and IWT SBO ‘NanoCoMIT’ (140061), EM’s PhD scholarship and the University of Leuven for program financing PF IMIR (10/017).
Disclosure
The authors report no conflicts of interest in this work.
References
Kneipp K, Kneipp H, Bohr HG. Single-molecule SERS spectroscopy. Appl Phys Lett. 2006;278:261–277. | ||
Kneipp J, Kneipp H, Kneipp K. SERS – a single-molecule and nanoscale tool for bioanalytics. Chem Soc Rev. 2008;37(5):1052–1060. | ||
Kneipp J. Nanosensors based on SERS for applications in living cells. Top Appl Phys. 2006;350:335–349. | ||
Kneipp J, Kneipp H, Rajadurai A, Redmond RW, Kneipp K. Optical probing and imaging of live cells using SERS labels. J Raman Spectrosc. 2009;40(1):1–5. | ||
Kneipp J, Kneipp H, McLaughlin M, Brown D, Kneipp K. In vivo molecular probing of cellular compartments with gold nanoparticles and nanoaggregates. Nano Lett. 2006;6(10):2225–2231. | ||
Zhang Y, Qian J, Wang D, Wang Y, He S. Multifunctional gold nanorods with ultrahigh stability and tunability for in vivo fluorescence imaging, SERS detection, and photodynamic therapy. Angew Chem Int Ed Engl. 2013;52(4):1148–1151. | ||
Maiti KK, Dinish US, Samanta A, et al. Multiplex targeted in vivo cancer detection using sensitive near-infrared SERS nanotags. Nano Today. 2012;7(2):85–93. | ||
McQueenie R, Stevenson R, Benson R, et al. Detection of inflammation in vivo by surface-enhanced Raman scattering provides higher sensitivity than conventional fluorescence imaging. Anal Bioanal Chem. 2012;84(14):5968–5975. | ||
Drescher D, Büchner T, McNaughton D, Kneipp J. SERS reveals the specific interaction of silver and gold nanoparticles with hemoglobin and red blood cell components. Phys Chem Chem Phys. 2013;15(15):5364–5373. | ||
Qian X, Peng XH, Ansari DO, et al. In vivo tumor targeting and spectroscopic detection with surface-enhanced Raman nanoparticle tags. Nat Biotechnol. 2008;26(1):83–90. | ||
Jokerst JV, Cole AJ, Van de Sompel D, Gambhir SS. Gold nanorods for ovarian cancer detection with photoacoustic imaging and resection guidance via Raman imaging in living mice. ACS Nano. 2012;6(11):10366–10377. | ||
Fales AM, Yuan H, Vo-Dinh T. Silica-coated gold nanostars for combined surface-enhanced Raman scattering (SERS) detection and singlet-oxygen generation: a potential nanoplatform for theranostics. Langmuir. 2011;27(19):12186–12190. | ||
Park H, Lee S, Chen L, et al. SERS imaging of HER2-overexpressed MCF7 cells using antibody-conjugated gold nanorods. Phys Chem Chem Phys. 2009;11(34):7444–7449. | ||
Maiti KK, Dinish US, Fu CY, et al. Development of biocompatible SERS nanotag with increased stability by chemisorption of reporter molecule for in vivo cancer detection. Biosens Bioelectron. 2010;26(2):398–403. | ||
Dinish US, Balasundaram G, Chang YT, Olivo M. Actively targeted in vivo multiplex detection of intrinsic cancer biomarkers using biocompatible SERS nanotags. Sci Rep. 2014;4:4075. | ||
Conde J, Bao C, Cui D, Baptista PV, Tian F. Antibody-drug gold nanoantennas with Raman spectroscopic fingerprints for in vivo tumour theranostics. J Control Release. 2014;183:87–93. | ||
Hao F, Nehl CL, Hafner JH, Nordlander P. Plasmon resonances of a gold nanostar. Nano Lett. 2007;7(3):729–732. | ||
Hrelescu C, Sau TK, Rogach AL, Jäckel F, Feldmann J. Single gold nanostars enhance Raman scattering. Appl Phys Lett. 2009;94(15):153113. | ||
Das G, Chirumamilla M, Gopalakrishnan A, et al. Plasmonic nanostars for SERS application. Microelectron Eng. 2013;111:247–250. | ||
Rodríguez-Lorenzo L, Krpetic Z, Barbosa S, et al. Intracellular mapping with SERS-encoded gold nanostars. Integr Biol (Camb). 2011;3(9):922–926. | ||
Schütz M, Steinigeweg D, Salehi M, Kömpe K, Schlücker S. Hydrophilically stabilized gold nanostars as SERS labels for tissue imaging of the tumor suppressor p63 by immuno-SERS microscopy. Chem Commun (Camb). 2011;47(14):4216–4218. | ||
Liu Y, Yuan H, Fales AM, Vo-Dinh T. pH-sensing nanostar probe using surface-enhanced Raman scattering (SERS): theoretical and experimental studies. J Raman Spectrosc. 2013;44(7):980–986. | ||
Bertrand N, Wu J, Xu X, Kamaly N, Farokhzad OC. Cancer nanotechnology: The impact of passive and active targeting in the era of modern cancer biology. Adv Drug Deliv Rev. 2014;66C:2–25. | ||
Prabhakar U, Maeda H, Jain RK, et al. Challenges and key considerations of the enhanced permeability and retention effect for nanomedicine drug delivery in oncology. Cancer Res. 2013;73(8):2412–2417. | ||
Hao E, Bailey RC, Schatz GC, Hupp JT, Li S. Synthesis and optical properties of “branched” gold nanocrystals. Nano Lett. 2004;4(2):327–330. | ||
Van de Broek B, Frederix F, Bonroy K, et al. Shape-controlled synthesis of NIR absorbing branched gold nanoparticles and morphology stabilization with alkane thiols. Nanotechnology. 2011;22(1):015601. | ||
Trekker J, Leten C, Struys T, et al. Sensitive in vivo cell detection using size-optimized superparamagnetic nanoparticles. Biomaterials. 2014;35(5):1627–1635. | ||
Gijsbers R, Ronen K, Vets S, et al. LEDGF hybrids efficiently retarget lentiviral integration into heterochromatin. Mol Ther. 2010;18(3):552–560. | ||
Ibrahimi A, Vande Velde G, Reumers V, et al. Highly efficient multicistronic lentiviral vectors with peptide 2A sequences. Hum Gene Ther. 2009;20(8):845–860. | ||
Soenen SJ, De Meyer SF, Dresselaers T, et al. MRI assessment of blood outgrowth endothelial cell homing using cationic magnetoliposomes. Biomaterials. 2011;32(17):4140–4150. | ||
Jans H, Stakenborg T, Jans K, et al. Increased stability of mercapto alkane functionalized Au nanoparticles towards DNA sensing. Nanotechnology. 2010;21(28):285608. | ||
Van de Broek B, Devoogdt N, D’Hollander A, et al. Specific cell targeting with nanobody conjugated branched gold nanoparticles for photothermal therapy. ACS Nano. 2011;5(6):4319–4328. | ||
Guven B, Basaran-Akgul N, Temur E, Tamer U, Boyaci IH. SERS-based sandwich immunoassay using antibody coated magnetic nanoparticles for Escherichia coli enumeration. Analyst. 2011;136(4):740–748. | ||
Gellner M, Kömpe K, Schlücker S. Multiplexing with SERS labels using mixed SAMs of Raman reporter molecules. Anal Bioanal Chem. 2009;394(7):1839–1844. | ||
Etchegoin PG. Quo vadis surface-enhanced Raman scattering? Phys Chem Chem Phys. 2009;11(34):7348–7349. | ||
Zhao B, Shen J, Chen S, et al. Gold nanostructures encoded by non-fluorescent small molecules in polyA-mediated nanogaps as universal SERS nanotags for recognizing various bioactive molecules. Chem Sci. 2014;5(11):4460–4466. | ||
Braun GB, Lee SJ, Laurence T, et al. Generalized approach to SERS-active nanomaterials via controlled nanoparticle linking, polymer encapsulation, and small-molecule infusion. J Phys Chem C. 2009;113(31):13622–13629. | ||
Xie J, Zhang Q, Lee JY, Wang DIC. The synthesis of SERS-active gold. ACS Nano. 2008;2(12):2473–2480. | ||
Jokerst JV, Miao Z, Zavalate C, Cheng Z, Gambhir SS. Affibody-functionalized gold-silica nanoparticles for Raman molecular imaging of the epidermal growth factor receptor. Small. 2012;7(5):625–633. | ||
Schütz M, Küstner B, Bauer M, Schmuck C, Schlücker S. Synthesis of glass-coated SERS nanoparticle probes via SAMs with terminal SiO2 precursors. Small. 2010;6(6):733–737. | ||
Danhier F, Feron O, Préat V. To exploit the tumor microenvironment: Passive and active tumor targeting of nanocarriers for anti-cancer drug delivery. J Control Release. 2010;148(2):135–146. | ||
Connor EE, Mwamuka J, Gole A, Murphy CJ, Wyatt MD. Gold nanoparticles are taken up by human cells but do not cause acute cytotoxicity. Small. 2005;1(3):325–327. | ||
Alkilany AM, Murphy CJ. Toxicity and cellular uptake of gold nanoparticles: what we have learned so far? J Nanopart Res. 2010;12(7):2313–2333. | ||
Yang M, Alvarez-Puebla R, Kim H-S, Aldeanueva-Potel P, Liz-Marzán LM, Kotov NA. SERS-active gold lace nanoshells with built-in hotspots. Nano Lett. 2010;10(10):4013–4019. | ||
Rycnega M, Wang Z, Gordon E, et al. Probing the photothermal effect of gold-based nanocages with surface-enhanced Raman scattering (SERS). Angew Chem Int Ed Engl. 2010;48(52):9924–9927. | ||
Nalbant Esenturk E, Hight Walker R. Surface-enhanced Raman scattering spectroscopy via gold nanostars. J Raman Spectrosc. 2009;40(1):86–91. | ||
Kang H, Jeong S, Park Y, et al. Near-infrared SERS nanoprobes with plasmonic Au/Ag hollow-shell assemblies for in vivo multiplex detection. Adv Funct Mater. 2013;23(30):3719–3727. | ||
Stability C, Zhang F, Skoda MWA, et al. Gold nanoparticles decorated with oligo (ethylene glycol) thiols : protein resistance and colloidal stability. J Phys Chem. 2007;111(49):12229–12237. | ||
Barbosa S, Agrawal A, Rodríguez-Lorenzo L, et al. Tuning size and sensing properties in colloidal gold nanostars. Langmuir. 2010;26(18):14943–14950. | ||
Khoury CG, Vo-Dinh T. Gold nanostars for surface-enhanced Raman scattering: synthesis, characterization and optimization. J Phys Chem C Nanomater Interfaces. 2008;112(48):18849–18859. | ||
Lim D-K, Jeon K-S, Hwang J-H, et al. Highly uniform and reproducible surface-enhanced Raman scattering from DNA-tailorable nanoparticles with 1-nm interior gap. Nat Nanotechnol. 2011;6(7):452–460. | ||
Chen Z, Yu D, Huang Y, Zhang Z, Liu T, Zhan J. Tunable SERS-tags-hidden gold nanorattles for theranosis of cancer cells with single laser beam. Sci Rep. 2014;4:6709. | ||
Xiao M, Nyagilo J, Arora V, et al. Gold nanotags for combined multi-colored Raman spectroscopy and x-ray computed tomography. Nanotechnology. 2010;21(3):035101. | ||
Liu Y, Chang Z, Yuan H, Fales AM, Vo-Dinh T. Quintuple-modality (SERS-MRI-CT-TPL-PTT) plasmonic nanoprobe for theranostics. Nanoscale. 2013;5(24):12126–12131. | ||
Maltzahn G Von, Centrone A, Park J, et al. SERS-coded gold nanorods as a multifunctional platform for densely multiplexed near-infrared imaging and photothermal heating. Adv Mater. 2010;21(31):3175–3180. | ||
Lu W, Singh AK, Khan SA, Senapati D, Yu H, Ray PC. Gold nano-popcorn-based targeted diagnosis, nanotherapy treatment, and in situ monitoring of photothermal therapy response of prostate cancer cells using surface-enhanced Raman spectroscopy. J Am Chem Soc. 2010;132(51):18103–18114. | ||
Kircher MF, de la Zerda A, Jokerst JV, et al. A brain tumor molecular imaging strategy using a new triple-modality MRI-photoacoustic-Raman nanoparticle. Nat Med. 2012;18(5):829–834. |
Supplementary materials
 | Figure S1 Transmission electron microscopy image of the nanostars. |
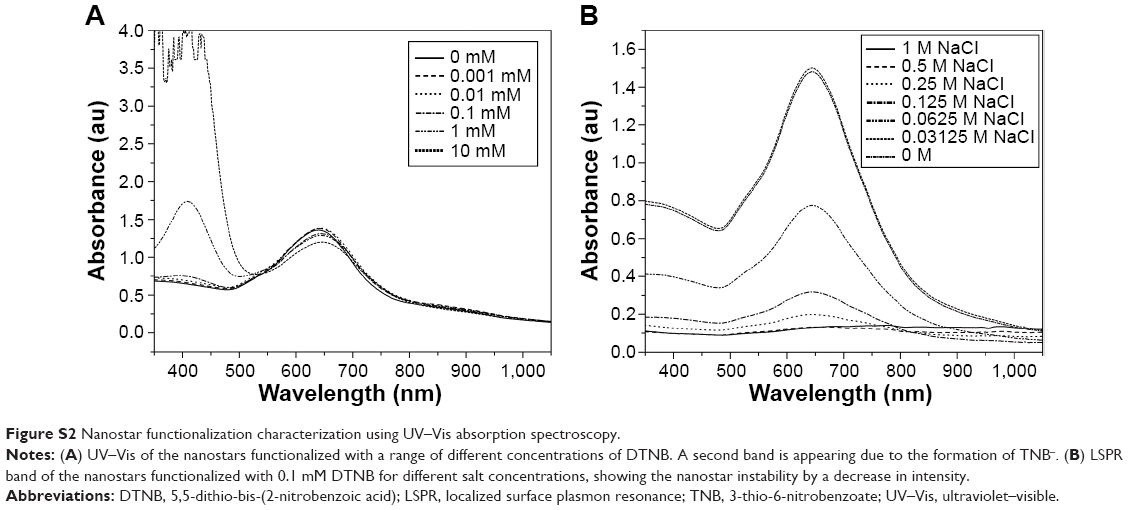 | Figure S2 Nanostar functionalization characterization using UV–Vis absorption spectroscopy. |
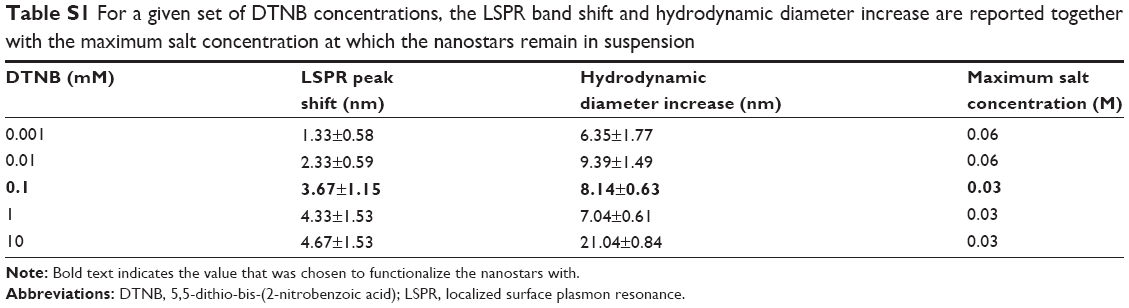 | Table S1 For a given set of DTNB concentrations, the LSPR band shift and hydrodynamic diameter increase are reported together with the maximum salt concentration at which the nanostars remain in suspension |
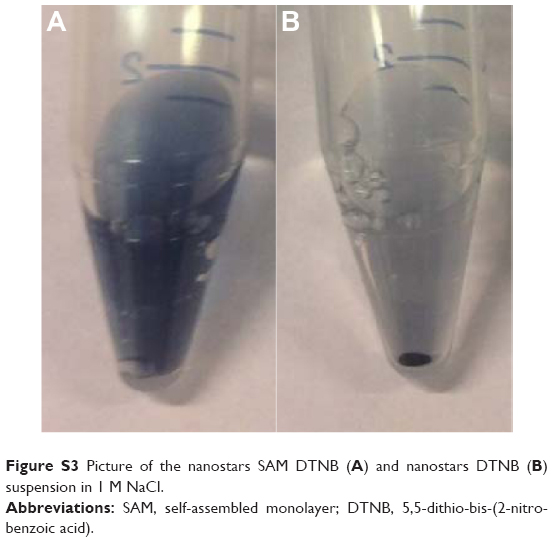 | Figure S3 Picture of the nanostars SAM DTNB (A) and nanostars DTNB (B) suspension in 1 M NaCl. |
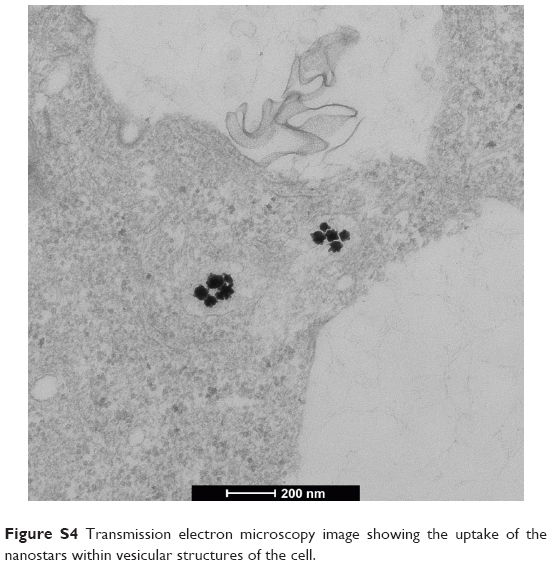 | Figure S4 Transmission electron microscopy image showing the uptake of the nanostars within vesicular structures of the cell. |
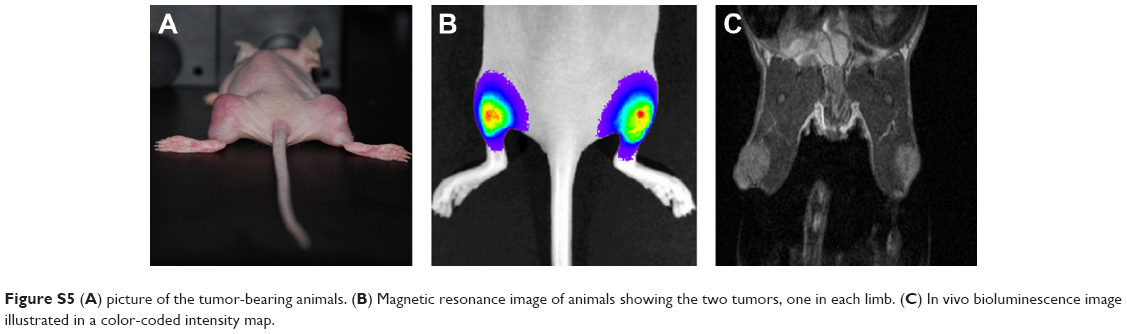 | Figure S5 (A) picture of the tumor-bearing animals. (B) Magnetic resonance image of animals showing the two tumors, one in each limb. (C) In vivo bioluminescence image illustrated in a color-coded intensity map. |
 © 2016 The Author(s). This work is published and licensed by Dove Medical Press Limited. The full terms of this license are available at https://www.dovepress.com/terms.php and incorporate the Creative Commons Attribution - Non Commercial (unported, v3.0) License.
By accessing the work you hereby accept the Terms. Non-commercial uses of the work are permitted without any further permission from Dove Medical Press Limited, provided the work is properly attributed. For permission for commercial use of this work, please see paragraphs 4.2 and 5 of our Terms.
© 2016 The Author(s). This work is published and licensed by Dove Medical Press Limited. The full terms of this license are available at https://www.dovepress.com/terms.php and incorporate the Creative Commons Attribution - Non Commercial (unported, v3.0) License.
By accessing the work you hereby accept the Terms. Non-commercial uses of the work are permitted without any further permission from Dove Medical Press Limited, provided the work is properly attributed. For permission for commercial use of this work, please see paragraphs 4.2 and 5 of our Terms.