")
Back to Journals » Risk Management and Healthcare Policy » Volume 9
Impact of disasters on child stunting in Nepal
Authors Gaire S , Darge Delbiso T, Pandey S, Guha-Sapir D
Received 23 November 2015
Accepted for publication 2 February 2016
Published 8 June 2016 Volume 2016:9 Pages 113—127
DOI https://doi.org/10.2147/RMHP.S101124
Checked for plagiarism Yes
Review by Single anonymous peer review
Peer reviewer comments 3
Editor who approved publication: Professor Frank Papatheofanis
Surya Gaire,1 Tefera Darge Delbiso,1 Srijana Pandey,2 Debarati Guha-Sapir,1
1Center for Research on the Epidemiology of Disaster (CRED), Institute of Health and Society (IRSS), Université Catholique de Louvain (UCL), Brussels, Belgium; 2Department of Nursing, Tribhuvan University Teaching Hospital (TUTH), Institute of Medicine (IOM), Baluwatar, Kathmandu, Nepal
Background: Stunting is a major public health problem that results from inadequate nutritional intake over a long period of time. Disasters have major implications in poor and vulnerable children. The aim of this study was, therefore, to assess the impact of disasters on child stunting in Nepal.
Method: A sample consisting of 2,111 children aged 6–59 months was obtained from the 2011 Nepal Demographic and Health Survey. We used bivariate and multivariate analyses to examine moderate and severe stunting against disaster, controlling for all possible confounders.
Result: Out of the total study sample, 43% were stunted (17.1% severely and 25.9% moderately). The final model, after adjusting for confounders, showed that epidemics have no impact on child stunting (adjusted odds ratio [OR] =1.14, 95% confidence interval [CI]: 0.66, 1.97 and adjusted OR =1.04, 95% CI: 0.66, 1.65 for severe and moderate stunting, respectively). Floods have impact on child stunting (adjusted OR =0.57, 95% CI: 0.31, 0.96 and adjusted OR =0.66, 95% CI: 0.41, 0.94 for severe and moderate stunting, respectively). However, children aged 6–11 months, nonvaccinated children, children of working women, children who live in mountainous areas, and children from the poorest households were more likely to be moderately stunted. Similarly, children aged 36–47 months, Dalit and other ethnic groups, children from rural settings, and children from the poorest households were more likely to be severely stunted.
Conclusion: This article illustrates the need to rethink about child stunting in Nepal. This study suggests need for further research, integration of disaster data in the Nepal Demography Health Survey, educational interventions, public awareness, promotion of vaccination, and equity in health service delivery.
Keywords: child stunting, child nutrition, disaster, flood, epidemics, Nepal
Introduction
Natural disasters
A natural disaster is a serious disruption of the functioning of a community or a society involving widespread human, material, economic, or environmental losses and impacts, which exceeds the ability of the affected community or society to cope using its own resources (United Nations International Strategy for Disaster Risk Reduction [UNISDR]). Natural disasters are the disasters that are caused due to natural phenomena, such as landslide, flood, and earthquake. In the recent year, the frequency of natural disaster is seen higher due to human activities versus the natural phenomenon. Natural disasters usually show greater impact on overall losses in developing countries, although they occur throughout the world. The reasons behind this impact are poor geographical vulnerability and socioeconomic, political, and cultural vulnerability.1 The gap in the impact of disaster between the developed and developing countries is staggering.
Disasters occurring in the world are responsible for significant economic losses and mortality. Each year, on average, US$250–300 billion economic loss takes place due to disasters. Similarly, 42 million life years are lost each year from the internationally reported disasters. The impact of disasters has relatively higher burden for low- and middle-income countries. In the last decade, loss due to extensive risk in 85 low- and middle-income countries was US$94 billion. Climate change is also expected to be one of the causes for triggering future losses. Hence, the future approaches and strategies should focus on managing the risk of disaster rather than managing the disaster itself.2
In the 21st century, 41% of disasters occurred in Asia and killed 700,000 people. In Southeastern Asia alone, 2,271 disaster events have occurred and >500,000 lives have been lost since 1900 AD.3 According to the World Bank, countries present in East Asia and Pacific regions are highly hampered by socioeconomic and physical degradation as a result of natural disasters. Major factors that account for increase in the rate and severity of natural disasters are climate change, urbanization, and environmental degradation. Low-income countries are hotspots for the majority of disasters where 70% of the world’s disasters takes place.4
The East Asia and Pacific regions are the world’s most disaster-prone area and face increasing risks of natural disaster. These regions are highly vulnerable due to high chance of earthquakes, landslides, flash floods, avalanches, and glacial lake outburst floods, given the fact that the Himalayas are present within these regions. Asia-Pacific region has been hit by >5,000 natural disasters causing more than two million fatalities and affecting the lives of more than six billion people. A person living in this region is 30 times more likely to be affected by a natural disaster than those living in Northern America or Europe.5
Nepal has a complicated geophysical structure that is prone to various kinds of disasters (soil erosion, debris flow, glacial lake outburst floods, bank erosion, concentrated monsoon rains, earthquakes, forest fires, epidemics, avalanches, and snowstorms), including flood in lower plain regions and landslides in hilly and mountain regions.6 More than 30,000 deaths were caused due to natural disaster in the history of Nepal. Epidemics and floods accounted for most of the deaths (~5,000 and 6,000, respectively) after earthquakes, which has affected almost ten million lives throughout the country.3 Nepal ranks as the most disaster-prone country in the world and has experienced several natural calamities causing high property and human losses. Every year, noticeable loss in the gross domestic product has been encountered by natural disasters in the country.7
Stunting in children
Undernutrition is defined as the outcome of insufficient food intake and repeated infectious diseases. It includes being underweight for one’s age, too short for one’s age (stunted), dangerously thin for one’s height (wasted), and deficient in vitamins and minerals (micronutrient malnutrition; UNICEF). Stunting, short height-for-age, is a result of inadequate nutrition intake over a long period of time, and it can be worsened by persistent and chronic illness. Stunting, therefore, reflects the impact of malnutrition in a population and is not caused by recent, short-term changes in dietary intake.8 Approximately 50% of death among children <5 years old takes place due to undernutrition in various countries of Asia and Africa.9 Since 1990, a major reduction in the death of children <5 years old has been noted, but still 6.3 million die every year worldwide. Approximately three million children, only in Asia and Africa, die due to various complications caused by undernutrition.9 In terms of stunting prevalence, there is a decreasing trend globally of all types of undernutrition. In 2010, the numbers of stunted children were 171 million and 167 million in the world and developing countries, respectively.10 As undernutrition is decreasing, trend in stunting is also decreasing. Despite the decreasing tendency, stunted still remains a major public health problem in most of the countries in the world.10
Appropriate and sufficient nutritional feeding practices help children grow physically and mentally. Overall growth and development of child health takes place during the period of birth to age 2, which is unfortunately marked by protein-energy and micronutrient deficiencies that can lead to disturbances in the growth of a child.8
In Nepal, 41% of children <5 years old are stunted, 11% are wasted, and 29% are underweight.8 Multiple Indicator Cluster Survey11 done in year 2014 showed that the prevalence of stunting (moderate and severe) is 37.4%. Looking at a glance, the rate of stunting is decreasing. Between the years 2001 and 2011, there was a significant decrease in stunting, by 16%.12 Approximately 10%–20% of children already have compromised growth in the first half of infancy and others in the rest of their lives due to suboptimal breastfeeding and complementary feeding practices.12
Woman’s nutritional status also plays a vital role in determining the nutritional adequacy of children. Low birth weight (LBW) among children and their further development are dependent on mother’s health status and her feeding practice. Only one-quarter of children aged 6–29 months are fed on the basis of infant and young child feeding practices. In all, 18% of women fall below lower body mass index (BMI) threshold and are categorized as malnourished, while 35% of reproductive age women are anemic.8 Maternal/parental factors (maternal education, thinness, and LBW), male sex, rural location, and lower household wealth are also associated with increased risk of stunting among children in Nepal.12
Disasters and stunting
Over the past 3 decades, natural disasters, such as heavy rainfall, heat waves, droughts, floods, cyclones, and hurricanes, have contributed to injury, illness, poverty, displacement, hunger, and death for hundreds of millions of people, with the major implication in children.13 Natural disasters affect poor and vulnerable people the most.4 They may lead to poverty, influencing family’s investment on their children’s nutrition and health care, children may to fail reach their growth potential, which impacts on their life span, affecting cognitive performances, educational attainment, and adult productivity.14,15 Poor access to health care services increases the vulnerability of women and children.16 Short-term exposures to disaster can cause acute illnesses, such as diarrhea, fever, and acute respiratory illness in children <5 years old. Likewise, long-term exposure to disaster increases the likelihood of stunting.17
Some studies18,19 conducted in developing countries have shown that people affected by flood are vulnerable to communicable diseases, including diarrhea. According to these studies, household economic status was the major determinant factor for children having diarrhea after flooding. Prevalence of diarrhea in the aftermath of flood was seen higher among children <5 years old.19 A research conducted on child nutrition and earthquake in Colombia provided an evidence for strong negative impact of the earthquake on child nutrition.20 Children in Nepal are highly vulnerable in the after math of the disaster because of the country’s poverty level, magnitude of diseases, climate change adaptation, and poor governance in respect to lack of policies that address children during and after disaster.21
Conceptual framework
The conceptual framework for this study is based on a comprehensive approach adopted by UNICEF framework.22 When any kind of disaster happens, then it directly or indirectly affects the nutritional status of the community. Occurrence of disaster affects social, economic, and political context of the society or nation as a whole. Loss of properties leads to poverty and poor quality of life, and increases chance of household food insecurity. These causes lead to inadequate dietary intake/feeding practices or a disease that is the immediate cause of undernutrition in the community. The immediate causes of disaster on community are mortality, morbidity, and disability. Long-term causes can be stunting among children, reproductive performances, cardiovascular diseases, etc.22 Research23 shows that socioeconomic, environmental, and inappropriate feeding practices are major factors that affect child stunting in Nepal. Basic causes include poverty, low social status of women, lack of education, nutritional practices, early marriage, and cultural practices. Likewise, underlying and immediate causes are maternal malnutrition, LBW, suboptimal infant feeding, low intake of micronutrients, inadequate sanitation and hygiene practices, and infectious disease burden.12
Objectives
The main objective of this study is to assess the association between stunting and disasters among children aged 6–59 months in Nepal.
Research questions
- What is the impact of floods and epidemics on child stunting?
- What factors determine the child nutritional status following the disaster?
- Is there a difference in association between moderately and severely stunted children with the disaster?
Setting
The study has considered representative samples taken by Nepal Demography Health Survey (NDHS) 2011 from various districts of Nepal that are sufficient to represent the status of the country as a whole. All the five development regions and 73 districts out of 75 were covered. Village Development Committee (VDC)-level data were compiled and analyzed.
NDHS has illustrated the reduction in the stunting prevalence in the 10 year period (2001–2011); still 41% of children <5 years old are stunted. Causes behind this existing prevalence of stunting are adolescent pregnancy, poor maternal nutritional status, LBW, postnatal factors, infant and young child feeding, and high burden of disease.8 The highest proportion of stunting is observed in the 36–47 month group children for both severe and moderate stunting. Mother’s BMI has an impact on the child’s stunting. Mothers with thin body stature have children with the highest level of stunting (47%). Children in the rural setting are more stunted than those in the urban areas. Almost all mothers breastfeed their children in Nepal, and 71% of breastfed children were introduced to complementary feeding between 6 months and 9 months. In all, 46% of children <5 years old and 18% of reproductive age women are anemic.8
This article assesses the effect of disaster on child stunting after controlling for potential confounders. There are limited or no research conducted in the past that oversees children’s nutritional status and disaster in Nepal. Despite a large amount of literature on child health and children’s nutritional status,23–25 there is relatively limited evidence on how disasters affect the nutritional status of children. Therefore, the purpose of this study is to investigate the effect of disaster on child stunting in the context of Nepal.
Methodology
Study area
The area of study is Nepal. It coordinates 26.5333°N, 86.7333°E in the global map and it covers an area of 147,181 km2. The research considers third-level administrative area, namely, VDCs, and second-level area, namely, districts.
Data source
Disaster data
Two disaster databases, namely, EM-DAT (www.emdat.be) and DesInventar (www.desinventar.org), were used to get data for the research.
EM-DAT was the major database used to get datasets about types of disaster, affected districts, and total affected population by a disaster in a particular district. The Centre for Research on the Epidemiology of Disasters maintains the EM-DAT database. EM-DAT compiles data from UN agencies, governments, and the International Federation of Red Cross and Red Crescent Societies. Disaster events to be listed in the EM-DAT database must fit at least one criteria among: 1) ten or more people dead; 2) 100 or more people affected; 3) declaration of a state of emergency; or 4) call for international assistance. These disasters include epidemic, flood, landslide, cold wave, and drought. However, the study only considered epidemic and flood because the selected cluster with the desired sample population was affected by only two of the disasters during the period of time.
Disaster Inventory System – DesInventar has precise location information from the local or town level that was useful to cross-match with EM-DAT location information. DesInventar was used to get the information about VDCs that were affected. Information between these two databases was cross-matched to locate VDCs within the affected districts.
Nepal Demography Health Survey
NDHS 2011 is the country’s biggest comprehensive representative survey that is carried out every 5 years in collaboration with the United States Agency for International Development and a local research firm New Era. NDHS mainly collects data on fertility and family planning, child mortality, children’s nutritional status, utilization of maternal and child health services, domestic violence, and knowledge of human immunodeficiency virus and acquired immune deficiency syndrome.
Nepal is divided into five developmental regions and 75 districts. Furthermore, the districts are divided into smaller units called VDCs and municipalities. Each VDC is further divided into small administrative units called wards and subwards. An enumeration area (EA) is a ward in rural areas and a subward in urban areas. Each EA is classified as urban or rural. A total of 298 EAs were selected in such a way that rural EAs are double that of urban EAs. Altogether, 25 sampling strata were created.8
Selection of sample was carried out using two-stage stratified cluster sample. First, EAs were selected using a probability-proportional-to-size strategy. In the second stage, 35 households in each urban EA and 40 households in each rural EA were randomly selected.8
The main data collection method for NDHS was quantitative field survey conducted between February and June 2011 in Nepal. The collected data were from community-level households that were representative to the whole district. NDHS data collection was performed by team of interviewers and anthropometrics (who recorded the height and weight of the children). An interview with the mother about herself and her child <5 years of age was performed. For children whose mothers were absent, caregivers were selected for response. Information on the child’s sex, age, ethnicity, religion, morbidity in the past week(s), and immunization status was collected from the mother, caregiver, or child.
Mothers/caregivers were interviewed regarding their age, marital status, education, socioeconomic status, decision-making, and involvement in any women’s group, and measurement of their nutritional status was done. Information on household drinking water source, sanitation facility, family size, and geographical location of household was also collected. All interviews were carried out using a structured questionnaire. Measurement of height and weight of all the children <5 years old was done. Measurements were taken using lightweight seca digital screen scale (for <5 years) and measuring board (for <2 years or <85 cm). Mother’s/caregiver’s height and weight were also measured to calculate BMI. Immunization cards were used to find out children’s ages. In case the card was absent, the local events calendar was used to recall children’s ages.
Description of variables
The outcome variable of the study is stunting, which is divided into severe, moderate, and normal. Moderate and severe stunting were defined as percentage of children aged 6–59 months who are below −2 and −3 SD, respectively, from median height-for-age of the WHO Child Growth Standards. The exposure variable – disaster events – was categorized into epidemic, flood, and nonaffected (Table 1).
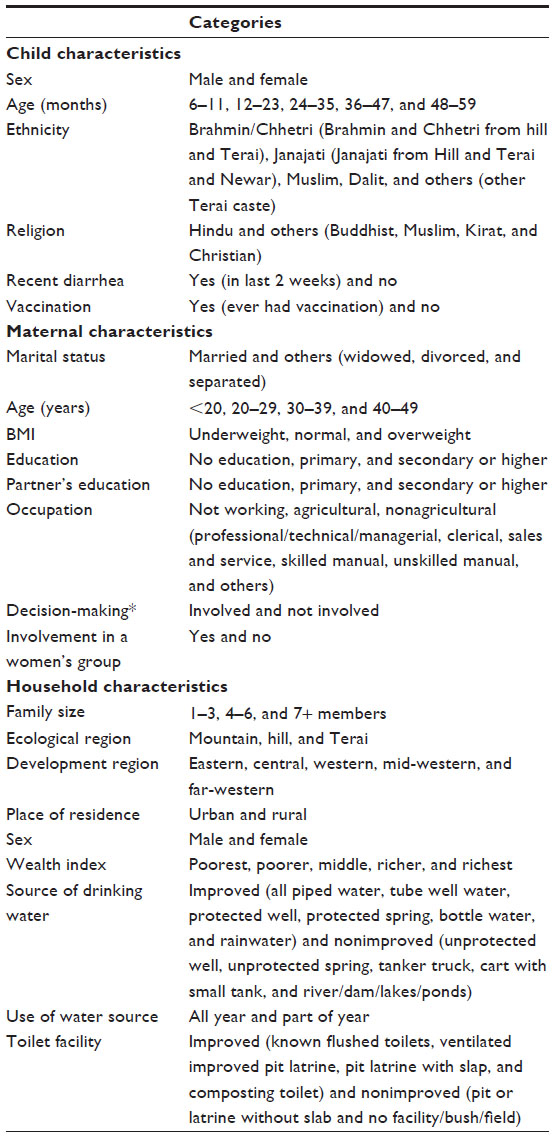 | Table 1 Categorization of independent variables |
Inclusion and exclusion criteria
Districts with zero affected population were excluded from the study. Districts or VDCs that are not listed in EM-DAT database were also not included. Major disasters (epidemics and flood) that took place between 2007 and 2010 in Nepal were only included. Only households with children 6–59 months who were taken care of by any caregivers were included in the study. Districts/VDCs that are covered by national survey were included.
Statistical analysis
For the analysis of data, NDHS 2011 raw data with Geographic Information System (GIS) locations were requested and obtained from the DHS program (www.dhsprogram.com). Similarly, the disaster database was requested and obtained through the Centre for Research on the Epidemiology of Disasters. The map of Nepal was obtained from global administrative areas’ website (www.gadm.org) to locate the exact cluster of the sample taken. Quantum Global Information System software was used to combine these two datasets to locate a lower level of administrative area.
Data selection from the obtained dataset was done, and variables were recoded according to the need of the study. Owing to the unequal selection of sample at different clusters, sampling weights were applied for the descriptive analysis of the data in order to ensure actual representativeness of the sample at the national level as well as at the urban–rural strata levels. We have analyzed the effect of disasters on child stunting status. Stunting among children of age 6–59 months is used as a dependent variable. In order to analyze the stunting status of children, new WHO Child Growth Standards (height-for-age) were categorized into normal (>−2 SD), moderate (−2 to −3 SD), and severe (<−3 SD) stunting status. Missing values were omitted for the analysis.
First, descriptive analysis of variables was done. Row percentage was calculated to see the prevalence of child stunting corresponding to independent variables. Second, Pearson’s chi-squared test of association and bivariate logistic regression analyses were performed to examine the association between stunted level and disaster. For the control of potential confounders, bivariate analysis was done independently with the exposure variable (disaster) and outcome variable (stunting). Covariates associated with both outcome and exposure variables were identified as confounders and included in the multivariate logistic regression.
The variance inflation factor was analyzed to identify multicollinearity between the independent variables. Variables with values of variance inflation factor exceeding 3 were not considered for the final model. Finally, multinomial logistic regression analysis was done to obtain the association between variables of interest. The odds ratios (ORs) with 95% confidence intervals (CIs) were calculated in order to assess the adjusted risk of independent variables, and those with P-value <0.05 in both exposure and outcome variables were identified as confounding and were retained in the final model.
For the analysis of data, SPSS Version 22.0 was used. Mendeley software was used to compile and cite the bibliography.
Ethical consideration
The NDHS obtained the written consent from all the respondents. Before data collection, the interviewers were provided with special training in asking sensitive questions and ensuring confidentiality of the respondent’s information. The interviewer took the consent of the mother/caregiver, who was briefed on the research procedures and benefits and assured of confidentiality. Interviews and assessments were carried out after obtaining the consent from the respondent. The Ethics Board from Université Catholique de Louvain granted permission to conduct this research based on secondary data.
Results
Total sample considered for the study consisted of 2,111 children of age 6–59 months (Figure 1). Of the children included in this study, 359 (17.1%) were severely stunted and 577 (25.9%) were moderately stunted.
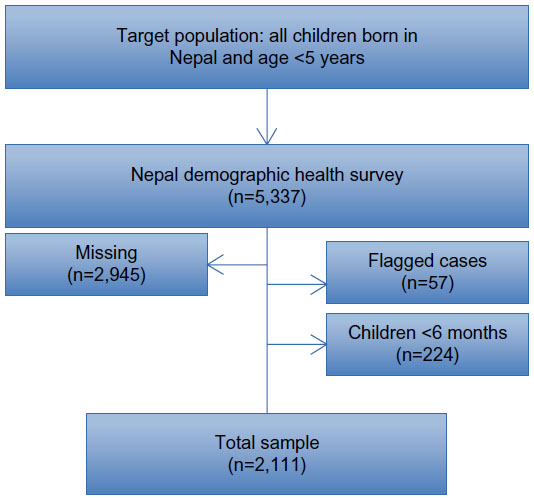 | Figure 1 A flowchart showing sample size of the study. |
Characteristics of the sample
Out of total sample of 2,111 children aged 6–59 months, almost half of them were female. The highest number of children belonged to 36–47 months (24%) of age with the median age of 30. Most of the children belonged to Brahmin/Chhetri (30.2%) and Janajati (36.6%) ethnic groups, while most (83.3%) of them belonged to Hindu religion. According to respondents, 96.1% children had at least one immunization and 14.6% suffered from diarrheal disease in the last 2 weeks prior to interview (Table 2).
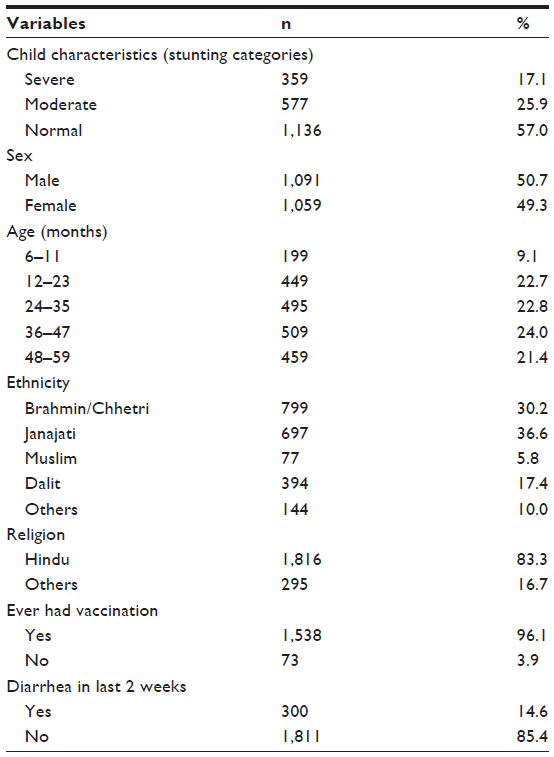 | Table 2 A descriptive sample of characteristics of stunted children aged 6–59 months in Nepal 2011 |
Of the total women having children <5 years old, 99.1% were married with most of them being in the age group 20–29 years, and the median age was 26. BMI calculation of women showed that 20% were underweight, 70.7% were with normal BMI, and 9.3% were overweight. Mothers without education had a higher proportion (48.2%), and those who gained higher education were only 5%. Similarly, 41.9% of their husbands/partners were also not educated, but almost 41% had secondary or higher education. As shown in Table 2, 64% of women with an occupation did agricultural work, while 22.8% were not working and 13.1% were engaged in nonagricultural work. Approximately 71% of women had antenatal care visits less than four times. Women who were not involved in any kind of decision-making for the household represented 31.3%, and the rest were involved in at least one area of decision-making among: health care, large household purchases, or visits to family/relatives. Women who belonged to any women’s group in their community were 42.6% (Table 3).
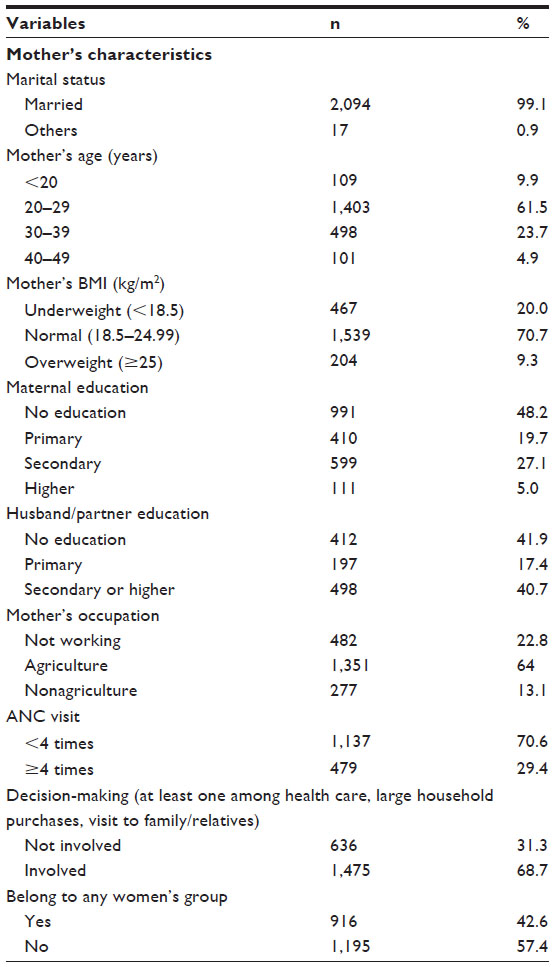 | Table 3 A descriptive sample of the mothers’ characteristics for stunted children aged 6–59 months in Nepal 2011 |
In terms of household characteristics, most (54.1%) had four to six members in their family, and almost 73% were male-headed households. More than 90% of children were from rural areas with the highest proportion (51.5%) from the Terai region. Approximately 24% of children lived in the eastern developmental region, and 32.5%, 18%, 14.8%, and 11.1% of children lived in central, western, mid-western, and far-western developmental regions, respectively. Wealth index indicator shows (Table 2) that 26% of children were from the poorest households, 22.3% from middle-class households, and 14% from the richest households. Almost 90% of households had improved source of drinking water, and 46.3% had improved toilet facility (Table 4).
 | Table 4 Descriptive sample of household characteristics of stunted children aged 6–59 months in Nepal 2011 |
The bar diagram (Figure 2) illustrates the prevalence of stunted children in disaster and nondisaster areas. The highest percentage (84.5%) of stunted children are from the nondisaster area. The prevalence of overall stunting in epidemic and flood areas was 6.1% and 9.3%, respectively.
 | Figure 2 Prevalence of stunting in disaster and nondisaster areas. |
Bivariate analysis of stunting level and other covariates
Bivariate analysis revealed that child stunting is strongly associated with disasters –floods (adjusted OR =0.42, 95% CI: 0.26, 0.67 and adjusted OR =0.59, 95% CI: 0.42,0.83 for severe and moderate stunting, respectively) and epidemics (adjusted OR =0.89, 95% CI: 0.59, 1.33 and adjusted OR =0.91, 95% CI: 0.65, 1.27 for severe and moderate stunting, respectively). Similarly, other variables, such as age of children, ethnicity, and religion, have strong association with both moderate and severe child stunting. There was a significant association between children with diarrhea and stunted children (P=0.009). For maternal characteristics, age of mother, BMI, maternal education, husband/partner education, mother’s occupation, and antenatal care visit are strongly associated (P<0.05) with both moderate and severe child stunting. Respondents belonging to any community women’s group variable, is statistically significant (P=0.034) to moderately stunted children.
For household characteristics, ecological region, developmental region, types of place of residence, wealth index, and toilet facility show strong association (P≤0.001) with both stunted and severely stunted children. Source of drinking water only showed association with severely stunted children (P=0.02). The reference category is normal children.
Risk factors for moderate stunting
Children aged 6–11 months (adjusted OR =0.26; 95% CI: 0.13, 0.52; P=0.000) were significantly more likely to be stunted than the older children. Children who had ever had vaccination were 62% less likely to be stunted than those who never had vaccination (adjusted OR =0.38; 95% CI: 0.19, 0.76; P=0.006 for vaccinated children).
For the maternal characteristics, women engaged in agricultural (adjusted OR =1.74; 95% CI: 1.10, 2.76; P=0.018) and nonagricultural (adjusted OR =1.70; 95% CI: 1.11, 2.60; P=0.015) work had statistically significantly increased odds of their children being stunted compared to nonworking women.
For the household characteristics, children who lived in mountain regions (adjusted OR =1.52; 95% CI: 1.01, 2.31; P=0.048) were significantly more likely to be stunted than those from hilly and Terai regions. Similarly, children from the poorest household (adjusted OR =2.54; 95% CI: 1.04, 6.20; P=0.041) were significantly more likely to be stunted than those from the richest household (Table 5).
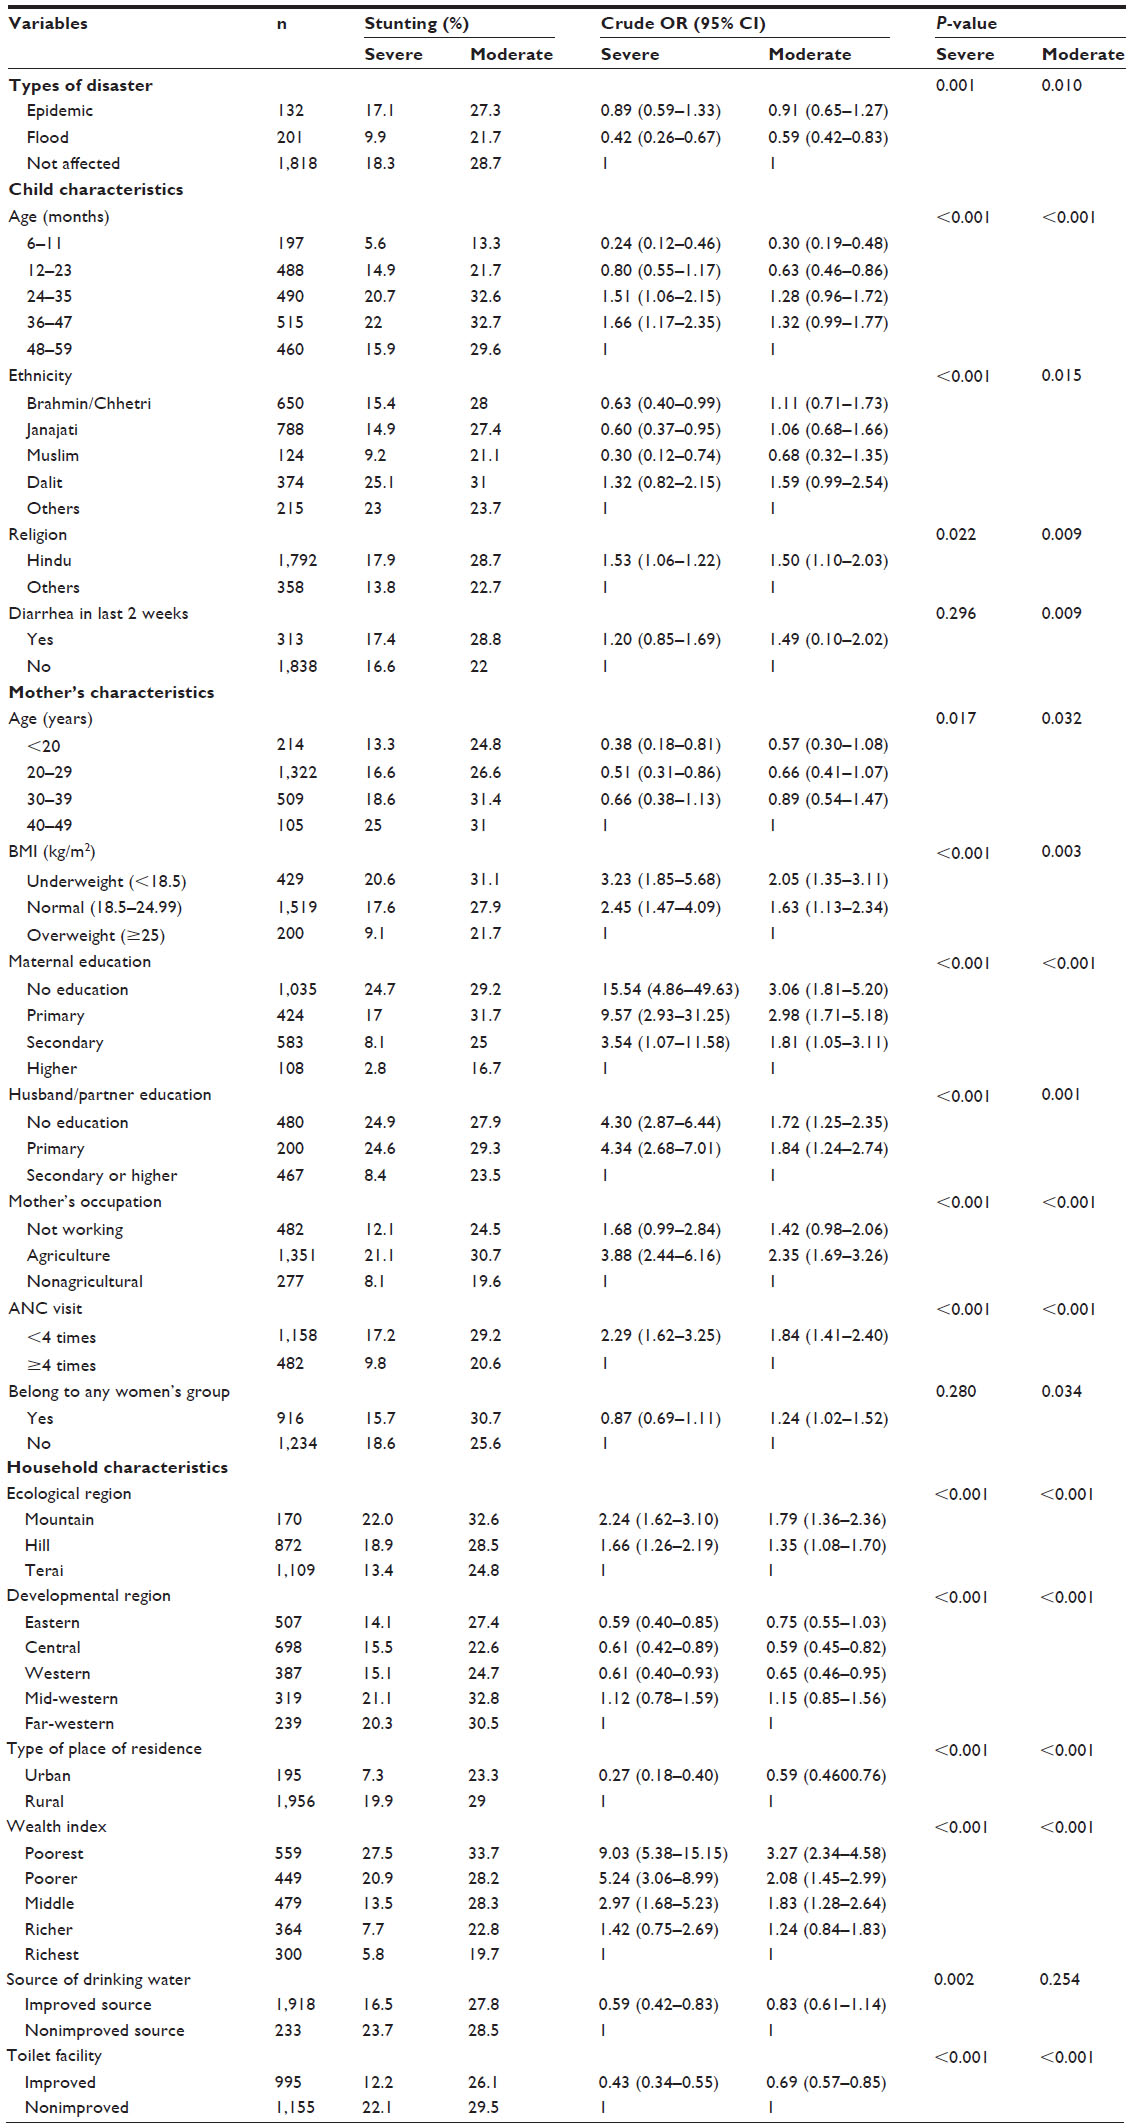 | Table 5 Prevalence of stunting and crude ORs according to child, respondent, and household characteristics in relation to stunting of children who participated in the survey |
Risk factors for severe stunting
Children aged 6–11 months (adjusted OR =0.11; 95% CI: 0.03, 0.33; P=0.000) were significantly less likely to be severely stunted than the older children, while children aged 36–47 months (adjusted OR =1.64; 95% CI: 1.11, 2.42; P=0.013) were significantly more likely to be severely stunted than 48–59 months old children. Children who belonged to ethnic groups Brahmin/Chhetri (adjusted OR =0.36; 95% CI: 0.18, 0.69; P=0.002), Janajati (adjusted OR =0.38; 95% CI: 0.20, 0.74; P=0.004), and Muslim (adjusted OR =0.30; 95% CI: 0.09, 0.98; P=0.046) were comparatively less likely to be severely stunted than those from Dalit and other ethnic groups.
For the household characteristics, children who were from the rural setting were significantly more likely to be severely stunted than their urban counterparts (adjusted OR =0.55; 95% CI: 0.32, 0.96; P=0.034). Looking at the household wealth index, children from the poorest household had increased odds of being severely stunted (adjusted OR =2.16; 95% CI: 1.12, 4.16; P=0.022) compared with those from the richest household.
Table 6 illustrates the adjusted ORs for the association between moderately and severely stunted children with disaster, child, maternal, and household characteristics. As illustrated in Table 6, epidemic is not significant with child stunting, but flood is statistically significant with moderate and severe child stunting.
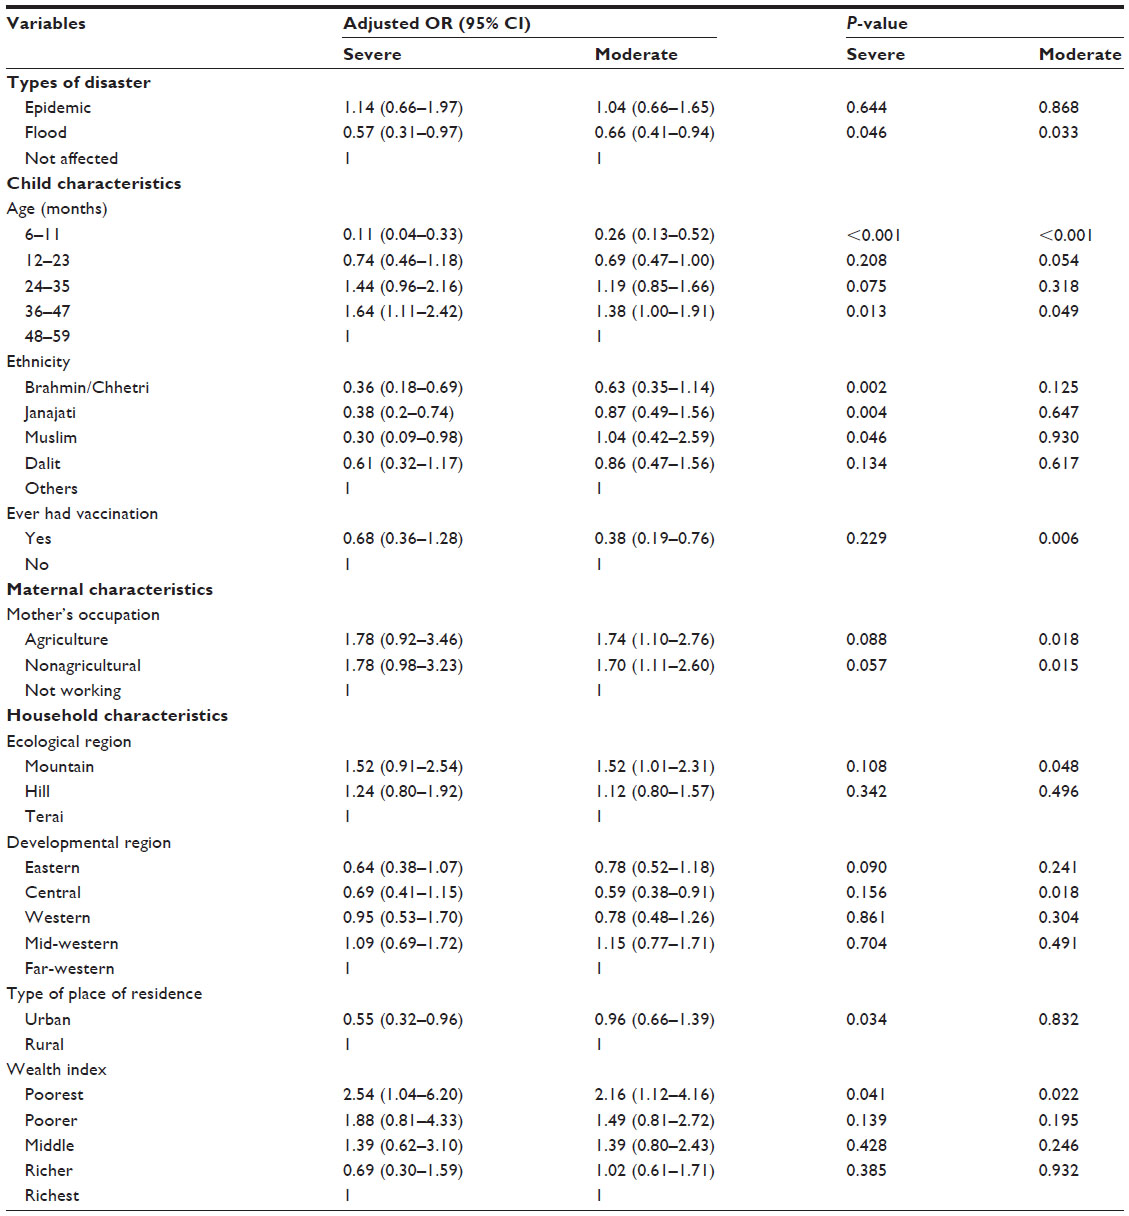 | Table 6 Adjusted ORs of child, respondent, and household characteristics in relation to stunting for children who participated in the survey |
Discussion
This study performs analysis to show relationship between natural disasters and stunting of children aged 6–59 months using 2011 NDHS data. Stunting among children <5 years old is recognized as a public health problem in Asia with a prevalence of 27%,26 and this figure is 41% for Nepal alone.8 Although Nepal has a decreasing trend in stunting prevalence,11 it is still high but lower than that of Pakistan, Bangladesh, and India.27–29
We have tried to find out all the factors that are associated with child stunting following disaster. Various factors including older children, Dalit and other ethnic group, children who never have vaccinations, working mothers, mountain and central development regions, rural children, and poorest households are statistically more likely to cause stunting in children. Some other researches23,25 conducted in Nepal show poverty, lack of education, maternal malnutrition, nutritional practice, home delivery, prolonged breastfeeding, LBW, and poorest household as risk factors for stunting of children <5 years old. Despite these known risk factors, the prevalence of stunting still remains high, which gives some hints of the presence of the more underlying factors.
Disasters were strongly associated with stunting and severely stunted children in bivariate analysis (Table 3). Although there was not any significant association with epidemics, flood showed significant association with the disaster events in the final model. Researches20,30,31 about the impact of disasters on child nutritional status, showed that child nutritional status is impacted by the natural disasters. Studies conducted in rural India showed that past exposure of natural disaster increases a chance of being stunted by 7%17 and children in flooded households are more likely to be stunted with long-term nutritional impact.32 A research done in rural India32 illustrates that children of flooded households were more likely to be stunted than those of nonflooded households. A study conducted in the USA33 shows that natural disasters have negative impact on child nutritional status (measured by weight-for-age z score) for children <5 years of age. With regard to such a study, we can say that developed countries are also not an exception for natural disasters affecting children. A nutritional survey conducted in Pakistan shows that childhood illness, such as diarrhea and global acute malnutrition, has high prevalence after flood events.31 Children’s health can be improved by reducing the risk of disaster with the help of management of drainage, waste, and sanitation practices, it also helps in the protection of community from chronic flooding.13
Our results show that the chance of children being severely stunted is more likely before are 3 years old. Children aged 6–11 months were significantly less likely to be severely stunted, and children aged 36–47 months were significantly more likely to be severely stunted. Children >12 months old had greater odds of stunting than those with lower age. Studies conducted in Vietnam34 and Nepal25 also show a similar result. Another research17 also explains that adverse effects of disasters on infants’ nutrition-related outcomes are relative to older children. Children’s overall development is rapid until their second year of life known as “critical window” for growth and development.35 Hence, their long-term nutritional impact is determined by what they eat during the early period of their lives. Stunting being a long-term impact of inappropriate dietary intake, is likely to occur at a later age among children.
Children from Brahmin/Chhetri, Janajati, and Muslim ethnic groups are less likely to be severely stunted than those from Dalit and others. In Nepal, Dalits are poorer than most of the other social groups and are regarded as an “untouchable” class with high discrimination.36 A study done in the Terai region of eastern Nepal24 has shown that children from Dalit families had significantly higher malnutrition than those from the other ethnic groups. Owing to high discrimination and disparity among Dalits and other lower caste groups, they might have been deprived from nutrition, education, health care, and so on, which results in poor nutritional status among children in these ethnic groups. It seems that social exclusion of Dalits leads to poverty and poverty then causes stunting.
Children who were ever vaccinated were less likely to be stunted and showed strong protection against stunting. A study in India17 showed that children with full-immunization coverage have 18% less chance of being stunted. In another study,32 there was a statistically significant association between stunting and immunization coverage. Children who got vaccinated seem to increase their immunity against diseases, which favors complete growth and development of physical and mental health. Diarrhea disease occurring in the last 2 weeks was not associated with child stunting. A research also revealed that intestinal permeability, which is related with diarrheal disease,37 was not significantly associated with growth of children <5 years old.38
Women with lower BMI have higher odds of having stunted children than those with a normal or overweight BMI. Similarly, mothers without education had greater odds of having their children stunted than those who obtained primary, secondary, or higher education. Researches23,24,34,39,40 showed that children whose mothers had higher level of education had a lower risk of stunting than those of mothers without education. NDHS had also showed that the percentage of child stunting decreases with the increase in mother’s education level.8 Mothers with higher education might have knowledge regarding childcare, health services, and other important information in the society.
Working women had statistically significantly increased odds of their children being stunted compared to nonworking women. Undernutrition was found to be directly linked with mother’s occupation.34,39 In a cross-sectional study done in Ethiopia,41 women who are daily workers or private workers have increased risk of having their child stunted than housewives. Working women may not have sufficient time to take care of their children and have to depend on other caretakers, while nonworking women can spend most of their time looking after their children.
Statistically significant associations were observed among stunted children living in the mountainous ecological region and central development region. Children from mountain regions were more likely to be stunted than those from the Terai region. Similarly, children from the central development region were less likely to be stunted than those from the far-western development region. The result also shows that children from the urban place of residence were significantly less likely to be severely stunted than those from the rural setting. Studies in Bangladesh revealed the association of flood and malnutrition in infants of rural areas30 and urban slums.42 Children living in rural areas are more likely to be stunted.39,40 Another study in Vietnam34 showed that children in rural and mountainous areas were 2.2 and 1.9 times more likely to be stunted than those in urban areas. Urban children are less likely to be stunted due to their improved sanitation status and better health care.43 We can conclude that children from urban or developed regions have better access to health facilities and other social programs.
Our study revealed that children from the poorest households were more likely to become stunted or severely stunted compared to those from middle-income, richer, and richest households. Researches23–25,34 have also showed that household wealth index is a strong determinant of child stunting. Children from greater income/rich families can have improved nutritional status. Rich families can afford more nutritious food, clean water, hygiene, and health care. This allows them to have a more diversified diet and to attain more effective childcare activities. At the community level, greater income means better access to quality health care, improved water, and sanitation systems and greater access to information.13 A study in Tanzania44 showed that proper nutrition is linked with higher income in the family. As found in many previous researches and reports,24,45,46 we can say that children’s stunting is strongly associated with the socioeconomic status of the household.
GIS gives approximate location, usually the center of VDC, due to which exact disaster area couldn’t be located. GIS assumes whole VDC as affected although small portion of community is destructed by disaster. Our article has several limitations that if corrected can help future studies. There was a lack of compatible datasets. We analyzed three datasets that were collected in different settings between the years 2007 and 2010. This study was based on secondary data source, so it is unknown about the recall bias or other threats to validity that may affect the accuracy of the data. We have analyzed GIS data of NDHS that consider disaster happened at the center of VDC and entire households are affected in case of flooding or epidemic although that took place only in a part within the VDC, which is practically not accurate. Therefore, the affected VDC does not necessarily affect the entire household. Finally, the intensity of disaster for the affected area was unknown.
Conclusion and recommendations
Stunting still remains a major public health problem in most of the countries in the world, especially in low- and middle-income countries. The findings from this study would enable public health researchers to think about the impact of disasters and child nutrition in the country to redesign new research methodology in conducting future studies that can be beneficial in preparedness for upcoming catastrophe.
The findings of our study revealed that the factors associated with increased risk of child stunting were flood; older children; Dalit and other ethnic groups; children without vaccination; working women; children from mountain region, far-western region, and rural area; and children from poorest households.
We have listed the following recommendations that can help to improve children’s nutritional status in the country:
- Policy implications in Nepal still need more focus on research that addresses child nutrition and disaster, as there are limited or no research done in this area. Further investigation is required to see the impact of natural disasters on child nutrition.
- Integration of disaster data in the NDHS could be useful in getting a closer look at disasters and their impact on child health. Incorporation of a disaster questionnaire in the NDHS is recommended.
- Discrimination in society should not be practiced, and public awareness programs should be given priority in policy planning and implementation.
- Vaccination prevents disease and improves nutritional status among children. Therefore, promotion of vaccination should be carried out for reaching the unreached children to consequently reduce stunting among children.
- Children from rural settings tend to be stunted. Equity in health care services should be maintained in all parts of the country to reduce prevalence of stunting in Nepal.
- lose monitoring of the gap between poorest, middle, and richest households can help in the reduction of the gap in nutritional status between children in the highest and lowest socioeconomic quintiles.
Disclosure
The authors report no conflicts of interest in this work.
References
Alcántara-Ayala I. Geomorphology, natural hazards, vulnerability and prevention of natural disasters in developing countries. Geomorphology. 2002;47(2–4):107–124. | |
UNISDR [webpage on the Internet]. The Pocket GAR 2015 Making Development Sustainable: The Future of Disaster Risk Management; 2015 [cited January 1, 2015]. Available from: http://www.preventionweb.net/english/hyogo/gar/2015/en/home/GAR_pocket/Pocket%20GAR_3.html. Accessed February 4, 2016. | |
EMDAT [homepage on the Internet]. EM-DAT: The International Disaster Database; 2015:1 [cited January 1, 2015]. Available from: http://www.emdat.be. Accessed February 4, 2016. | |
The World Bank [webpage on the Internet]. Disaster Risk Management, East Asia and Pacific; 2014:1 [cited January 1, 2015]. Available from: http://www-wds.worldbank.org/external/default/WDSContentServer/WDSP/IB/2015/04/23/090224b082e00a32/1_0/Rendered/PDF/Philippines0000own0Option00CAT0DDO0.pdf. | |
ESCAP [webpage on the Internet]. Overview of Natural Disasters and their Impacts in Asia and the Pacific, 1970–2014; 2015 [cited January 1, 2015]. Available from: http://www.unescap.org/sites/default/files/Technical%20paper-Overview%20of%20natural%20hazards%20and%20their%20impacts_final.pdf. Accessed February 4, 2016. | |
GoN, Ministry of Irrigation. Department of Water Induced Disaster Prevention. Construction; 2014. Available from http://www.dwidp.gov.np/uploads/document/file/DWIDP_Bulletin_2014_20140603055244.pdf. Accessed February 4, 2016. | |
National Society for Earthquake Technology – Nepal (NSET). Global Assessment of Risk: Nepal Country Report. Kathmandu: NSET; 2008. | |
MoHP, New Era, UNICEF. Nepal Demographic and Health Survey 2011. 2011. Available from http://dhsprogram.com/pubs/pdf/FR257/FR257%5B13April2012%5D.pdf. Accessed February 4, 2016. | |
UNICEF [webpage on the Internet]. UNICEF Data: Monitoring the Situation of Children and Women. New York, NY; 2015. Available from: http://mics.unicef.org/files?job=W1siZiIsIjIwMTUvMDQvMDgvMDgvMjgvNTIvODQ2L01JQ1MzX0NoYXB0ZXJfMF9fX1RpdGxlX1BhZ2VfYW5kX0NvbnRlbnRzLnBkZiJdXQ&sha=9434bf73f759e625. Accessed February 4, 2016. | |
De Onis M, Blössner M, Borghi E. Prevalence and trends of stunting among pre-school children, 1990–2020. Public Health Nutr. 2012;15(01):142–148. | |
GoN, UNICEF. Nepal Multiple Indicator Cluster Survey 2014: Key Findings. 2015. Available from http://unicef.org.np/uploads/files/44234273128039655-nmics-5-key-findings.pdf. Accessed February 4, 2016. | |
FANTA, FHI360. Nepal Nutrition Profile. Washington, DC: FHI; 2014. | |
Bartlett S. Climate change and urban children: impacts and implications for adaptation in low- and middle-income countries. Environ Urban. 2008;20(2):501–519. | |
Rodrik D, Rosenzweig MR, editors. Preface: development policy and development economics: an introduction*. Handbook of Development Economics. Vol. 5, Issue C. Amsterdam: North-Holland; 2010:xv–xxvii. | |
Skoufias E. Economic crises and natural disasters: coping strategies and policy implications. World Dev. 2003;31(7):1087–1102. | |
Food Security Cluster. A Report on the Food Security Impact of 2015 Earthquake. Rome: Food Security Cluster; 2015. | |
Datar A, Liu J, Linnemayr S, Stecher C. Social science and medicine the impact of natural disasters on child health and investments in rural India. Soc Sci Med. 2013;76:83–91. | |
Kunii O, Nakamura S, Abdur R, Wakai S. The impact on health and risk factors of the diarrhoea epidemics in the 1998 Bangladesh floods. Public Health. 2002;116(2):68–74. | |
Joshi PC, Kaushal S, Aribam BS, et al. Recurrent floods and prevalence of diarrhea among under five children: observations from Bahraich district, Uttar Pradesh, India. Glob Health Action. 2011;4:1–8. | |
Arends-Kuenning M, Bustelo M. Persistent Impact of Natural Disasters Child Nutrition and Schooling: Evidence from the 1999 Colombian Earthquake. Bonn: IZA; 2012:1–47. | |
Plan Nepal. Impact of Climate Change on Children in Nepal. Kathmandu: Plan Nepal; 2012. | |
UNICEF [webpage on the Internet]. UNICEF Conceptual Framework; 2008:1. Available from: http://www.unicef.org/nutrition/training/2.5/4.html. Accessed February 4, 2016. | |
Paudel R, Pradhan B, Wagle RR, Pahari DP, Onta SR. Risk factors for stunting among children: a community based case control study in Nepal. Kathmandu Univ Med J. 2011;10(39):18–24. | |
Pramod Singh GC, Nair M, Grubesic RB, Connell FA. Factors associated with underweight and stunting among children in rural Terai of eastern Nepal. Asia Pac J Public Health. 2009;21(2):144–152. | |
Tiwari R, Ausman LM, Agho KE. Determinants of stunting and severe stunting among under-fives: evidence from the 2011 Nepal Demographic and Health Survey. BMC Pediatr. 2014;14(1):1–15. | |
UNICEF, WHO, The World Bank. Levels and Trends in Child Malnutrition: UNICEF-WHO- World Bank. Joint Child Malnutrition Estimates. Africa: UNICEF, WHO, The World Bank; 2012. | |
National Institute of Population Studies, ICF International. Pakistan Demographic and Health Survey 2012-13. Islamabad: National Institute of Population Studies; 2013. | |
National Institute of Population Research and Training (NIPORT), Mitra and Associates, Macro ORC. Bangladesh Demographic Health Survey (BDHS). Dhaka, Bangladesh and Calverton, MD: National Institute of Population Research and Training, Mitra; 2012. | |
International Institute for Population Sciences (IIPS) and ORC Macro. National Family Health Survey (NFHS-3). Mumbai: International Institute for Population Sciences (IIPS) and ORC Macro. Available from https://dhsprogram.com/pubs/pdf/FRIND3/FRIND3-Vol1AndVol2.pdf. Accessed February 4, 2016. | |
Del Ninno C, Lundberg M. Treading water. The long-term impact of the 1998 flood on nutrition in Bangladesh. Econ Hum Biol. 2005;3(1):67–96. | |
Pakhtunkhwa K. Flood Affected Nutrition Survey of Khyber Pakhtunkhwa (KP) Province. Department of Health, UNICEF, ACF. 2010:1–36. | |
Rodriguez-Llanes JM, Ranjan-Dash S, Degomme O, Mukhopadhyay A, Guha-Sapir D. Child malnutrition and recurrent flooding in rural eastern India: a community-based survey. BMJ Open. 2011;1(2):e000109–e000109. | |
Baez J, Santos I [webpage on the Internet]. Children’s Vulnerability to Weather Shocks: A Natural Disaster as a Natural Experiment. New York, NY: Social Science Research Network; 2007. Available from: http://citeseerx.ist.psu.edu/viewdoc/download?doi=10.1.1.175.2774&rep=rep1&type=pdf. Accessed February 4, 2016. | |
Hien NN, Kam S. Nutritional status and the characteristics related to malnutrition in children under five years of age in Nghean, Vietnam. J Prev Med Public Heal. 2008;41(4):232–240. | |
World Health Organization (WHO) [webpage on the Internet]. Guiding Principles for Complementary Feeding of the Breastfeed Child; 2001. Available from: http://www.who.int/nutrition/publications/guiding_principles_compfeeding_breastfed.pdf. Accessed February 4, 2016. | |
UNICEF [webpage on the Internet]. Dalits in India and Nepal: Policy Options for Improving Social Inclusion in Education; 2007. Available from: http://www.unicef.org/socialpolicy/files/Dalits_in_India_and_Nepal_Policy_Options_for_Improving_Social_Inclusion(1).pdf. Accessed February 4, 2016. | |
Dunlop SP, Hebden J, Campbell E, et al. Abnormal intestinal permeability in subgroups of diarrhea-predominant irritable bowel syndromes. Am J Gastroenterol. 2006;101(6):1288–1294. | |
Goto R, Panter-Brick C, Northrop-Clewes CA, Manahdhar R, Tuladhar NR. Poor intestinal permeability in mildly stunted Nepali children: associations with weaning practices and Giardia lamblia infection. Br J Nutr. 2002;88(2):141–149. | |
Keino S, Plasqui G, Ettyang G, van den Borne B. Determinants of stunting and overweight among young children and adolescents in sub-Saharan Africa. Food Nutr Bull. 2014;35(2):167–178. | |
Zottarelli LK, Sunil TS, Rajaram S. Influence of parental and socioeconomic factors in stunting in children under 5 years in Egypt. East Mediterr Heal J. 2007;13(6):1330–1342. | |
Agedew E, Chane T. Prevalence of Stunting among children aged 6 – 23 months in Kemba Woreda, Southern Ethiopia: a community based cross-sectional study. Adv Public Health. 2015;2015:6. | |
Goudet SM, Faiz S, Bogin BA, Griffiths PL. Pregnant women’s and community health workers’ perceptions of root causes of malnutrition among infants and young children in the slums of Dhaka, Bangladesh. Am J Public Health. 2011;101(7):1225–1233. | |
Kabubo-Mariara J, Ndenge GK, Mwabu DK. Determinants of children’s nutritional status in Kenya: evidence from demographic and health surveys. J Afr Econ. 2009;18(3):363–387. | |
Alderman H, Hoogeveen H, Rossi M. Reducing child malnutrition in Tanzania: combined effects of income growth and program interventions. Econ Hum Biol. 2006;4(1):1–23. | |
Setboonsarng S. Child Malnutrition as a Poverty Indicator: An Evaluation in the Context of Different Development. Development. 2005. Available from http://www.adb.org/sites/default/files/publication/156773/adbi-dp21.pdf. Accessed February 4, 2016. | |
Levinson FJ, Mehra S, Levinson D, et al. Morinda revisited: changes in nutritional well-being and gender differences after 30 years of rapid economic growth in rural Punjab, India. Food Nutr Bull. 2004;25(3):221–227. |
 © 2016 The Author(s). This work is published and licensed by Dove Medical Press Limited. The full terms of this license are available at https://www.dovepress.com/terms.php and incorporate the Creative Commons Attribution - Non Commercial (unported, v3.0) License.
By accessing the work you hereby accept the Terms. Non-commercial uses of the work are permitted without any further permission from Dove Medical Press Limited, provided the work is properly attributed. For permission for commercial use of this work, please see paragraphs 4.2 and 5 of our Terms.
© 2016 The Author(s). This work is published and licensed by Dove Medical Press Limited. The full terms of this license are available at https://www.dovepress.com/terms.php and incorporate the Creative Commons Attribution - Non Commercial (unported, v3.0) License.
By accessing the work you hereby accept the Terms. Non-commercial uses of the work are permitted without any further permission from Dove Medical Press Limited, provided the work is properly attributed. For permission for commercial use of this work, please see paragraphs 4.2 and 5 of our Terms.