")
Back to Journals » Patient Related Outcome Measures » Volume 7
The Universal Patient Centeredness Questionnaire: reliability and validity of a one-page questionnaire following surveys in three patient populations
Authors Bjertnaes OA, Iversen HH, Holmboe O, Danielsen K, Garratt A
Received 17 December 2015
Accepted for publication 8 March 2016
Published 4 June 2016 Volume 2016:7 Pages 55—62
DOI https://doi.org/10.2147/PROM.S102732
Checked for plagiarism Yes
Review by Single anonymous peer review
Peer reviewer comments 2
Editor who approved publication: Dr Robert Howland
Oyvind Bjertnaes, Hilde Hestad Iversen, Olaf Holmboe, Kirsten Danielsen, Andrew Garratt
Unit for Patient-Reported Quality, Norwegian Institute of Public Health, Oslo, Norway
Background: This study developed and tested the reliability and validity of the Universal Patient Centeredness Questionnaire (UPC-Q).
Methods: The UPC-Q developed in this study has three parts: 1) the aspects that patients consider the most important when receiving a relevant health care service, rating the health care services on these aspects and their prioritization, 2) the overall experiences of patients using the relevant health care service, and 3) suggestions for improvements. The UPC-Q was tested in four different patient-experience surveys in 2015, including psychiatric inpatients (n=109), general practitioner (GP) patients (n=1,059), and inpatients from two hospital samples (n=973, n=599). The UPC-Q was tested for item completeness and ceiling effects, while the UPC-Q scale consisting of the first part of the UPC-Q was tested for internal consistency reliability and construct validity.
Results: The percentage of patients rating at least one aspect was 70.6% for psychiatric inpatients, 77.6% for hospital inpatients, and 90.6% for GP patients, while 88.9% of the psychiatric inpatients, 93.1% of the hospital inpatients, and 95.3% of the GP patients were able to prioritize the aspects. The internal consistency reliability of the UPC-Q scale was acceptable in all samples (Cronbach’s alpha >0.7), and construct validity was supported by 20 of 21 significant associations between the UPC-Q and related variables. The UPC-Q total score was skewed toward positive evaluations, but the ceiling effect was smaller for an unbalanced response scale than for a balanced scale.
Conclusion: The UPC-Q includes ratings of what is most important for individual patients, while at the same time providing data for improving the quality of health care and making it possible to monitor trends within and across patient populations. This study included psychiatric inpatients, hospital inpatients, and GP patients, and found that the UPC-Q performed well in terms of acceptance, internal consistency reliability, and construct validity.
Keywords: patient centeredness, patient satisfaction, questionnaire, survey
Introduction
Patient centeredness is a core component of the quality of health care, and is often measured by surveys of patient-reported experiences.1 These surveys include questions on nonmedical aspects of health care such as information, communication, organization, and physical environment. Questionnaires can take the form of generic instruments that are not specific to a particular health care setting or population, diagnosis-specific instruments, and instruments that focus on specific topics, including aspects of care such as communication.
Many questionnaires have been published, and validation studies have included activities and data to support content validity, such as that the included domains are relevant and important across the investigated patient population. Generic instruments are heavily dependent on the populations and health care settings in which they were developed, and so their domains vary both in content and relevance across patient groups, services, and settings. This diversity makes comparisons across settings and patient groups difficult. Few instruments have been designed to be generic across patient groups, type of services, and/or settings.2–4 In contrast to the majority of patient experience instruments, such instruments include the same topics, questions, and response formats for all patients, thus making it possible to monitor trends both within and across patient populations. However, most of these instruments also have restrictions related to their development or application, such as to secondary health care or the inclusion of all hospital patients.2 To the best of our knowledge, the only instrument that was specifically developed for all health care services is the Friends and Family Test (FFT), but this has not been properly validated and published in the scientific literature. Moreover, a recent study found that its scores exhibited only a weak-to-moderate association with other quality indicators.5
There are numerous definitions of patient centeredness, with a recent systematic review identifying more than 500 definitions.6 That review also performed a content analysis of all of the definitions, which identified 15 dimensions of patient centeredness. However, a critical feature of patient centeredness is to understand and respect the values, preferences, and needs of each patient.7 This implies an individual focus, also in measurement work, but the types of instruments referred to earlier only include topics that are relevant and important across groups of patients. This gap between individual and group preferences might be reduced by including individualized questions or instruments like the Patient-Generated Index (PGI) that is used in the patient-reported-outcomes literature.8 The goal of individualized instruments is to include what is important for individual patients, thus also being particularly promising in the development of a universal questionnaire for assessing patient centeredness. The use of individualization supports the content validity of an instrument from the perspective of the individual patient.
The aim of this study was to develop and test the reliability and validity of a patient-centeredness questionnaire called the Universal Patient Centeredness Questionnaire (UPC-Q). Even though many questionnaires have been developed and validated, Norway lacks relevant questionnaires for many patient groups. The UPC-Q fills this hole in the Norwegian questionnaire bank, so that all health care services have an instrument for the measurement of patient experiences. The UPC-Q was included and tested in four surveys conducted by the Norwegian Knowledge Centre for the Health Services in 2015. This article describes the development and testing of the UPC-Q.
Materials and methods
Development of the UPC-Q
Three different sources were used as an initial framework to formulate the UPC-Q. First, the instrument was individualized by adjusting the following three parts of the PGI to the patient-reported experience context8: 1) what patients consider to be the three most important aspects of experiences when they have contact with a health care service, 2) how patients rate their experiences with the health care service on each of these three aspects, and 3) the relative importance of the three aspects.
The instrument was simplified by limiting the number of aspects to three, which was tested with a positive result in the psychiatric context. In the prioritization part, the number of points was reduced to six; this was chosen for ease of division by three.
The individualized questions were supplemented with a global item about experiences with the health care service. Most patient-experience questionnaires include a global question about experiences, satisfaction, or recommendations to others. These questions are often used when testing the construct validity, but they have also been used as outcome variables. An example of the latter is the recent UK initiative involving the FFT that is applied to all patients visiting services provided by the National Health Service.4 Researchers from the Picker Institute originally recommended using a global item about patient experiences, because of measurement problems with the question used in the FFT.9 We chose to include a global patient-experience item, the primary goal being to obtain a global outcome measure that could be compared both within and across settings, but also used as a validation source for the individualized questions included in the UPC-Q.
Finally, an open-ended comment section asking for suggestions for improvements from the patients was included. Research and measurement projects show that such qualitative data can yield meaningful information for quality improvement,4,10 even from patients who answer in the top box on all items.10 Patient satisfaction and experience ratings often exhibit ceiling effects, while open-ended comments tend to be more balanced, concrete, and actionable, thereby representing useful information for quality improvement.10
The aim was to develop the UPC-Q to be suitable for use in both local and large-scale surveys. The questionnaire is presented on a single page, which makes it easy to incorporate alongside other instruments and in applications such as local quality measurements. The latter often include the local distribution of questionnaires, also on-site, increasing the opportunity for skewed data.11 Different methods are available for reducing data skewness, such as performing data collection postdischarge by postal mail, dichotomizing ordinal scales, and using nonbalanced scales to reduce skewness.11 Since generic items are often highly skewed,2,12 and local use is one of the goals of the UPC-Q, we tested two different response formats. Our standard 5-point response scale was adjusted to a balanced 5-point format ranging from “very good” to “very poor”. The second response format used the response categories from the first question in the 36-Item Short Form Health Survey as an alternative,13 ranging from “poor” to “excellent”. The scale is unbalanced, but such scales have been recommended previously14 and have also been shown to reduce ceiling effects.15
Data collection
The Norwegian Knowledge Centre for the Health Services has a national function for surveys on patient-reported experiences. The UPC-Q was included in all possible surveys conducted in 2014 and 2015 as part of this national function. The psychiatric inpatient survey was conducted in the autumn of 2014, the other surveys were conducted in the spring of 2015. The interviews took place in the period September–November 2015.
The psychiatric inpatient survey has been described elsewhere,16 but in short the survey included one-fourth of all institutions in each of the four health care regions in Norway. The questionnaire was distributed and collected on-site. Patients responded through a self-administrated paper survey, and the response rate was 74.6%. The main survey was only used to test the adequacy of using three aspects rather than five in the individualized part of the UPC-Q, not to test the UPC-Q. However, the national survey included a retest study, and the UPC-Q was included in the retest survey as a preliminary test of the instrument. The retest was given to every fourth patient in the survey, and was answered by 109 patients.
The UPC-Q was tested in cognitive interviews with ten patients. The interviews were mainly conducted with patients visiting a general practitioner (GP) office, with the remainder performed by the researchers among their own networks. Participants were given a brief background to the study, and were urged to “think aloud” when they answered the questionnaire. A predefined interview schedule was used that contained questions about the different components of the UPC-Q. We tried to recruit patients from various groups according to age and sex, but the resulting interviews showed that females were overrepresented and older persons were underrepresented.
The UPC-Q was included in a national population survey on health care quality and patient safety that was performed in 2015. The survey was conducted with an Internet panel, and specifically asked about the application of the UPC-Q in a GP setting. All Norwegian inhabitants have access to a GP. The sample was contacted by e-mail and responded online. No reminders were sent, and the response rate was 52%.
The UPC-Q was also included in two patient-experience surveys conducted at the ward and department levels at five hospitals in Norway in 2015. Both surveys were postal with two reminders to nonrespondents. Patients responded through a self-administrated paper survey or online. The response rate was 58% in the first survey and 55% in the second survey. The first survey included one hospital in Oslo that was used to test the UPC-Q in an inpatient hospital setting. The second survey included four hospitals in one of the health care regions in Norway and was used to test the two different response formats for the UPC-Q: 1) patients in the first inclusion month received a balanced 5-point response scale ranging from “very poor” to “very good” experiences and 2) those in the second inclusion month received a nonbalanced scale ranging from “poor” to “excellent”.
Ethics
The hospital surveys were approved by the Data Protection Authority for the included hospitals: Lovisenberg Diakonale Hospital and Møre and Romsdal Health Enterprise. The psychiatric survey was conducted as an anonymous quality assurance project. According to the joint body of the Norwegian Regional Committees for Medical and Health Research Ethics, research approval is not required for quality assurance projects. The Norwegian Social Science Data Services states that anonymous projects are not subject to notification. Patients were informed that participation was voluntary and they were assured of anonymity. Return of the questionnaire represented patient consent in the hospital surveys and the psychiatric survey, which is the standard procedure in all national patient experience surveys conducted by the Norwegian Knowledge Centre for the Health Services. The population survey was conducted by an external poll institute, TNS Gallup, in their online access panel. Participation in the survey was voluntary and return of the questionnaire represented patient consent. TNS Gallup have approval from the Norwegian Data Protection Authority to conduct public opinion polls. The Internet panel is based on consent from each individual in the panel. Only anonymous data was transferred to and used by the Norwegian Knowledge Centre for the Health Services.
Statistical analysis
Simple descriptives were assessed for the UPC-Q components in each sample, including missing item rates, percentages, mean values, and standard deviations.
The first part of the UPC-Q (three most important aspects for patients, the evaluation of health care on these aspects, the relative importance of the three aspects) was used to construct a patient centeredness scale. The internal consistency reliability of the scale was assessed using item-total correlation and Cronbach’s alpha. Construct validity was assessed through correlations of scale scores with variables expected to be related to the UPC-Q construct, especially variables related to patient-reported experiences and satisfaction. For psychiatric patients, the UPC-Q scale was correlated with three patient-reported experience scales, self-perceived general condition today, and the global experience item from the UPC-Q. For hospital inpatients, the UPC-Q scale was correlated with ten patient-reported experience scales, two global satisfaction items, self-perceived health and the global experience item from the UPC-Q. For GP patients, the UPC-Q scale was correlated with self-perceived health and the global experience item from the UPC-Q.
The difference between balanced and unbalanced response formats on each of the quantitative UPC-Q components was assessed using t-tests. Multivariate regression analysis was conducted to control for the confounding variables of age and self-perceived health.
All statistical analyses were performed using SPSS (version 15.0; SPSS Inc., Chicago, IL, USA).
Results
The cognitive interviews showed that the UPC-Q was acceptable and understandable, but also that some patients older than 70 years found the first part of the questionnaire rather difficult to complete.
The percentage of males in the four samples varied from 34.7 for psychiatric patients to 51.8 for hospital sample one (Table 1). Psychiatric patients were much younger on average than the other samples: 54.9% of psychiatric patients were younger than 45 years, compared to only 6.5% for the hospital sample one. Self-perceived physical health was reported as poor for 19.6% in hospital sample one, while only 4.2% of GP patients reported poor health. For psychiatric patients, 39.2% reported very or rather poor mental health.
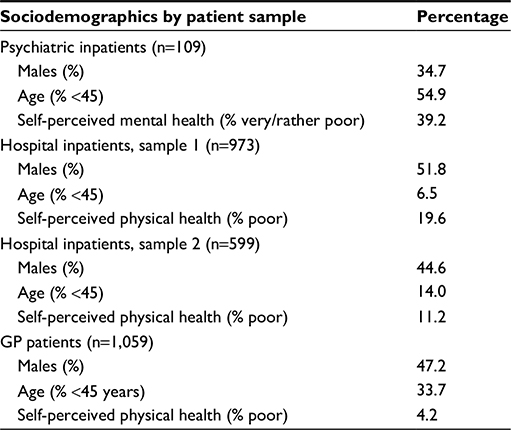 | Table 1 Respondent samples Abbreviation: GP, general practitioner. |
The percentage of psychiatric inpatients rating health care in the second part of the UPC-Q on one aspect was 70.6%, while 66.1% and 62.4% rated two and three aspects, respectively (Table 2). Most (88.9%) of the respondents were able to prioritize the aspects. The ratings of the four quantitative items were skewed toward the positive, with the global experience item being rated highest, at 4.1 (on a scale from 1 to 5, where 5 is the most positive). Open-ended comments were provided by 22% of the psychiatric inpatients.
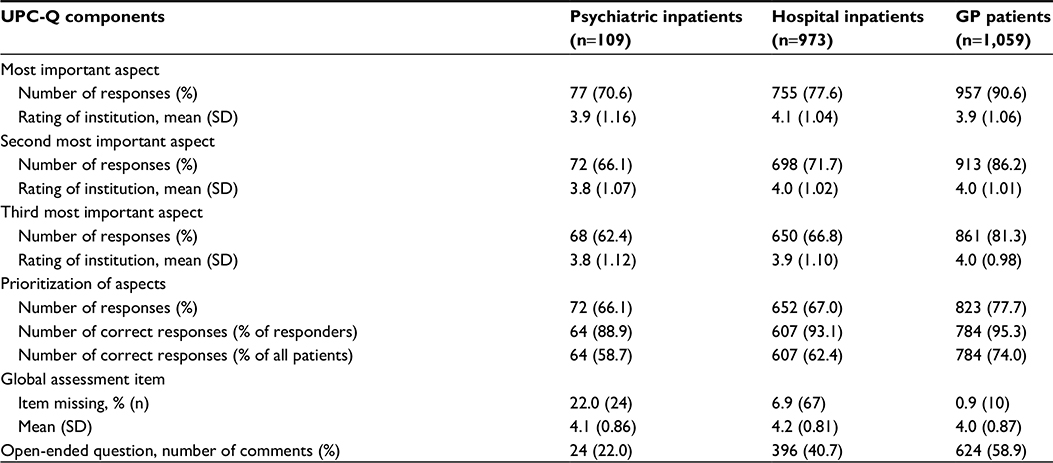 | Table 2 Descriptives for UPC-Q components by patient group Notes: Number of correct responses: each patient has six points to give to the chosen aspects. Hence, when the sum of allocated points equals six, the response is regarded as correct. Abbreviations: GP, general practitioner; SD, standard deviation; UPC-Q, Universal Patient Centeredness Questionnaire. |
The percentages of GP patients and hospital inpatients rating health care on at least one aspect were 90.6% and 77.6%, respectively (Table 2), and 95.3% and 93.1% were able to prioritize the different aspects. Ratings for the four quantitative items were skewed toward the positive for both GP patients and hospital inpatients, with the global experience item for hospital inpatients being highest, at 4.2. Open-ended comments were provided by 58.9% of the GP patients and 40.7% of the hospital inpatients.
The UPC-Q total score was skewed toward positive evaluations (Table 3), ranging from 75.2 for GP patients to 78.4 for hospital patients (on a scale from 0 to 100, where 100 is the best possible score). The internal consistency reliability of the UPC-Q scale was acceptable in all samples, with Cronbach’s alpha ranging from 0.74 for hospital patients to 0.78 for GP patients. Construct validity was supported by 20 of 21 significant associations between the UPC-Q and variables on patient-reported experiences, satisfaction and self-perceived health, except a lack of correlation between the UPC-Q and self-perceived health among GP patients (Table 3).
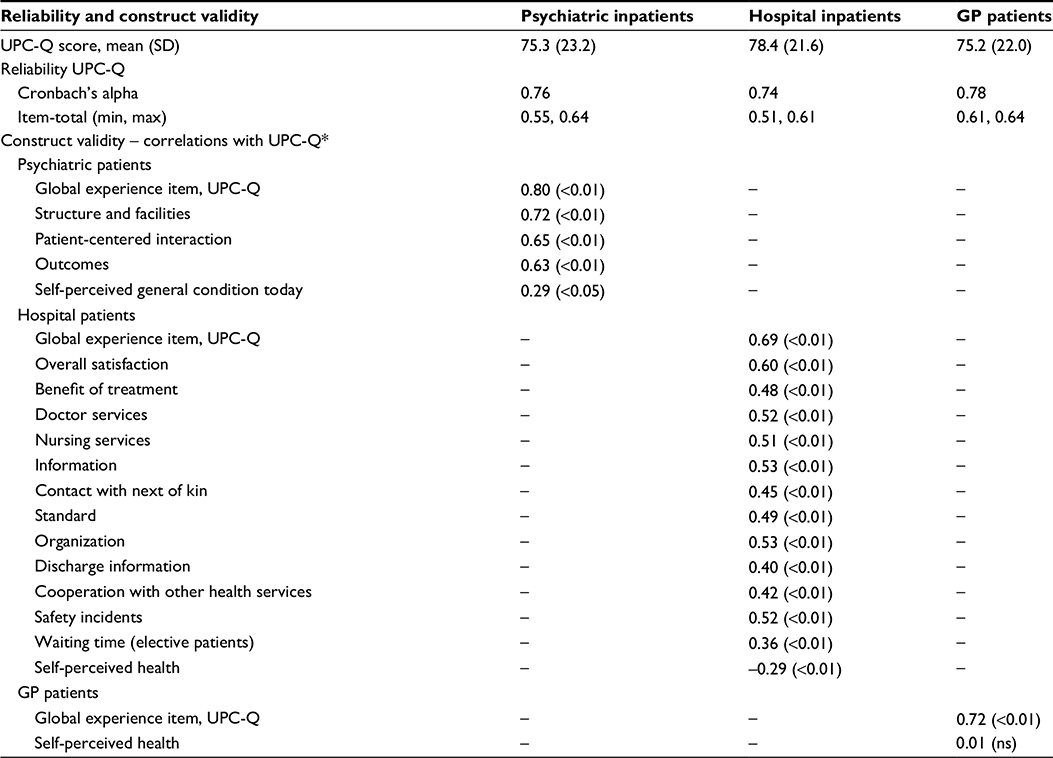 | Table 3 Tests of reliability and construct validity of the UPC-Q Notes: *Construct validity data are presented as correlations (Pearson’s r). Abbreviations: –, not relevant; GP, general practitioner; max, maximum; min, minimum; ns, not significant; SD, standard deviation; UPC-Q, Universal Patient Centeredness Questionnaire. |
The ceiling effect was smaller when using the unbalanced response scale than when using the balanced scale (Table 4): the differences were significant, and varied from 5.8 to 7.0 for the four rating items (on a scale from 0 to 100, where 100 is the best possible score). Multivariate regression analysis confirmed the presence of significant associations when controlling for the most important predictors of patient-reported experiences, age, and self-perceived health (results not shown).
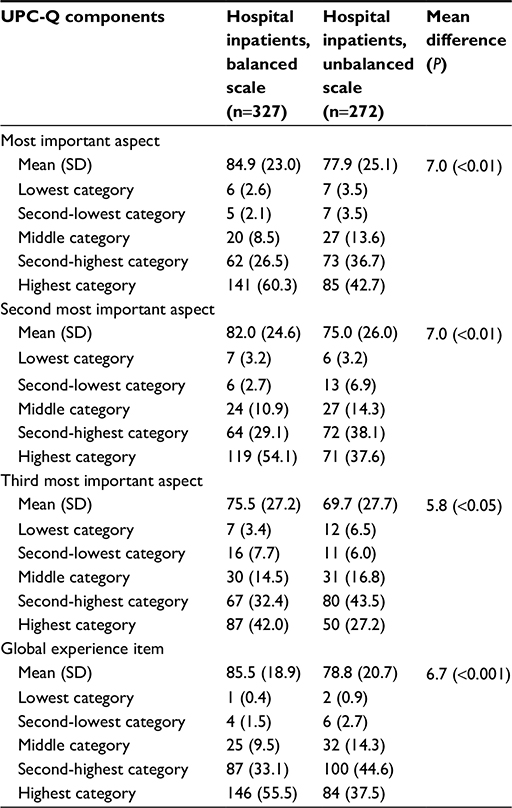 | Table 4 Item descriptives for two different response formats Notes: Data shown as n (%) unless otherwise specified. Balanced scale: very poor, rather poor, both poor and good, rather good, very good. Unbalanced scale: poor, fairly good, good, very good, excellent. Abbreviations: SD, standard deviation; UPC-Q, Universal Patient Centeredness Questionnaire. |
Discussion
The UPC-Q includes ratings of what patients consider to be most important when they use health care services, and it provides data that can be used for quality improvement and to monitor trends within and across patient populations. The UPC-Q functioned well in this study in terms of acceptance, internal consistency reliability, and construct validity among psychiatric inpatients, hospital inpatients, and GP patients.
The first part of the UPC-Q consists of three parts for obtaining an individual score for each patient, taking into account the three most important topics for the patient and weighting patient experiences according to the priority of each topic. This part was inspired by the individualized content of the concept of patient centeredness6,7 and operationalized by drawing on the content of the PGI,8 which is a widely used individualized quality-of-life measure.17 A systematic review of the PGI showed that the instrument was reliable for group comparisons and appeared valid, however, the review pointed to the lack of knowledge about cognition issues.18 The PGI has also been tested using cognitive interviews with cancer patients, with the results supporting its content validity but also revealing errors related to formatting and instructions.19 The first part of the UPC-Q took into account some of these findings: 1) by separating the prioritization from the two other parts, 2) by using a 5-point response category format, which is the most frequently used format for this topic,20 and 3) by labeling each response category.21 However, a smaller percentage of patients completed the first part of the UPC-Q than the global item in part two. Combined with the results obtained in the cognitive interviews this indicates that there were some cognition problems in this part among the elderly, and highlights the potential for future improvement of this part of the UPC-Q. One improvement area has already been identified in this study: the controlled study showed that the unbalanced response scale is preferable for reducing ceiling effects, which in turn improves the ability to measure changes over time and differences between providers.15
The second part of the UPC-Q consists of a global patient-experience item. Such items are widely known to produce skewed distributions and ceiling effects,2,12 which was also the case in the present study. The item was adjusted from the suggestion of an overall item in the UK by the Picker Institute,9 even though the UK chose the FFT instead of the suggestion from Picker.4 In our opinion, the FFT does not measure a patient-experiences construct, which is why we chose the approach adopted by the Picker Institute. The experience item might be compared over time or between providers or patient groups, although caution is necessary when interpreting differences across groups. For example, the presence of coercion in psychiatric services means that patient experiences on average are expected to be worse, and whether or not this reflects a lower quality of health care is a matter of debate. Moreover, the standardization of the global item enables such comparisons and provides a basis for discussions about the quality of care and patient experiences across patient groups. As mentioned earlier, the use of an unbalanced scale produced smaller ceiling effects, with these being almost 7 points lower on a scale from 0 to 100. The questions were still highly skewed, but around the same level as an overall satisfaction item in a previous study.12 While high scores do not mean there is no room for improvement, other response scales should be assessed in future studies to promote meaningful use of the UPC-Q in all contexts.
The third part of the UPC-Q consists of an open-ended question asking for improvement suggestions from the patient. This kind of semiqualitative data have been shown to be useful both in research10 and improvement work.4 For example, the preliminary evaluation of the FFT in the UK showed that the test has value as a tool for improving local services, with the acquisition of qualitative data being one of the reasons given.4 Furthermore, patient centeredness includes sensitivity to the preferences, needs, and values of individuals, which involves both measurement and improvement work. Asking patients to provide suggestions for improvements allows local providers to gather rich and useful material that can be used to improve aspects that local patients consider to be the most important. One of the prerequisites for improvement work based on patient experiences is knowledge about relevant interventions.22 Patients are a relevant and important source of information that can be gathered easily by the inclusion of the open-ended question in the UPC-Q.10,23
The national patient-experience surveys in Norway involve systematic measurements of patient experiences as a basis for quality improvement, health care management, patient choice, and public accountability. The UPC-Q was developed in this context, implying that it could be used broadly as both an internal and external quality indicator. The instrument might be used alone or in combination with other instruments, depending on the specific purpose and topic of interest. Perhaps the most promising use of the instrument is for local measurement and quality improvement. In this context, the brevity of the UPC-Q might facilitate higher response rates. The possibility of using the UPC-Q as a continuous measure of patient centeredness locally should also be assessed. The combination of patient-initiated quality improvement initiatives and continuous measurement can contribute to two components of patient centeredness: 1) effects of concrete improvement initiatives based on patient views and 2) effects of initiatives and continuous measurement on attitudes to patient centeredness among health care personnel.
Future research should assess the feasibility of using the UPC-Q as an external quality indicator, including its validity and discriminative power in this application. Our hypothesis is that the first part of the UPC-Q would function as an external quality indicator of patient centeredness, supplementing existing patient-experience indicators with an indicator of responsiveness to the preferences and priorities of individuals.
This study was subject to several limitations. The UPC-Q was only tested in three patient groups. Further research should therefore involve other patient groups both in primary and secondary health care settings. None of the investigations were performed at the national level, and so the results cannot be generalized to the total patient population, warranting the inclusion of larger and nationally representative samples in future studies. All surveys had substantial nonresponse and none included follow-up work to assess the amount of nonresponse bias. This causes uncertainty about the generalizability from the respondent sample to the total sample in all surveys. Furthermore, test–retest reliability and discriminative power at the unit level were not assessed. The UPC-Q consists of only one page, thus being less complete than standard patient-experience measures. The national surveys in Norway include questionnaires that average eight pages, which give users of the data responses to large numbers of questions on different aspects of patient experiences. The UPC-Q compensates for this limitation by asking what are the three most relevant topics. The UPC-Q should be supplemented by longer measures when the purpose of measurement requires more detailed information.
Conclusion
The UPC-Q includes ratings of what individual patients consider to be the most important aspects of health care services, while at the same time providing data for improving the quality of health care and making it possible to monitor trends within and across patient populations. Compared to the majority of generic questionnaires, the UPC-Q provides greater information on local conditions and possible local quality improvements. Furthermore, the UPC-Q collects information on patient centeredness, namely, preferences, needs, and values of individual patients and is therefore of added value to the generic range of patient-experience questionnaires. This study included psychiatric inpatients, hospital inpatients, and GP patients, and the results have shown that the UPC-Q performed well in terms of acceptance, internal consistency reliability, and construct validity. Future studies should test the UPC-Q in larger samples and other patient groups.
Acknowledgments
The authors thank Inger Opedal Paulsrud for administrative tasks and data collection in the patient-experience surveys and Tomislav Dimoski for developing the FS-system and for leading and carrying out the technical aspects of the inpatient hospital survey.
Disclosure
The authors report no conflicts of interest in this work.
References
Garratt AM, Solheim E, Danielsen K. National and Cross-National Surveys of Patient Experiences: A Structured Review. Oslo: Norwegian Knowledge Centre for the Health Services, Report 7-2008. | ||
Sjetne IS, Bjertnaes OA, Olsen RV, Iversen HH, Bukholm G. The Generic Short Patient Experiences Questionnaire (GS-PEQ): identification of core items from a survey in Norway. BMC Health Serv Res. 2011;11:88. | ||
Benson T, Potts HW. A short generic patient experience questionnaire: howRwe development and validation. BMC Health Serv Res. 2014;14:499. | ||
NHS England. Available from: https://www.england.nhs.uk/wp-content/uploads/2014/07/fft-rev1.pdf. Accessed February 5, 2016. | ||
Greaves F, Laverty AA, Millett C. Friends and family test results only moderately associated with conventional measures of hospital quality. BMJ. 2013;347:f4986. | ||
Scholl I, Zill JM, Härter M, Dirmaier J. An integrative model of patient-centeredness – a systematic review and concept analysis. PLoS One. 2014;9:e107828. | ||
Gerteis M, Edgman-Levitan S, Daley J, Delbanco TL. Through the Patient’s Eyes: Understanding and Promoting Patient-Centered Care. San Francisco, CA: Jossey-Bass; 1993. | ||
Ruta DA, Garratt AM, Leng M, Russell IT, MacDonald LM. A new approach to the measurement of quality of life. The Patient-Generated Index. Med Care. 1994;32:1109–1126. | ||
Picker Institute Europe. Available from: http://www.nhssurveys.org/Filestore/reports/Overarching_questions_for_patient_surveys_v3.pdf. Accessed February 5, 2016. | ||
Iversen HH, Bjertnæs OA, Skudal KE. Patient evaluation of hospital outcomes: an analysis of open-ended comments from extreme clusters in a national survey. BMJ Open. 2014;4:e004848. | ||
Anastario MP, Rodriguez HP, Gallagher PM, et al. A randomized trial comparing mail versus in-office distribution of the CAHPS Clinician and Group Survey. Health Serv Res. 2010;45:1345–1359. | ||
Bjertnaes OA, Sjetne IS, Iversen HH. Overall patient satisfaction with hospitals: effects of patient-reported experiences and fulfilment of expectations. BMJ Qual Saf. 2012;21:39–46. | ||
Ware JE Jr, Sherbourne CD. The MOS 36-item short-form health survey (SF-36). I. Conceptual framework and item selection. Med Care 1992;30:473–483. | ||
Streiner DL, Norman GR. Health Measurement Scales – A Practical Guide to Their Development and Use. 4th ed. Oxford: Oxford University Press; 2008. | ||
Kleefstra SM, Zandbelt LC, de Haes HJ, Kool RB. Trends in patient satisfaction in Dutch university medical centers: room for improvement for all. BMC Health Serv Res. 2015;15:112. | ||
Bjertnaes O, Iversen HH, Kjollesdal J. PIPEQ-OS – an instrument for on-site measurements of the experiences of inpatients at psychiatric institutions. BMC Psychiatry. 2015;15:234. | ||
Garratt AM. Evaluation of the stages of completion and scoring of the Patient Generated Index (PGI) in patients with rheumatic diseases. Qual Life Res. 2015;24:2625–2635. | ||
Martin F, Camfield L, Rodham K, Kliempt P, Ruta D. Twelve years’ experience with the Patient Generated Index (PGI) of quality of life: a graded structured review. Qual Life Res. 2007;16:705–715. | ||
Tavernier SS, Totten AM, Beck SL. Assessing content validity of the patient generated index using cognitive interviews. Qual Health Res. 2011;21:1729–1738. | ||
Sitzia J. How valid and reliable are patient satisfaction data? An analysis of 195 studies. Int J Qual Health Care 1999;11:319–328. | ||
Garratt AM, Helgeland J, Gulbrandsen P. Five-point scales outperform 10-point scales in a randomized comparison of item scaling for the Patient Experiences Questionnaire. J Clin Epidemiol. 2011;64:200–207. | ||
Riiskjaer E, Ammentorp J, Nielsen JF, Kofoed PE. Patient surveys – a key to organizational change? Patient Educ Couns. 2010;78:394–401. | ||
Riiskjær E, Ammentorp J, Kofoed PE. The value of open-ended questions in surveys on patient experience: number of comments and perceived usefulness from a hospital perspective. Int J Qual Health Care. 2012;24:509–516. |
 © 2016 The Author(s). This work is published and licensed by Dove Medical Press Limited. The full terms of this license are available at https://www.dovepress.com/terms.php and incorporate the Creative Commons Attribution - Non Commercial (unported, v3.0) License.
By accessing the work you hereby accept the Terms. Non-commercial uses of the work are permitted without any further permission from Dove Medical Press Limited, provided the work is properly attributed. For permission for commercial use of this work, please see paragraphs 4.2 and 5 of our Terms.
© 2016 The Author(s). This work is published and licensed by Dove Medical Press Limited. The full terms of this license are available at https://www.dovepress.com/terms.php and incorporate the Creative Commons Attribution - Non Commercial (unported, v3.0) License.
By accessing the work you hereby accept the Terms. Non-commercial uses of the work are permitted without any further permission from Dove Medical Press Limited, provided the work is properly attributed. For permission for commercial use of this work, please see paragraphs 4.2 and 5 of our Terms.