")
Back to Journals » Clinical Ophthalmology » Volume 9
Microcurrent stimulation in the treatment of dry and wet macular degeneration
Authors Chaikin L, Kashiwa K, Bennett M, Papastergiou G, Gregory W
Received 13 July 2015
Accepted for publication 31 August 2015
Published 17 December 2015 Volume 2015:9 Pages 2345—2353
DOI https://doi.org/10.2147/OPTH.S92296
Checked for plagiarism Yes
Review by Single anonymous peer review
Peer reviewer comments 3
Editor who approved publication: Dr Scott Fraser
Laurie Chaikin,1 Kellen Kashiwa,2 Michael Bennet,2 George Papastergiou,3 Walter Gregory4
1Private practice, Alameda, CA, USA; 2Retina Institute of Hawaii, Honolulu, HI, USA; 3California Retinal Associates, San Diego, CA, USA; 4Clinical Trials Research Unit, Faculty of Medicine and Health, University of Leeds, Leeds, UK
Purpose: To determine the safety and efficacy of the application of transcutaneous (transpalpebral) microcurrent stimulation to slow progression of dry and wet macular degeneration or improve vision in dry and wet macular degeneration.
Methods: Seventeen patients aged between 67 and 95 years with an average age of 83 years were selected to participate in the study over a period of 3 months in two eye care centers. There were 25 eyes with dry age-related macular degeneration (DAMD) and six eyes with wet age-related macular degeneration (WAMD). Frequency-specific microcurrent stimulation was applied in a transpalpebral manner, using two programmable dual channel microcurrent units delivering pulsed microcurrent at 150 µA for 35 minutes once a week. The frequency pairs selected were based on targeting tissues, which are typically affected by the disease combined with frequencies that target disease processes. Early Treatment Diabetic Retinopathy Study or Snellen visual acuity (VA) was measured before and after each treatment session. All treatment was administered in a clinical setting.
Results: Significant increases were seen in VA in DAMD (P=0.012, Wilcoxon one-sample test), but in WAMD, improvements did not reach statistical significance (P=0.059). In DAMD eyes, twice as many patients showed increase in VA (52%) compared to those showing deterioration (26%), with improvements being often sizeable, whereas deteriorations were usually very slight. In WAMD eyes, five of six (83%) patients showed an increase and none showed deterioration.
Conclusion: The substantial changes observed over this period, combined with continued improvement for patients who continued treatment once a month, are encouraging for future studies. The changes observed indicate the potential efficacy of microcurrent to delay degeneration and possibly improve age-related macular degeneration, both wet and dry. However, this study has no control arm, so results should be treated with caution. Randomized double-blind controlled studies are needed to determine long-term effects.
Keywords: microcurrent, macular degeneration, transpalpebral, transcutaneous, retinal disease
Introduction
Low-intensity micro-amperage current has been applied to retinal conditions for several decades under various circumstances. Henry Dor, MD, an ophthalmologist in Germany, used electrical currents to help individuals with amblyopia, retinochoroiditis, glaucoma, and optic atrophy in 1873.1 In a summary paper by Gekeler and Bartz-Schmidt, subthreshold visual stimulation in inactive retinal implants leading to improvements in residual areas of vision was stated to be the result of a release of neurotrophic factors.2 Twenty peer-reviewed publications in PubMed over the last 5 years reflect renewed interest in microcurrent therapy.3 Since then, transcorneal electrical stimulation (TES) and transpalpebral electrical stimulation (TPES) placement of the electrodes over the closed lid has been used. A study by Shinoda et al in 2008 applied this approach to 16 patients with wet age-related macular degeneration (WAMD) and to five with dry age-related macular degeneration (DAMD). They used four frequencies of 290 Hz, 31 Hz, 8.9 Hz, and 28 Hz delivered via a monophasic pulse at 800 μA. Subjects with both WAMD and DAMD showed statistically significant log of the minimum angle of resolution (logMAR) improvements, from 29.5 logMAR units to 31.8 logMAR units (WAMD, P=0.04) and from 39.8 logMAR units to 42.9 logMAR units (DAMD, P=0.04), comparing pre- and 4-week posttreatment results.3 In 2013, Anastassiou published results from a randomized placebo-controlled exploratory trial with 22 patients using a TPES approach with variable frequencies of 5–80 Hz at 150–220 μA twice a day treatment to eight spots around the eyes for 40 seconds per spot for 1 week. At the end of the week, they found that seven out of 12 patients had an improvement in visual acuity (VA) of more than five letters (P=0.001). Similarly contrast sensitivity improved with an increase of >4.4 optotypes (P=0.006). Placebo controls had no statistically significant change in VA.4
Basic research both in vitro and in vivo demonstrating the safety and neuroprotective effects of electrical current stimulation has been done in a number of areas. Motor axonal regeneration, sensory nerve regeneration, and growth-associated gene expression were found to be significantly enhanced by brief periods of micro-amperage stimulation.5 Increased survival of retinal ganglion cells in rats following crushed optic nerve as well as significant delay of posttraumatic cell death was described.6,7 Increased visual evoked potential amplitude following optic nerve crush (early stage).5 Electroretinogram measurements showed amelioration of progressive photoreceptor degeneration following light-induced retinal damage,8 as well as neuroprotection through proinflammatory effects.9 Alteration in gene expression was demonstrated, where close to 500 transcriptome changes were measured and included potentially neuroprotective genes as well as genes that moderate the expression of tumor necrosis factor (TNF).10 Retinal photoreceptor protective effects were demonstrated in rhodopsin P347L-deficient rabbits via electroretinogram,11 as well as neuroprotection from ischemic damage.12 Increase in cerebral blood flow in rats following TES of trigeminal afferents even after being subjected to subarachnoid hemorrhage induced vasospasm.13 In all human studies, there were no adverse effects aside from short-term corneal irritation from the contact electrode and, in most cases, there were notable and sometimes significant improvements in vision. All studies were small; some had sham controls. Effective use of TES for eye conditions included nonarteritic ischemic neuropathy,14 branch retinal vein occlusion,15 Stargardt’s disease,16 retinitis pigmentosa,17 and Best vitelliform retinopathy.18 Frequency-specific microcurrent (FSM) has been used extensively in the field of physical medicine and rehabilitation for pain relief and accelerating tissue recovery.19 This approach proposes that it is not only the microcurrents that have a positive effect on biological tissue but also the frequencies themselves. Frequencies are delivered via a square-wave pulse train. Square-wave pulse trains contain a wide range of harmonics, which can stimulate a resonance effect in target tissues. One well-known resonance effect is in sound acoustics breaking down the binding of lead atoms in crystal glass enabling it to shatter. In tissue pathology, the resonance could potentially break molecular bonds responsible for inflammation. For example, an animal model was used to test the anti-inflammatory effect in the immune system.20 Arachidonic acid was painted on mouse ears to create inflammation. The frequency combination of 40 Hz and 116 Hz for inflammation in the immune system was run through the ears immediately afterward, and ear thickness measurements were made after treatment. In the sham treatment, a different frequency combination of 40 Hz/0 Hz was run, and the results were measured. The treatment group showed a 62% reduction of lipoxygenase-mediated inflammation and 30% reduction of cyclooxygenase-mediated inflammation at 4 minutes, while the sham group showed no change. Treated ear thickness reduced by 62% compared to controls.20 All information about which frequencies are used with which tissues is derived from course information provided by www.frequencyspecific.com.
A human case study published in 2010 showed successful treatment of herpes zoster on ophthalmic branch of CN V with FSM using 190-minute treatment at 230 Hz and 430 Hz.21 In a clinical study of pain, in 77 fibromyalgia patients, statistically significant subjective improvements in pain were associated with reductions in inflammatory cytokines by a factor of 10–20 times in 90 minutes: interleukin (IL)-1 from 392 pg/mL to 21 pg/mL, TNF-α from 299 pg/mL to 21 pg/mL, and IL-6 from 204 pg/mL to 15 pg/mL.22 This study explored the question whether FSM utilizing a TPES approach could provide similar efficacy and safety results. Study objectives included change in VA from baseline to 3 months, changes in retinal thickness as measured by optical coherence tomography (OCT), and changes in microperimetry, as measured by Nidek MP-3 microperimeter. Not all subjects were able to complete the microperimetry testing.
Methods
Seventeen patients aged between 67 and 95 years with an average age of 82.9 years were tested and treated in two eye care centers located at the Retina Institute of Hawaii in Honolulu and a private practice in Castro Valley, CA, USA. There were 25 eyes with DAMD and six eyes with WAMD. All patients were screened for inclusion after providing written informed consent. The research followed the tenants of the Declaration of Helsinki, and an independent review board application was completed and approved by Sterling Independent Review Board (Atlanta, GA, USA) prior to subject selection. The trial was registered with number NCT01790958.
Inclusion criterion were >50 years of age or older, male and female, history of retinal disease involvement, no antivascular endothelial growth factor treatments for at least 3 months prior to the study, and no new antioxidant/vitamin supplementation for at least 6 months prior to the study. Subjects with WAMD were placed in the study only after they were medically cleared as having no active bleeding. Exclusion criteria included a history of noncompliance with regular medical visits, significant media opacities that might interfere with assessing VA, presence of pigment epithelial tears or rips, diabetic retinopathy, any known serious allergies to fluorescein dye, presence of retinal neovascularization, or any treatment with investigation agents in the past 30 days.
Screening procedures included best-corrected VA (VA determined by staff low vision optometrist), ophthalmic examination, intraocular pressure measurement, fluorescein angiography, fundus photography, and OCT per standard of care; these tests were performed no earlier than 14 days prior to initiation of the treatment and were performed by qualified personnel. Qualified personnel consisted of licensed low vision optometrists, ophthalmic technicians, and ophthalmologists.
After initial screening, patients returned for regular clinic examinations and diagnostic testing per standard of care. These visits were conducted depending on the type and severity of the retinal disease condition per standard of care. Vitals (blood pressure, weight, and pulse), VA, intraocular pressure measurements, OCT, and dilated eye examinations were performed per standard of care. Fundus photos, fluorescein angiograms, and microperimetry were obtained based on standard of care and severity of disease.
In some cases, VA was measured using Snellen acuity, which then was converted to the logMAR scores. In the cases of count fingers, hand motion, light perception, or no light perception, the following convention was used: count fingers =1.6, hand motion =2.0, light perception =2.5, and no light perception =3.0 logMAR units, as described by Cohen et al.23 Because treatment intervals varied slightly from patient to patient, and patients were followed-up for varying lengths of time, in order to calculate mean logMAR changes over time it was necessary both to interpolate logMAR values between one time point and the next, and to make assumptions about the pattern of logMAR results beyond the longest follow-up time for each patient. It was therefore assumed that changes from one time point to the next followed a linear pattern. In this way, it was possible to derive an imputed logMAR score for every day from the start of treatment for each patient. The so-called linear increment method was then used to extrapolate beyond the follow-up of an individual patient.24 This method involves projecting the pattern of change for the individual patient beyond their own follow-up by allowing each individual’s values to follow the overall pattern of the whole cohort from day-to-day.24 Thus, the mean values are not compromised by dropouts. The standard error (SE) of the mean and, therefore, the confidence interval (CI) on the mean are based on the number of actual values at that time point; the values carried forward are used in calculating the mean, but not the SE. This method is used in Figures 3 and 4.
To evaluate the significance of overall changes in VA over time, the overall difference in the letter count was calculated for each patient and the significance of these differences was evaluated using the Wilcoxon one-sample test (Wilcoxon signed-rank sum test); if differences were random, the median of these values was expected to be 0.
FSM stimulation was applied in a transpalpebral manner, with flat carbon electrodes placed into chamois-type fabric, which was moistened with water and placed over the closed eyes; another electrode was placed at the base of the skull (Figure 1). Two small dual channel programmable microcurrent units utilizing a direct current source (Custom Care Manufacturing Microcurrent Technologies, Seattle, WA, USA, and Precision Distributing, Vancouver, WA, USA) were programmed with the FSM protocol. The treatment time was 35 minutes, and all treatments were administered in a clinical setting. The frequency pairs selected were based on targeting tissues, which are typically affected by the disease and combining with frequencies that target disease processes. For example frequencies pairs included 40 Hz with 95 Hz for inflammation in the retina and macula (137 Hz), scarring and inflammation in the arteries, veins, capillaries, and retina (3 Hz and 13 Hz with 62 Hz, 79 Hz, 162 Hz, and 95 Hz) among others. Current was delivered at 150 μA, and frequency was delivered via a ramped square-wave pulse train. Early Treatment Diabetic Retinopathy Study or Snellen VA was measured before and after each treatment session, and subjective responses were recorded. Number of treatments was determined by condition severity and patient response. The number of treatments ranged from 2 to 10, with an average of 4.8 sessions.
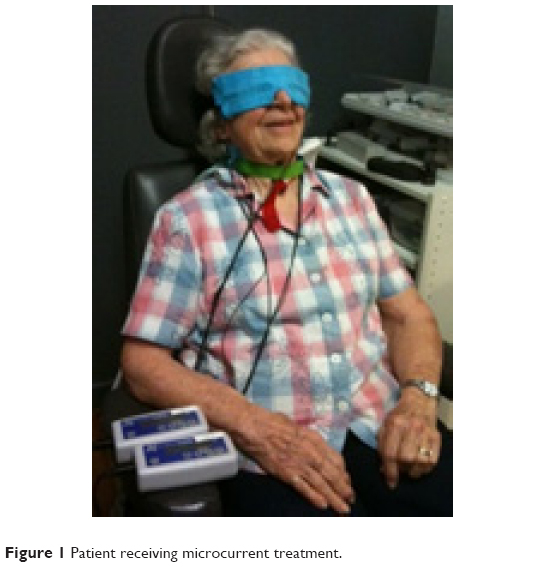 | Figure 1 Patient receiving microcurrent treatment. |
Results
Tables 1 and 2 show the VA scores before and after treatment. Absolute logMAR changes from the baseline values over the first 3 months are shown for DAMD and WAMD eyes in Figures 2 and 3, respectively. The no-change line is added for reference. Many eyes show an initial sharp logMAR drop, with a few patients showing no improvement or a very slight deterioration. Overall mean changes over time with 95% CI on these means are shown for dry and wet eyes in Figures 4 and 5, respectively, using the approach described in the “Methods” section. For these mean changes, similar patterns are observed in both eyes, with a sharp fall, indicating improvement in VA, seen over approximately the first week or so, and continuing improvement throughout the first month. Subsequently, the logMAR scores appear to level off. There may be some slight deterioration in the next 2 months; though numbers become small, the CIs are wide. The upper 95% CIs on these means are consistently well below 0, indicating a highly statistically significant effect, which begins almost immediately. Choosing to compare logMAR values at 21 days, since only two WAMD eyes have follow-up at 30 days, whereas all six have follow-up at 21 days, the 21-day logMAR mean was 3.8 SEs below 0 in DAMD eyes (P=0.0001) and 3.9 SEs below 0 in WAMD eyes (P=0.0001), a very similar order of magnitude of effect.
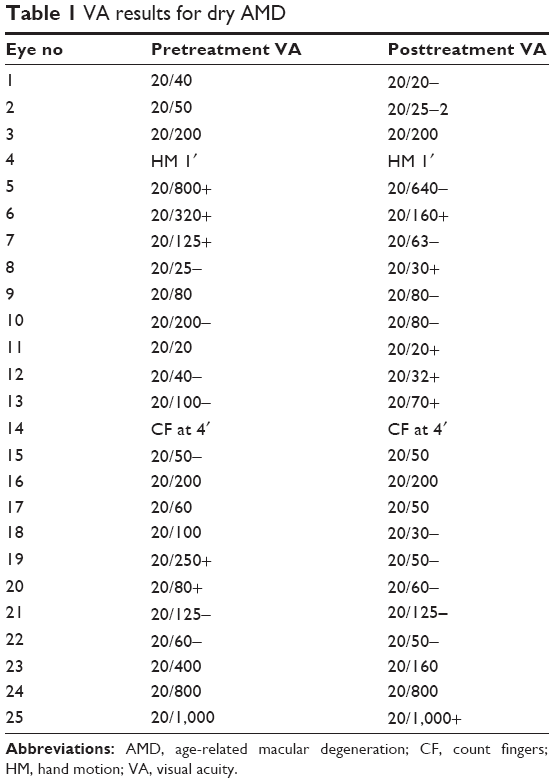 | Table 1 VA results for dry AMD |
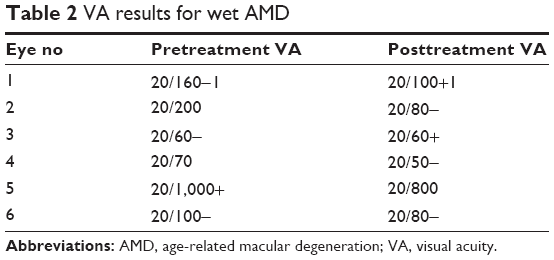 | Table 2 VA results for wet AMD |
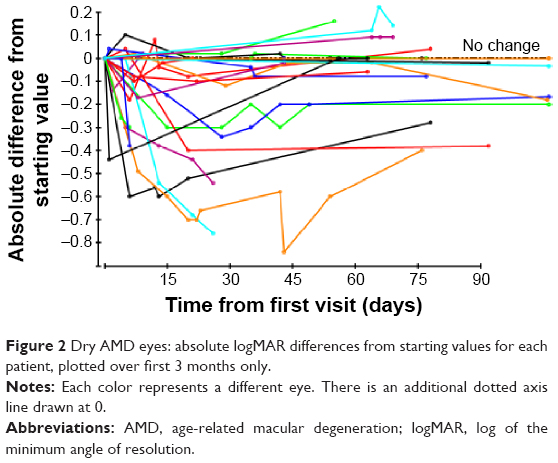 | Figure 2 Dry AMD eyes: absolute logMAR differences from starting values for each patient, plotted over first 3 months only. |
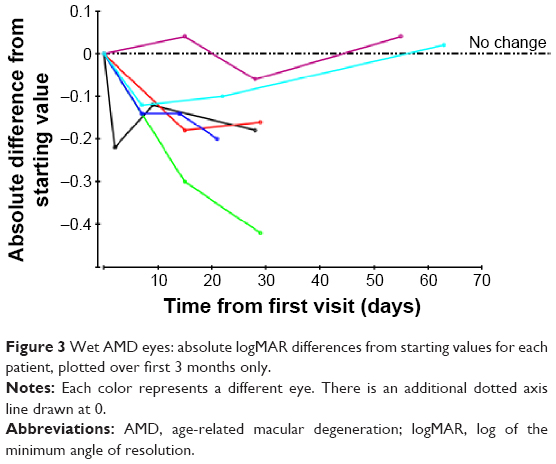 | Figure 3 Wet AMD eyes: absolute logMAR differences from starting values for each patient, plotted over first 3 months only. |
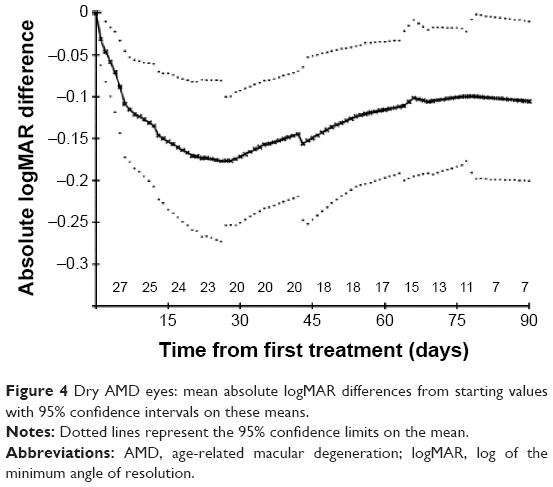 | Figure 4 Dry AMD eyes: mean absolute logMAR differences from starting values with 95% confidence intervals on these means. |
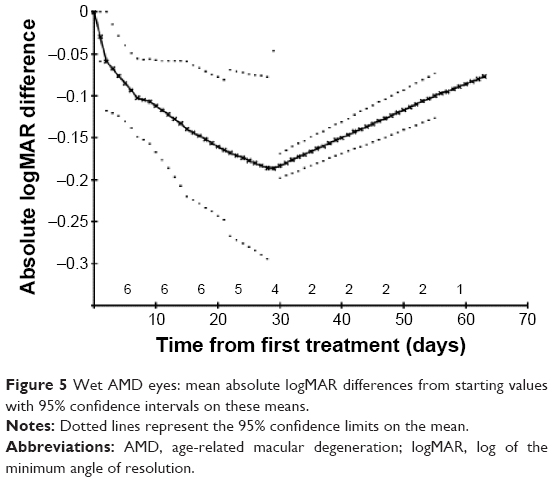 | Figure 5 Wet AMD eyes: mean absolute logMAR differences from starting values with 95% confidence intervals on these means. |
The histograms in Figures 6 and 7 show the mean letter changes from baseline to final visit by eye. There is significant change in VA scores in DAMD (P=0.012, Wilcoxon one-sample test). In WAMD, changes did not reach statistical significance (P=0.059). With only six values, all six WAMD eyes would have had to show improvements for this result to be significant, whereas, in fact, five eyes showed improvement and one showed no change. In DAMD eyes, twice as many patients showed a positive trend (52%) compared to those showing deterioration (26%), and the changes were often sizeable, whereas deteriorations were usually very slight (Figures 1 and 5). In WAMD eyes, five of six (83%) patients again showed a positive trend, while none showed deterioration.
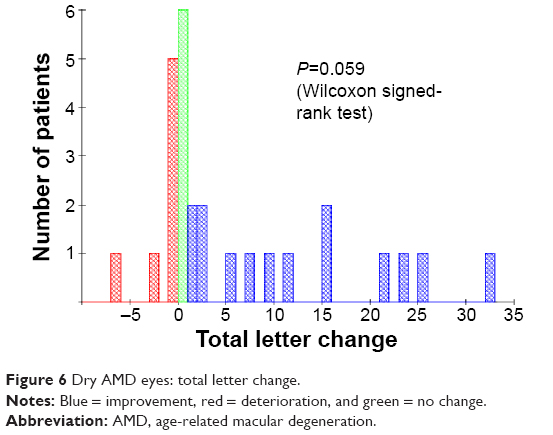 | Figure 6 Dry AMD eyes: total letter change. |
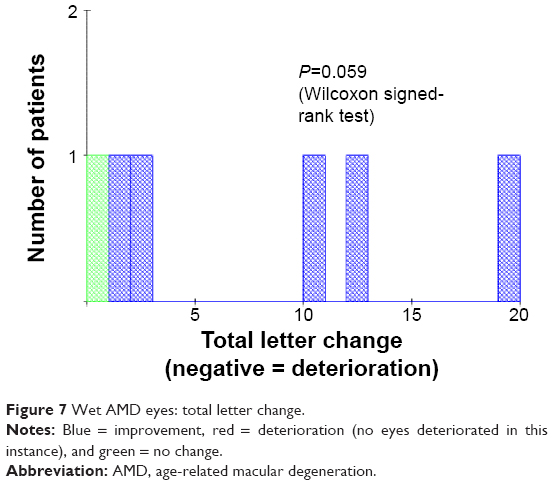 | Figure 7 Wet AMD eyes: total letter change. |
Of the patients who had microperimetry testing done, there was an overall increased retinal sensitivity across the board following microcurrent stimulation (Figures 8 and 9). Some patients, however, with large areas of geographic atrophy tended to increase their sensitivity in areas of their preferred retinal locus, where others with smaller to no areas of geographic atrophy increased their sensitivity in their fovea. There were no changes in retinal thickness measured by OCT.
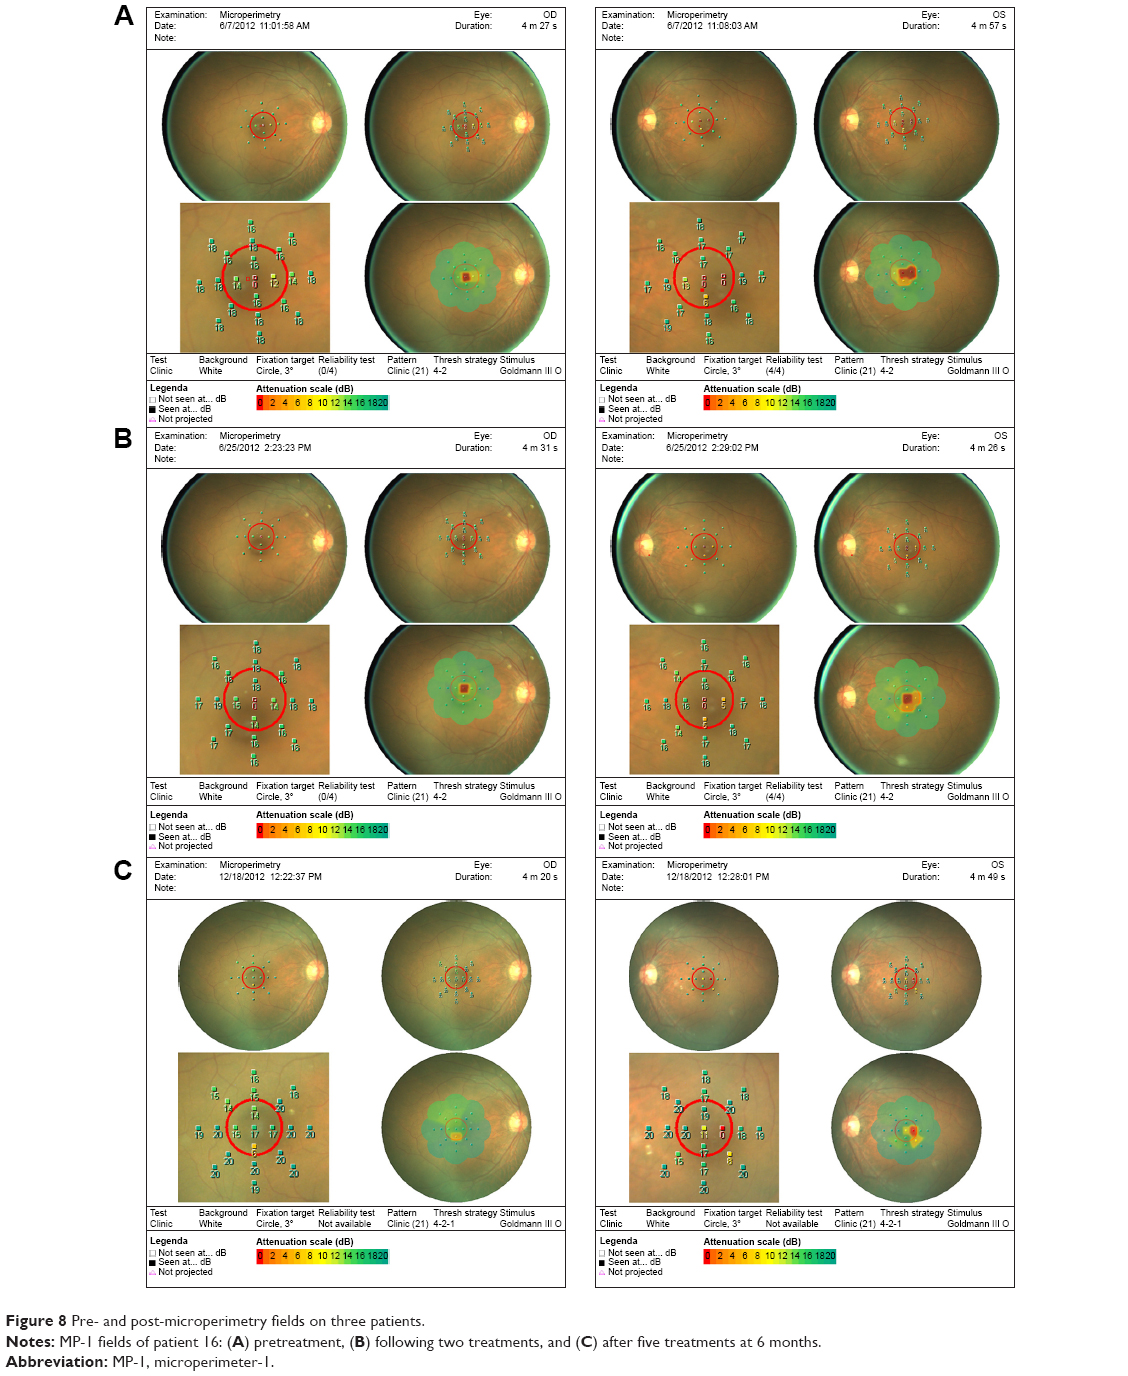 | Figure 8 Pre- and post-microperimetry fields on three patients. |
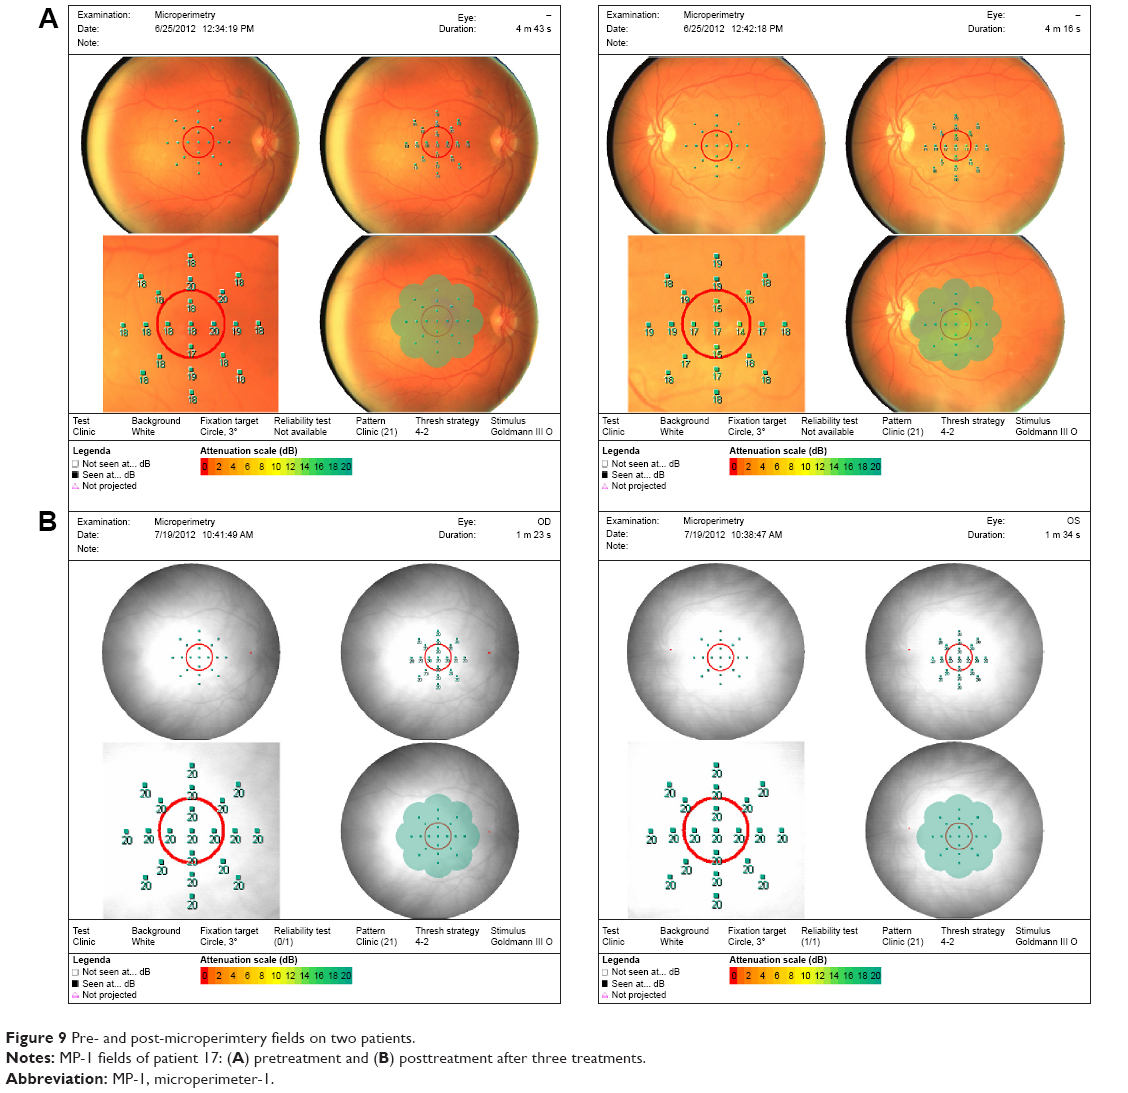 | Figure 9 Pre- and post-microperimtery fields on two patients. |
Discussion
In this study, dual channel FSM therapy was used in a noninvasive procedure, involving transcutaneous electrical current with very low intensity. Clinically, if further studies support positive trends over time, this would be a relatively easy treatment modality for physicians to offer their patients, either as a weekly in-office treatment or a home-based therapy. Interested clinicians would benefit from a course, such as the one available at www.frequencyspecific.com.
Mechanisms of possible tissue effects that may explain some of the changes in visual function by FSM are theoretical. No direct measures of tissue changes were taken. Many of the following hypotheses are derived from animal models using TES:
- Effects on the mitochondrial Krebs cycle increase production of intracellular adenosine triphosphate. Transmembrane transport through voltage-gated ion channels is dependent on adenosine triphosphate. Voltage-gated ion channels may be positively influenced by the presence of external current flow, enabling the configuration change that precedes ion flow.19
- Influence of extremely low-frequency electromagnetic fields has been demonstrated to have beneficial and therapeutic effects on voltage-gated calcium channels via influence on the G-protein channel through the nitric oxide-cyclic GMP–protein kinase pathway.25
- Alteration in gene expression, such as upregulation of Bcl-2, ciliary neurotrophic factor, and brain-derived neurotrophic factor; downregulation of Bax; suppression or inhibition of inflammatory factors, such as IL-1β and TNF-α; and transcriptome changes in 490 genes have been identified, including neuroprotective genes, such as Bax or those that are part of the TNF family. Additionally, upregulation of intrinsic insulin-like growth factor-1 (Mueller cell activation and diffusion into the inner retina) was found.9,10
- Increase in choroidal vessel blood flow in normal human subjects, measured in ten healthy subjects following TES using a laser speckle flowgraphy, showed that there was statistically significant increase in blood flow in the macular zone, which may account for the improvements in patients with ischemia.26
Although, the majority of the patients demonstrated both subjective and objective improvements, follow-up is still relatively short and determination of long-term efficacy is as yet unproven. Further, the training effects of repeated VA measures are unknown and the VA testers were not blinded, adding the possibility of examiner bias. The magnitude of changes in VA in this patient population was similar to that seen by Shinoda et al3 and perhaps less than that reported by Anastassiou, although follow-up was extremely short in the latter study. It is unclear whether and to what degree early improvements were subsequently abrogated in this group of patients, since follow-up varied considerably from patient to patient. However, those patients who continued treatment once a month, for at least 6 months, maintained their VA gains. There was sufficient follow-up to enable mean changes over time to be determined, as in Figures 3 and 4, for at least the first 30 days. The substantial changes observed over this period, combined with continued improvement for patients who continued treatment once a month, are encouraging for future studies, which could be made double-blind by including a control arm with sham treatment.
It is likely that patients would need to continue treatment for the duration of their lives, since the natural course of disease progression for age-related macular degeneration is a steady loss of vision. In the case of DAMD, there is a slow steady decline over what could be a long period (10 years or more), with the possibility of geographic atrophy occurring in a steady but more rapid decline with complete loss of central vision. In the case of WAMD, there is rapid precipitous loss of vision over a very short (days to months) time if left untreated. This efficacy and safety study suggests that microcurrent stimulation can be safely administered to this population.
Disclosure
None of the authors have any financial interest in the equipment used, and report no conflicts of interest in this work.
References
Dor H. Beitrage zur Electrotherapie der Augenkrankheiten. [Contributions for electrotherapy of eye diseases]. Graefes Arch Clin Exp Ophthalmol. 1873;19:352. German. | ||
Gekeler F, Bartz-Schmidt K. Electrical stimulation: a therapeutic strategy for retinal and optic nerve disease? Graefes Arch Clin Exp Ophthalmol. 2012;250:161–163. | ||
Shinoda K, Imamura Y, Matsuda S, et al. Transcutaneous electrical retinal stimulation therapy for age-related macular degeneration. Open Ophthalmol J. 2008;2:132–136. | ||
Anastassiou G, Schneegans AL, Selbach M, Kremmer S. Transpalpebral electrotherapy for dry age-related macular degeneration (AMD): an exploratory trial. Restor Neurol Neurosci. 2013;31:571–578. | ||
Ni YQ, Gan DK, Xu HD, Xu GZ, Da CD. Neuroprotective effect of transcorneal electrical stimulation on light-induced photoreceptor degeneration. Exp Neurol. 2009;219:439–452. | ||
Tagami Y, Kurimoto T, Miyoshi T, Morimoto T, Sawai H, Mimura O. Axonal regeneration induced by repetitive electrical stimulation of crushed optic nerve in adult rats. Jpn J Ophthalmol. 2009;53:257–266. | ||
Henrich-Noack P, Voigt N, Prilloff S, Fedorov A, Sabel BA. Transcorneal electrical stimulation alters morphology and survival of retinal ganglion cells after optic nerve damage. Neurosci Lett. 2013;543:1–6. | ||
Morimoto T, Fujikado T, Choi JS, et al. Transcorneal electrical stimulation promotes the survival of photoreceptors and preserves retinal function in royal college of surgeons rats. Invest Ophthalmol Vis Sci. 2007;48:4725–4732. | ||
Zhou WT, Ni YQ, Jin ZB, et al. Electrical stimulation ameliorates light-induced photoreceptor degeneration in vitro via suppressing the proinflammatory effect of microglia and enhancing the neurotrophic potential of Müller cells. Exp Neurol. 2012;238:192–208. | ||
Willmann G, Schäferhoff K, Fischer MD, et al. Gene expression profiling of the retina after transcorneal electrical stimulation in wild-type Brown Norway rats. Invest Ophthalmol Vis Sci. 2011;52:7529–7537. | ||
Morimoto T, Kanda H, Kondo M, Terasaki H, Nishida K, Fujikado T. Transcorneal electrical stimulation promotes survival of photoreceptors and improves retinal function in rhodopsin P347L transgenic rabbits. Invest Ophthalmol Vis Sci. 2012;53:4254–4261. | ||
Wang X, Mo X, Li D, et al. Neuroprotective effect of transcorneal electrical stimulation on ischemic damage in the rat retina. Exp Eye Res. 2011;93:753–760. | ||
Atalay B, Bolay H, Dalkara T, Soylemezoglu F, Oge K, Ozcan OE. Transcorneal stimulation of trigeminal nerve afferents to increase cerebral blood flow in rats with cerebral vasospasm: a noninvasive method to activate the trigeminovascular reflex. J Neurosurg. 2002;97:1179–1183. | ||
Fujikado T, Morimoto T, Matsushita K, Shimojo H, Okawa Y, Tano Y. Effect of transcorneal electrical stimulation in patients with nonarteritic ischemic optic neuropathy or traumatic optic neuropathy. Jpn J Ophthalmol. 2006;50:266–273. | ||
Oono S, Kurimoto T, Kashimoto R, Tagami Y, Okamoto N, Mimura O. Transcorneal electrical stimulation improves visual function in eyes with branch retinal artery occlusion. Clin Ophthalmol. 2011;5:397–402. | ||
Röck T, Schatz A, Naycheva L, et al. Effects of transcorneal electrical stimulation in patients with Stargardt’s disease. Ophthalmologe. 2013;110:68–73. | ||
Schatz A, Röck T, Naycheva L, et al. Transcorneal electrical stimulation for patients with retinitis pigmentosa: a prospective, randomized, sham-controlled exploratory study. Invest Ophthalmol Vis Sci. 2011;52:4485–4496. | ||
Ozeki N, Shinoda K, Ohde H, Ishida S, Tsubota K. Improvement of visual acuity after transcorneal electrical stimulation in case of Best vitelliform macular dystrophy. Graefes Arch Clin Exp Opthalmol. 2013;251:1867–1970. | ||
Mcmakin C. Frequency Specific Microcurrent in Pain Management. Edinburgh: Churchill/Livingstone/Elsevier; 2011. | ||
Reilly W. Anti-inflammatory effects of interferential, frequency specific applied microcurrent. In: AHMR Congress; Melbourne, Australia 2004. | ||
McMakin C. Non-pharmacologic treatment of shingles. Pract Pain Manag. 2010;10:24–29. | ||
McMakin C, Gregory W, Phillips T. Cytokine changes with microcurrent treatment of fibromyalgia associated with cervical spine trauma. J Bodyw Mov Ther. 2005;9:169–176. | ||
Cohen D, Levy J, Lifshitz T, et al. The outcomes of primary scleral buckling during repair of posterior segment open-globe injuries. Biomed Res Int. 2014;2014:6. [Article ID 613434]. | ||
Diggle PJ, Farewell DM, Henderson R. Analysis of longitudinal data with drop-out: objectives, assumptions and a proposal. J R Stat Soc Ser C Appl Stat. 2007;56:499–550. | ||
Pall M. Electromagnetic fields act via activation of voltage-gated calcium channels to produce beneficial or adverse effects. J Cell Mol Med. 2013;17:958–965. | ||
Kurimoto T, Oono S, Oku H, et al. Transcorneal electrical stimulation increases chorioretinal blood flow in normal human subjects. Clin Ophthalmol. 2010;4:1441–1446. |
 © 2015 The Author(s). This work is published and licensed by Dove Medical Press Limited. The full terms of this license are available at https://www.dovepress.com/terms.php and incorporate the Creative Commons Attribution - Non Commercial (unported, v3.0) License.
By accessing the work you hereby accept the Terms. Non-commercial uses of the work are permitted without any further permission from Dove Medical Press Limited, provided the work is properly attributed. For permission for commercial use of this work, please see paragraphs 4.2 and 5 of our Terms.
© 2015 The Author(s). This work is published and licensed by Dove Medical Press Limited. The full terms of this license are available at https://www.dovepress.com/terms.php and incorporate the Creative Commons Attribution - Non Commercial (unported, v3.0) License.
By accessing the work you hereby accept the Terms. Non-commercial uses of the work are permitted without any further permission from Dove Medical Press Limited, provided the work is properly attributed. For permission for commercial use of this work, please see paragraphs 4.2 and 5 of our Terms.