")
Back to Journals » Nature and Science of Sleep » Volume 7
Evaluation of an automated single-channel sleep staging algorithm
Authors Wang Y, Loparo K, Kelly M, Kaplan R
Received 27 March 2015
Accepted for publication 30 June 2015
Published 18 September 2015 Volume 2015:7 Pages 101—111
DOI https://doi.org/10.2147/NSS.S77888
Checked for plagiarism Yes
Review by Single anonymous peer review
Peer reviewer comments 3
Editor who approved publication: Dr Steven A Shea
Ying Wang,1 Kenneth A Loparo,1,2 Monica R Kelly,3 Richard F Kaplan1
1General Sleep Corporation, Euclid, OH, 2Department of Electrical Engineering and Computer Science, Case Western Reserve University, Cleveland, OH, 3Department of Psychology, University of Arizona, Tucson, AZ, USA
Background: We previously published the performance evaluation of an automated electroencephalography (EEG)-based single-channel sleep–wake detection algorithm called Z-ALG used by the Zmachine® sleep monitoring system. The objective of this paper is to evaluate the performance of a new algorithm called Z-PLUS, which further differentiates sleep as detected by Z-ALG into Light Sleep, Deep Sleep, and Rapid Eye Movement (REM) Sleep, against laboratory polysomnography (PSG) using a consensus of expert visual scorers.
Methods: Single night, in-lab PSG recordings from 99 subjects (52F/47M, 18–60 years, median age 32.7 years), including both normal sleepers and those reporting a variety of sleep complaints consistent with chronic insomnia, sleep apnea, and restless leg syndrome, as well as those taking selective serotonin reuptake inhibitor/serotonin–norepinephrine reuptake inhibitor antidepressant medications, previously evaluated using Z-ALG were re-examined using Z-PLUS. EEG data collected from electrodes placed at the differential-mastoids (A1–A2) were processed by Z-ALG to determine wake and sleep, then those epochs detected as sleep were further processed by Z-PLUS to differentiate into Light Sleep, Deep Sleep, and REM. EEG data were visually scored by multiple certified polysomnographic technologists according to the Rechtschaffen and Kales criterion, and then combined using a majority-voting rule to create a PSG Consensus score file for each of the 99 subjects. Z-PLUS output was compared to the PSG Consensus score files for both epoch-by-epoch (eg, sensitivity, specificity, and kappa) and sleep stage-related statistics (eg, Latency to Deep Sleep, Latency to REM, Total Deep Sleep, and Total REM).
Results: Sensitivities of Z-PLUS compared to the PSG Consensus were 0.84 for Light Sleep, 0.74 for Deep Sleep, and 0.72 for REM. Similarly, positive predictive values were 0.85 for Light Sleep, 0.78 for Deep Sleep, and 0.73 for REM. Overall, kappa agreement of 0.72 is indicative of substantial agreement.
Conclusion: This study demonstrates that Z-PLUS can automatically assess sleep stage using a single A1–A2 EEG channel when compared to the sleep stage scoring by a consensus of polysomnographic technologists. Our findings suggest that Z-PLUS may be used in conjunction with Z-ALG for single-channel EEG-based sleep staging.
Keywords: EEG, sleep staging, algorithm, Zmachine, automatic sleep scoring, sleep detection, single channel
Introduction
Sleep–wake and sleep cycle estimation is of interest to both clinical applications and scientific studies. Overnight polysomnography (PSG), which uses electroencephalography (EEG), electrooculography, and electromyography (EMG) with visual analysis for sleep staging is considered the gold standard methodology for evaluating sleep indices. PSG is commonly used for the assessment and management of many sleep disorders; however, PSG can be costly and burdensome in terms of technician support for sensor application/removal, overnight monitoring (for in-lab PSG), and manual record scoring, in addition to being intrusive for the patient due to the necessity of wearing multiple sensors on the scalp and face throughout the night. These factors often make PSG impractical for some applications, especially those in which repeated measurements are necessary, and/or time or budgets are constrained. Minimally invasive techniques using accurate automated scoring of physiological data for sleep categorization and diagnostics may be a preferable alternative.
Automated scoring of EEG data is a more cost-effective option that removes subjectivity inherent in manual scoring by a technician,1 but despite greater attention being paid to the development and implementation of technology in recent years, considerable work remains to be done in terms of developing objective, valid, and reliable methods for computing sleep variables.2 Of the limited research that has been done on automated scoring algorithms, a few demonstrate promising results. A recent study by Malhotra et al3 evaluated an automated scoring system in which PSG data scored by a computer algorithm was compared against visual scoring by PSG technologists. The authors reported that their automatic system yielded results that were similar to those obtained by experienced technologists. However, their algorithm requires multiple channels of physiological data including EEG, chin EMG, and electrooculography.
In the past decade, single-channel EEG-based sleep staging algorithms have started to gain attention among researchers who have proposed a variety of potential scoring methods that are compared against visual scoring.4–8 Single-channel systems place fewer limitations on patient movement, and can be more convenient for use in the ambulatory environment than those systems employing multiple channels. Berthomier et al9 assessed the performance of their proprietary sleep scoring algorithm (automatic sleep EEG analysis) using EEG data (CZ–PZ) from 15 healthy individuals and compared the results to manual scoring. The authors evaluated the agreement with manual scorers, and reported results similar to those obtained with algorithms using multiple channels of data.
A wireless, single-channel EEG system using data from the FP1–FP2 channel for sleep staging was evaluated on 29 healthy adults and compared with visually scored data by two independent PSG technologists,10 and Griessenberger et al11 pointed out that this system has a specific weakness in detecting the wake state.
The performance of another single-channel system,12 also using data from the FP1–FP2 channel, was evaluated on 44 subjects, including those with normal sleep, and those with sleep-disordered breathing. Using majority agreement among PSG technologists, the authors describe the overall sleep staging performance, with similar results for detecting N2 (non-rapid eye movement stage 2) and Rapid Eye Movement (REM) sleep in a subsample population with mild to moderate obstructive sleep apnea.
While these examples of computerized scoring algorithms lend support to the notion that automated sleep staging from single-channel data may be a feasible alternative to the gold standard of multi-channel PSG with visual scoring, there are currently no commercial systems that are widely used for automated sleep stage determination.
We previously published the performance evaluation of an automatic single-channel sleep–wake detection algorithm, Z-ALG,13 which is currently used by the Zmachine®, a commercially available, FDA-cleared, single-channel (A1–A2) EEG-based sleep monitoring system intended for in-home use. The A1–A2 EEG channel is not typically used as a signal source for sleep staging. However, because A1–A2 is located completely outside of the hairline, it allows for easy patient self-application and removal of the sensors. Furthermore, A1–A2 is located away from the face making it comfortable and unobtrusive to wear during sleep, and eliminates the possibility of leaving noticeable marks on the face and forehead.13 To the best of our knowledge, this paper is the first to evaluate the performance of an algorithm that uses data from the A1–A2 EEG location for automated sleep staging.
Methods
Participants
The Mercy Medical Center Institutional Review Board (IRB) in Canton, OH, USA, approved all study procedures. As reported in our previous paper,13 overnight in-lab PSG was conducted with 106 paid volunteers at Consolidated Research, Inc. (CRI) in Cleveland, OH, USA, in 2003. Of those 106, a total of 99 records were used for our analyses: technical issues with the PSG recording system excluded four records, lack of technician adherence to protocol excluded two records, and one individual withdrew their participation.
Participants were screened for eligibility by research staff through structured telephone interviews and questionnaires. There were 52 females and 47 males, between the ages of 18 and 60 years (median age: 32.7 years), participating in the study. In order to increase ecological validity and generalizability of results from the study sample, exclusion criteria were minimal, allowing for the inclusion of individuals reporting both normal sleep, and those reporting symptoms consistent with various sleep disorders such as chronic insomnia, sleep apnea, and restless leg syndrome.
Applicants were categorized according to the American Society of Anesthesiologists (ASA)14 physical status classification system. Applicants with ASA physical status 1 (normal, healthy), 2 (mild systemic disease), and 3 (severe systemic disease) were eligible for inclusion; however, there were no participants meeting ASA physical status 3 in the study cohort.
Individuals were excluded for age less than 18 years, current pregnancy, and reporting skin sensitivity. Medications know to affect EEG morphology were exclusionary, except selective serotonin reuptake inhibitors (SSRIs) and serotonin–norepinephrine reuptake inhibitors (SNRIs) which were included in an attempt to determine their possible impact on algorithm accuracy.
As described in our previous paper,13 sleep disturbances were reported by 50 of the 99 study participants (50.5%), including:
- Thirty-five participants (35.4%) reported symptoms consistent with at least one variety of chronic insomnia (sleep onset, sleep maintenance, and waking too early) defined as >30-minute sleep onset latency (n=25, 25.3%), >30-minute Wake after Sleep Onset (n=13, 13.1%), or waking earlier than desired (n=12, 12.1%) with an inability to return to sleep occurring at least three times per week and persisting for at least 4 weeks. Of those 35 participants, 15 reported symptoms consistent with multiple types of chronic insomnia (ie, onset and maintenance, onset and early waking, or maintenance and early waking).
- Twenty-two participants (22.2%) reported strange leg sensations keeping them from falling asleep or staying asleep indicative of possible restless leg syndrome or periodic limb movements.
- Five participants (5.1%) responded positively to both snoring and nocturnal cessation of breathing/choking indicative of possible sleep apnea.
Laboratory PSG system and recordings
As described in Kaplan et al,13 participant data were acquired using a PSG system developed by CRI to acquire high-resolution (16-bit A/D conversion), wide bandwidth (0.5 Hz high-pass filter, 380 Hz low-pass filter, 2.5 kHz sampling frequency), and low noise signals (~4 μVpp input-referred noise floor, ±500 μV non-distorted input range). Acquired signals included: EMG, LOC, ROC, C3–A2, C4–A1, O1–A2, FP1–FP2, A1–A2, finger-probe pulse-oximetry, and time-stamped video/audio recording (EEG channels A1–A2 and FP1–FP2 were acquired and archived, but were not used for subsequent visual scoring). The EEG channel A1–A2 was the only data source used by Z-ALG and Z-PLUS.
Visual sleep scoring and epoch-by-epoch consensus
PSG data were visually scored in accordance with the sleep industry standard of Rechtschaffen and Kales15 that has also been used to evaluate many of the automated scoring systems previously described. Certified polysomnographic technologists conducted visual scoring of PSG data in 30-second epochs to identify the sleep stage (ie, Wake, 1, 2, 3, 4, REM, or unknown) and any arousals. A score of “unknown” was assigned when either the participant was disconnected from the PSG system, or the waveforms were ambiguous or unclear.
In order to allow for consensus scoring of each epoch, all PSG records were scored by two or more PSG technologists (three records were scored by two technologists, 16 records scored by three technologists, and 80 records scored by four technologists), with each of the five technologists (T1–T5) scoring the following number of records: T1 scored 97 records, T2 scored 38 records, T3 scored 98 records, T4 scored 42 records, and T5 scored 99 records. Each epoch was assigned a sleep stage based upon a majority agreement rule (PSG Consensus), and these data were used as the standard against which Z-PLUS was evaluated. If there was no consensus between technologists on a particular epoch, the epoch was not included.
Sleep staging algorithm (Z-PLUS)
The Z-PLUS algorithm evaluated in this paper further differentiates epochs identified as sleep by Z-ALG into Light Sleep, Deep Sleep, and REM as shown in Figure 1. The performance of Z-PLUS was evaluated against the same 99-subject data set as used to evaluate the wake–sleep detection performance of Z-ALG.13 Both Z-PLUS and Z-ALG use EEG data acquired from the contralateral area of the mastoid process located behind the ears, termed A1–A2, with a signal common (COM) located on the back of the neck or shoulder, as shown in Figure 2. A schematic representation of Z-PLUS is depicted in Figure 3. The Z-PLUS algorithm further processes any 30-second epoch of EEG data identified as sleep by Z-ALG13 to determine whether that epoch represents Light Sleep (stages 1 and 2), Deep Sleep (stages 3 and 4), or REM. Z-PLUS determines the sleep stage of an epoch using a hierarchical detection scheme with stage REM being detected first. If an epoch is not detected as REM, then it is passed to the Deep Sleep detector. If neither REM nor Deep Sleep is detected, the epoch is classified as Light Sleep.
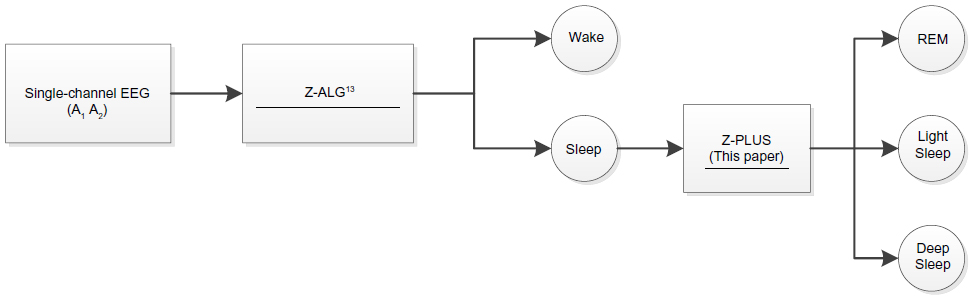 | Figure 1 The Z-PLUS algorithm further differentiates epochs identified as Sleep by Z-ALG into Light Sleep, Deep Sleep, and REM. |
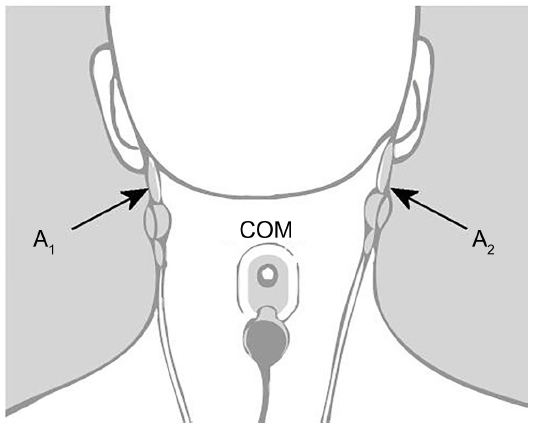 | Figure 2 Z-PLUS and Z-ALG both use EEG data acquired from A1 to A2 with a signal common (COM) located on the back of the neck or shoulder. |
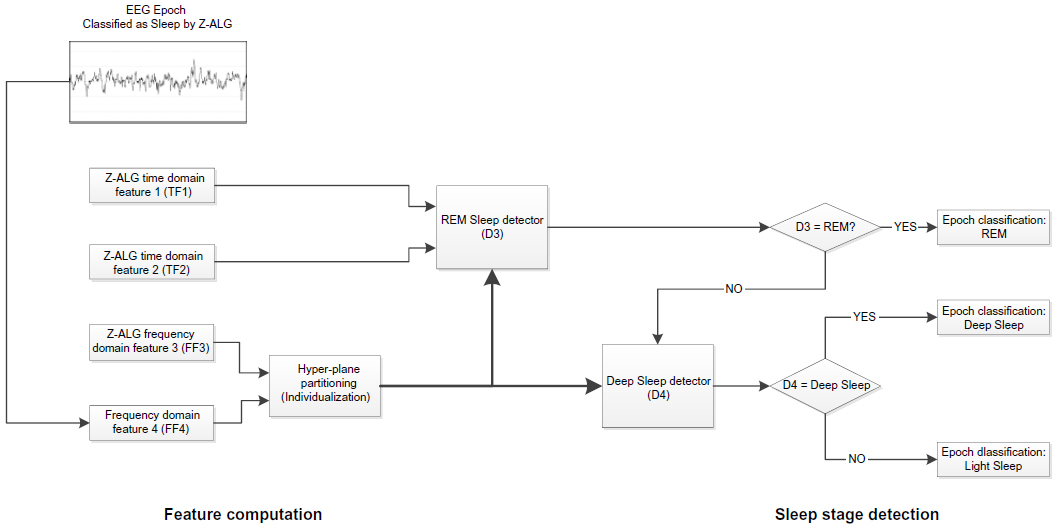 | Figure 3 Block diagram of Z-PLUS for sleep staging. |
In addition to time domain features TF1 and TF2, and frequency domain feature FF3, all of which were computed and used by Z-ALG, a new frequency domain feature FF4 that also falls within the conventionally defined delta (δ) band is computed and used by Z-PLUS. Z-PLUS computes two additional scale values used to separate REM and Deep Sleep. Like the scale values used by Z-ALG, these additional scale values are computed for each individual, based on their data alone, and therefore inherently accounts for EEG signal differences among individuals.
As depicted in Figure 3, the hierarchical detection scheme (detectors D3 and D4) is used first to determine REM, then Deep Sleep, and finally Light Sleep. To detect REM sleep, detector D3 uses the REM scale factor along with time and frequency domain features TF1, TF2, and FF4 to define a set of conditions that define REM sleep. If the feature data meet the REM sleep criteria, then the epoch is classified as REM sleep. If not, the epoch is next evaluated for Deep Sleep by detector D4 which uses the Deep Sleep scale factor and frequency domain feature FF3. If the feature data satisfy the Deep Sleep criteria, then the epoch is classified as Deep Sleep. Otherwise, the epoch is classified as Light Sleep. Following this sleep staging scheme, post-processing filters are used to further “adjust” the output by modifying the stage assignment of isolated REM or Deep Sleep epochs to Light Sleep.
Statistical analysis
In accordance with recommendations by Berthomier and Brandewinder,2 statistical measures of agreement, sensitivity, and positive predictive value (PPV) were calculated to assess the performance of Z-PLUS. Cohen’s kappa was used to quantify inter-rater reliability of the visual scoring by pairs of technologists for each study participant, and to evaluate the Z-PLUS versus the PSG Consensus. Cohen’s kappa statistic quantifies the agreement between two raters beyond what would be expected from chance alone for categorical data. Although there is no formally agreed upon standard, kappa scores are commonly segmented into ranges of values that are indicative of less than chance agreement (kappa <0), slight agreement (0≤ kappa <0.2), fair agreement (0.2≤; kappa <0.4), moderate agreement (0.4≤ kappa <0.6), substantial agreement (0.6≤ kappa <0.8), and almost perfect agreement (0.8≤ kappa <1).16
Sensitivity and PPV were calculated for the Z-PLUS sleep staging determination versus the PSG Consensus sleep staging assignments. When the PSG Consensus assigns an epoch to a particular stage of sleep, the sensitivity of that stage describes the probability that Z-PLUS will score that epoch correctly. Similarly, when Z-PLUS assigns an epoch to a particular stage of sleep, the PPV of that stage describes the probability that the PSG Consensus will agree.
Results
Comparison by sleep stage
To evaluate the accuracy of Z-PLUS, the PSG Consensus scores were combined to match the outputs of the Z-PLUS algorithm, such that PSG Consensus stages 1 and 2 were combined into Light Sleep, and stages 3 and 4 were combined into Deep Sleep. There are a total of 91,824 epochs (>765 hours) of recorded data for the 99 subjects. Of those epochs, 85,206 epochs (92.8%) had majority agreement among the PSG technologist scores. For the purposes of this analysis, the PSG Consensus is considered to represent the true sleep state and the standard by which Z-PLUS is compared.
Table 1 provides a summary comparison of the PSG Consensus versus Z-PLUS. The first column of Table 1 indicates that the PSG Consensus scored 16,908 epochs as Wake (column total). Of those epochs, the algorithm correctly classified 15,353 epochs, or 90.8%, as Wake. Z-PLUS misclassified 1,109 epochs (6.6%) as Light Sleep, zero epochs as Deep Sleep (0.0%), and 446 epochs (2.6%) as REM. A similar analysis was performed for Light Sleep, Deep Sleep and REM.
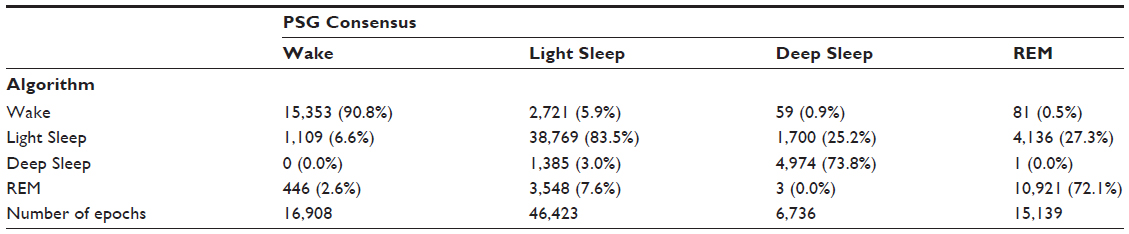 | Table 1 Comparison of PSG Consensus versus Z-PLUS algorithm for each sleep stage (Wake, Light Sleep, Deep Sleep, and REM) |
Sensitivity and PPV
The sensitivity and PPV of Z-PLUS as compared with the PSG Consensus are summarized in Table 2, and the sensitivity and PPV of Z-PLUS as compared with the individual PSG technologists are summarized in Table 3.
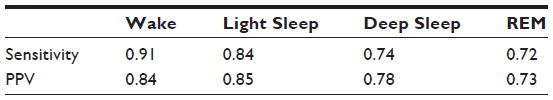 | Table 2 Sensitivity and PPV of Z-PLUS as compared with the PSG Consensus for Wake, Light Sleep, Deep Sleep, and REM |
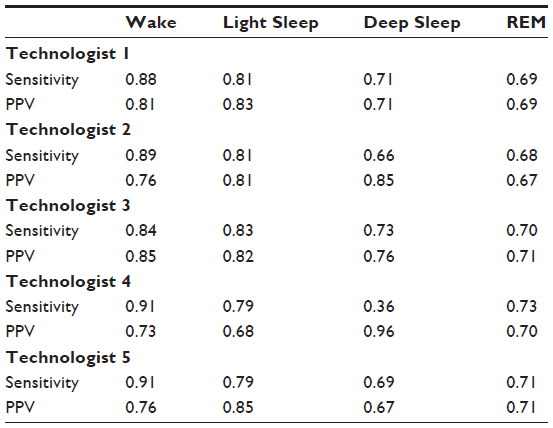 | Table 3 Sensitivity and PPV of Z-PLUS as compared with the individual PSG technologists for Wake, Light Sleep, Deep Sleep, and REM |
The sensitivity and PPV are higher for the PSG Consensus of Table 2 than for the individual PSG technologists of Table 3. For technologist 4 (T4), sensitivity of detecting Deep Sleep was especially poor (0.36); however, the PPV is very high (0.96). No other comparisons demonstrated this low level of sensitivity.
The sensitivity and PPV of Z-PLUS for each sleep sub-group (Normal, Insomnia, Apnea, PLM/RLS, and SSRI/SNRI) are summarized in Table 4. It should be noted that the number of subjects in both the Apnea and SSRI/SNRI subgroups are too small to draw viable conclusions. They are listed here for completeness.
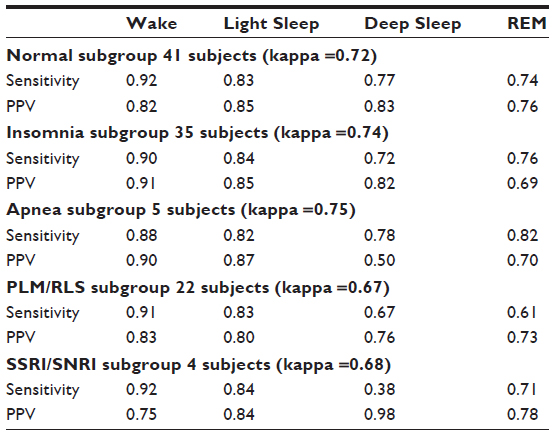 | Table 4 Sensitivity and PPV of Z-PLUS for each sleep sub-group (Normal, Insomnia, Apnea, PLM/RLS, and SSRI/SNRI) |
Cohen’s kappa analysis
Cohen’s kappa statistic provides a method for quantifying the agreement between Z-PLUS and the PSG Consensus, each of which classified 85,206 epochs of data into Wake, Light Sleep, Deep Sleep, and REM. The kappa value for the sleep staging comparison described in Table 1, across all 99 subjects, is 0.72, which indicates substantial agreement (0.6≤ kappa <0.8) according to the classification given in Viera and Garrett.16
The kappa scores among five PSG technologists (T1–T5) and Z-PLUS are shown in Table 5. Technologists T2 and T4 did not score any subjects in common, so the kappa value between them is listed as N/A. Kappa values among T1, T2, T3, and T5 are all above 0.8, which indicates almost perfect agreement (0.8≤ kappa <1). Kappa values between T4 and other technologists are in the range of 0.6–0.8 (substantial agreement). Kappa values between Z-PLUS and each technologist are in the range of 0.6–0.8 (substantial agreement), with the exception of 0.570 for T4 (moderate agreement).
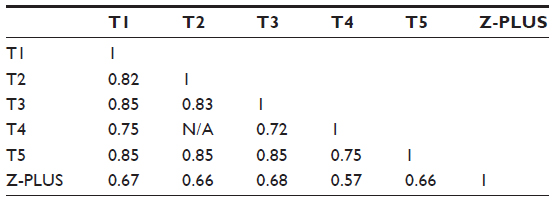 | Table 5 Kappa values among the PSG technologists and Z-PLUS |
Kappa was also calculated between Z-PLUS and individual technologists for each subject, and between the Z-PLUS and the PSG Consensus. The box plot of those kappa values is shown in Figure 4. The average kappa values are 0.65 between Z-PLUS and T1, 0.63 between Z-PLUS and T2, 0.66 between Z-PLUS and T3, 0.55 between Z-PLUS and T4, 0.64 between Z-PLUS and T5, and 0.70 between Z-PLUS and the PSG Consensus. Other than PSG technologist T4, all other kappa values are between 0.6 and 0.8, which indicates substantial agreement.
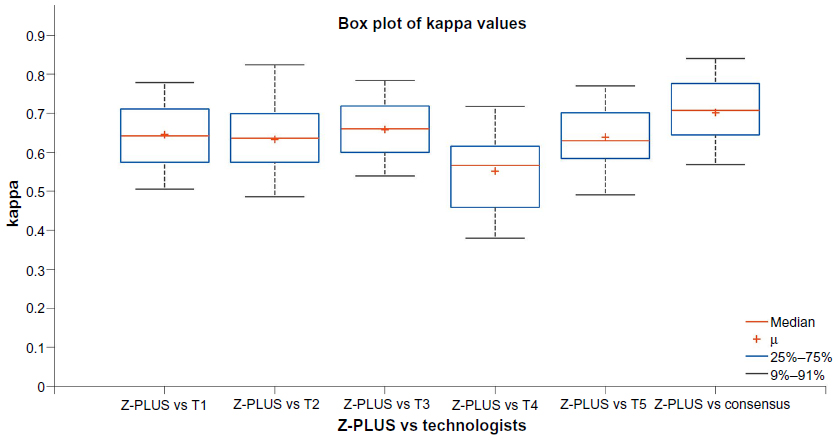 | Figure 4 Cohen’s kappa of Z-PLUS versus individual PSG technologists and PSG Consensus over 99 subjects. Each box shows the median and inter-quartile range. Whiskers show the upper and lower adjacent values. |
Bland–Altman plots
To further demonstrate the agreement between Z-PLUS and the PSG Consensus, Bland–Altman plots were used to compare sleep statistics for their ability to reveal systematic biases and highlight outliers present between two data sets. Bland–Altman plots displaying Total Sleep Time, Sleep Efficiency, Latency to Persistent Sleep, and Wake after Sleep Onset were provided in our previous publication.13 In this paper, Bland–Altman plots for Latency to Deep Sleep, Total Deep Sleep Time, Latency to REM, Total REM Time, and Total Light Sleep Time are given in Figures 5–9. Pearson’s correlation coefficients (r) were calculated between Z-PLUS and the PSG Consensus and for each plot the correlation coefficients range in value from 0.54 for Latency to Deep Sleep to 0.82 for Total Light Sleep.
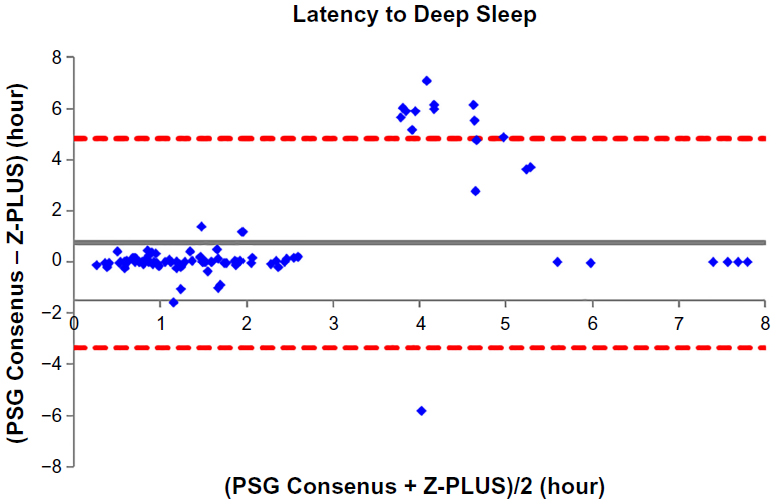 | Figure 5 Bland–Altman plot of Latency to Deep Sleep between Z-PLUS and the PSG Consensus. |
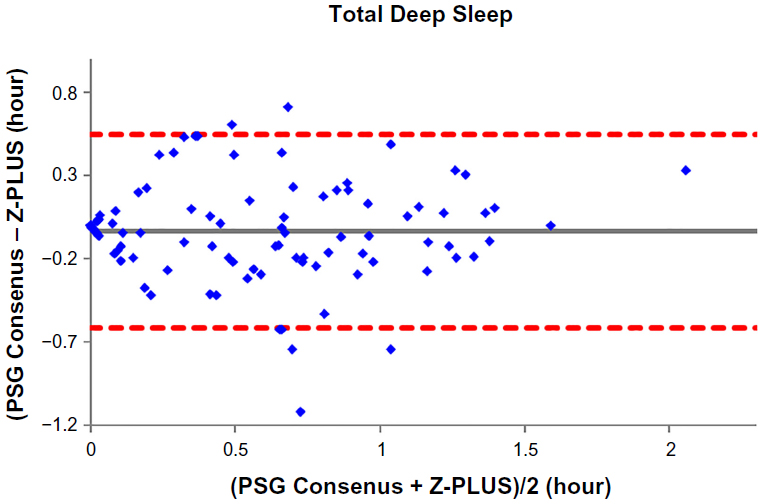 | Figure 6 Bland–Altman plot of Total Deep Sleep between Z-PLUS and the PSG Consensus. |
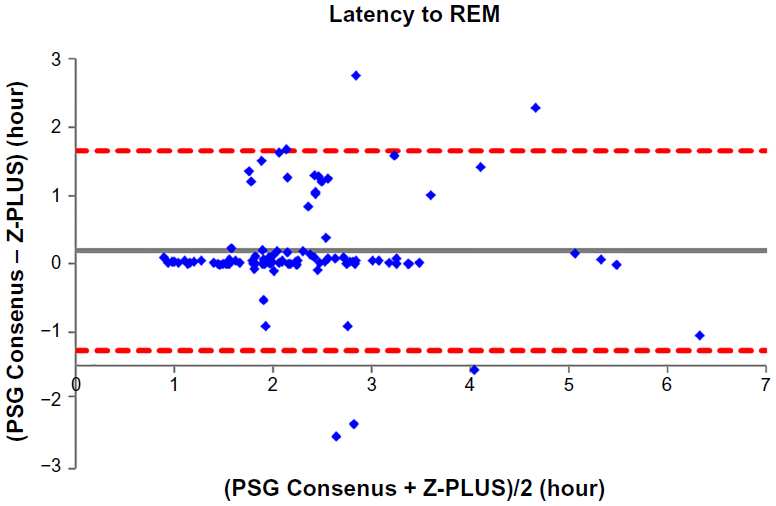 | Figure 7 Bland–Altman plot of Latency to REM between Z-PLUS and the PSG Consensus. |
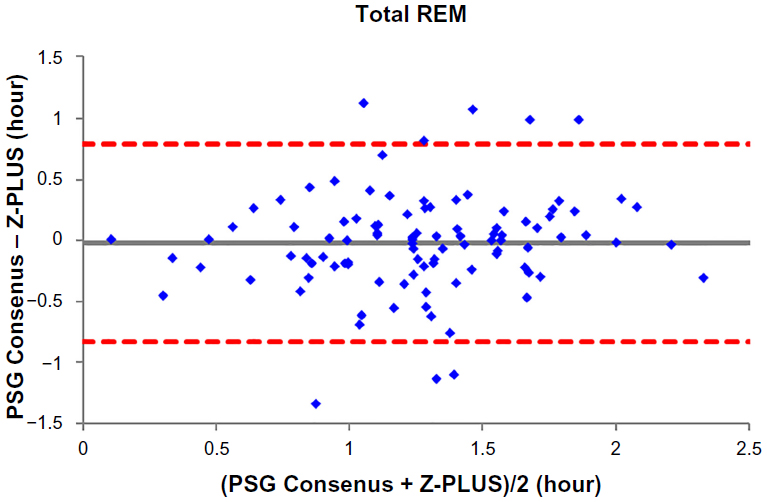 | Figure 8 Bland–Altman plot of Total REM between Z-PLUS and the PSG Consensus. |
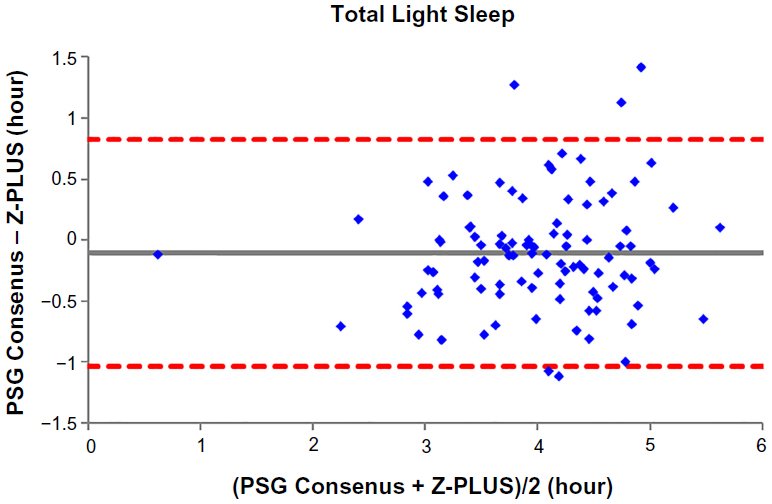 | Figure 9 Bland–Altman plot of Total Light Sleep between Z-PLUS and the PSG Consensus. |
Discussion
This study evaluated the performance of Z-PLUS as an automatic sleep staging algorithm that subdivides sleep (as determined by Z-ALG) into Light Sleep, Deep Sleep and REM, using an epoch-by-epoch comparison against manual scores by a consensus of PSG technologists (PSG Consensus). Unlike other automated scoring algorithms, Z-PLUS, similar to Z-ALG, uses a classification system that is based on individualized parameters for each participant versus population-based training methodologies.
The overall kappa agreement between Z-PLUS and the PSG Consensus for 99-subjects is 0.72, and according to Viera and Garrett16 this demonstrates substantial agreement. The sensitivity values between the PSG Consensus and Z-PLUS range from 0.72 for REM to 0.84 for Light Sleep, with PPVs ranging from 0.73 for REM to 0.85 for Light Sleep. In addition to sleep statistics that have already been shown in the previous paper,13 five additional sleep statistics are computed in this paper. Z-PLUS demonstrated good reliability and validity in the detection of Light Sleep, Deep Sleep, and REM not only for good sleepers but also for those reporting a variety of sleep complaints as well as those taking SSRI/SNRI antidepressant medications.
Our results are within the range previously observed in studies of automated sleep staging algorithms utilizing single-channel EEG data from a variety of EEG locations. Berthomier et al9 reported sensitivities from 0.83 for Wake to 0.86 for Deep Sleep, and PPV from 0.82 for Deep Sleep to 0.88 for Wake, and kappa of 0.75 for 15 healthy adults. Although Shambroom et al10 did not report these statistics for their study involving 29 healthy adults, we calculated sensitivities using the contingency table that was provided and obtained results that range from 0.63 for Wake to 0.87 for REM, and PPVs from 0.69 for Deep Sleep to 0.86 for Light Sleep, with their reported kappa value of 0.70. Stepnowsky et al12 evaluated 44 healthy and sleep disordered adults and using the contingency table provided in their manuscript, we calculated the average sensitivities to range from 0.74 for REM to 0.85 for Light Sleep, with average PPVs from 0.78 for REM to 0.83 to Wake. Unfortunately, the kappa value of their four-stage staging algorithm was not reported. Because different EEG channels, subject populations, and methods of analysis were used to evaluate each algorithm mentioned above, there is not sufficient uniformity to draw any concrete conclusions about the superiority of one technology over the other. To properly compare various algorithms, all algorithms must be evaluated using the same data and analyzed using a standardized methodology.
It is clear, however, that Z-PLUS has poor agreement with PSG technologist T4 (see Table 3). Such discrepancy between individual raters supports the use of consensus scoring from two or more technologists as the standard against which algorithms such as Z-PLUS should be compared. Sensitivity and PPV values are lower for the detection of Deep Sleep and REM than for the detection of Light Sleep (see Tables 2–4), which is consistent with the lower Pearson’s correlations for the five sleep statistics provided with the Bland–Altman plots in Figures 5–9 versus the four sleep statistics published in our previous paper.13 It might be the nature of the mastoid EEG channel A1–A2 that makes Deep Sleep and REM detection more difficult to detect from a signal processing perspective. However, the A1–A2 channel enables very comfortable use during sleep and is much less intrusive than other EEG locations, such as forehead or scalp EEG electrode locations. So far, to the best of our knowledge, Z-PLUS is the first algorithm to use A1–A2 for sleep staging and based on the preliminary results presented in this paper, additional research is needed to further investigate the characteristics of the A1–A2 EEG signal and to improve the accuracy of Z-PLUS.
A limitation of the present study is the classification of subgroups of sleep disorders according to self-reports rather than being clinically verified prior to inclusion in the study. Additionally, because subjects with particular symptom configurations or diagnoses were not specifically recruited, there are insufficient numbers of subjects in the sleep disorder subgroups to make any broad conclusions about the performance of Z-PLUS in such cases. However, the apnea and SSRI/SNRI subgroups do hint at somewhat degraded Z-PLUS performance especially in the detection of Deep Sleep. This may be the result of different characteristics of the EEG signal during Deep Sleep for these two subgroups versus other groups, where the performance of Z-PLUS for the insomnia and PLM/RLS subgroups was not negatively impacted. However, the study of larger sleep disordered populations using a variety of patient demographic types should be performed in the future to further understand the strengths and limitations of Z-PLUS, as well as to improve the performance of future versions of the algorithm. Despite these limitations, our data suggest that Z-PLUS is an accurate automated scoring algorithm for identifying sleep stages both in normal sleepers and in individuals with certain sleep disturbances.
Acknowledgment
The authors would like to thank the late Richard R. Bootzin, PhD, from the Department of Psychology at University of Arizona for his guidance and support throughout the development of this research.
Disclosure
The work was performed at, and supported by, General Sleep Corporation (a division of Consolidated Research, Inc., Euclid, OH, USA). Drs Wang and Kaplan are employed by General Sleep Corporation. Dr Loparo is affiliated with General Sleep Corporation, and Nord Professor of Engineering and Chair, Department of Electrical Engineering and Computer Science at Case Western Reserve University. Ms Kelly is a graduate student in the Department of Psychology at University of Arizona and a consultant regarding manuscript preparation to General Sleep Corporation.
References
Redline S, Dean D, Sanders M. Enter the era of “Big Data”: getting our metrics right. Sleep. 2013;36(4):465–469. | |
Berthomier C, Brandewinder M. Sleep scoring: man versus machine? Sleep Breath. 2013;17(2):461–462. | |
Malhotra A, Younes M, Kuna S, et al. Performance of an automated polysomnography scoring system versus computer-assisted manual scoring. Sleep. 2013;36(4):573–582. | |
Fraiwan L, Lweesy K, Khasawneh N, Wenz H, Dickhaus H. Automated sleep stage identification system based on time–frequency analysis of a single EEG channel and random forest classifier. Comput Methods Programs Biomed. 2012;108(1):10–19. | |
Koley B, Dey D. An ensemble system for automatic sleep stage classification using single channel EEG signal. Comput Biol Med. 2012;42(12):1186–1195. | |
Liang S, Kuo C, Hu Y, Pan Y, Wang Y. Automatic stage scoring of single-channel sleep EEG by using multiscale entropy and autoregressive models. IEEE Trans Instrum Meas. 2012;61(6):1649–1657. | |
Garcia-Molina G, Bellesi M, Pastoor S, et al. Online single EEG channel based automatic sleep staging. In Harris D, editors. Engineering Psychology and Cognitive Ergonomics. Applications and Services. Berlin Heidelberg: Springer; 2013:333–342. | |
Zhu G, Wen P. Analysis and classification of sleep stages based on difference visibility graphs from a single-channel EEG signal. IEEE J Biomed Health Inform. 2014;18(6):1813–1821. | |
Berthomier C, Drouot X, Herman-Stoïca M, et al. Automatic analysis of single-channel sleep EEG: Validation in healthy individuals. Sleep. 2007;30(11):1587–1595. | |
Shambroom J, Fabregas S, Johnstone J. Validation of an automated wireless system to monitor sleep in healthy adults. J Sleep Res. 2012;21(2):221–230. | |
Griessenberger H, Heib DPJ, Kunz AB, Hoedimoser K, Schabus M. Assessment of a wireless headband for automatic sleep scoring. Sleep Breath. 2013;17(2):747–752. | |
Stepnowsky C, Levendowski D, Popvic D, Ayappa I, Rapoport D. Scoring accuracy of automated sleep staging from a bipolar electroocular recording compared to manual scoring by multiple raters. Sleep Med. 2013;14(11):1199–1207. | |
Kaplan R, Wang Y, Loparo K, Kelly M, Bootzin R. Performance evaluation of an automated single channel sleep–wake detection algorithm. Nat Sci Sleep. 2014;6:113–122. | |
American Society of Anesthesiologists. ASA Physical Status Classification System; 2010. Available from: http://www.asahq.org/Home/For-Members/Clinical-Information/ASA-Physical-Status-Classification-System. Accessed January 8, 2015. | |
Rechtschaffen A, Kales A. A Manual of Standardized Terminology, Techniques and Scoring System for Sleep Stages of Human Subjects. Washington, DC: National Health Institute; 1968. | |
Viera A, Garrett J. Understanding interobserver agreement: the kappa statistic. Family Med. 2005;37(5):360–363. |
 © 2015 The Author(s). This work is published and licensed by Dove Medical Press Limited. The full terms of this license are available at https://www.dovepress.com/terms.php and incorporate the Creative Commons Attribution - Non Commercial (unported, v3.0) License.
By accessing the work you hereby accept the Terms. Non-commercial uses of the work are permitted without any further permission from Dove Medical Press Limited, provided the work is properly attributed. For permission for commercial use of this work, please see paragraphs 4.2 and 5 of our Terms.
© 2015 The Author(s). This work is published and licensed by Dove Medical Press Limited. The full terms of this license are available at https://www.dovepress.com/terms.php and incorporate the Creative Commons Attribution - Non Commercial (unported, v3.0) License.
By accessing the work you hereby accept the Terms. Non-commercial uses of the work are permitted without any further permission from Dove Medical Press Limited, provided the work is properly attributed. For permission for commercial use of this work, please see paragraphs 4.2 and 5 of our Terms.