")
Back to Journals » Journal of Pain Research » Volume 8
In silico ordinary differential equation/partial differential equation hemodialysis model estimates methadone removal during dialysis
Authors Linares O, Schiesser W, Fudin J , Pham T, Bettinger J, Mathew R, Daly A
Received 8 April 2015
Accepted for publication 14 May 2015
Published 22 July 2015 Volume 2015:8 Pages 417—429
DOI https://doi.org/10.2147/JPR.S84615
Checked for plagiarism Yes
Review by Single anonymous peer review
Peer reviewer comments 6
Editor who approved publication: Dr Richard Robinson
Video abstract presented by Jeffrey Fudin
Views: 612
Oscar A Linares,1 William E Schiesser,2 Jeffrey Fudin,3–6 Thien C Pham,6 Jeffrey J Bettinger,6 Roy O Mathew,6 Annemarie L Daly7
1Translational Genomic Medicine Lab, Plymouth Pharmacokinetic Modeling Study Group, Plymouth, MI, 2Department of Chemical and Biomolecular Engineering, Lehigh University, Bethlehem, PA, 3University of Connecticut School of Pharmacy, Storrs, CT, 4Western New England College of Pharmacy, Springfield, MA, 5Albany College of Pharmacy and Health Sciences, Albany, NY, 6Stratton VA Medical Center, Albany, NY, 7Grace Hospice of Ann Arbor, Ann Arbor, MI, USA
Background: There is a need to have a model to study methadone’s losses during hemodialysis to provide informed methadone dose recommendations for the practitioner.
Aim: To build a one-dimensional (1-D), hollow-fiber geometry, ordinary differential equation (ODE) and partial differential equation (PDE) countercurrent hemodialyzer model (ODE/PDE model).
Methodology: We conducted a cross-sectional study in silico that evaluated eleven hemodialysis patients. Patients received a ceiling dose of methadone hydrochloride 30 mg/day. Outcome measures included: the total amount of methadone removed during dialysis; methadone’s overall intradialytic mass transfer rate coefficient, km; and, methadone’s removal rate, jME. Each metric was measured at dialysate flow rates of 250 mL/min and 800 mL/min.
Results: The ODE/PDE model revealed a significant increase in the change of methadone’s mass transfer with increased dialysate flow rate, %Δ km=18.56, P=0.02, N=11. The total amount of methadone mass transferred across the dialyzer membrane with high dialysate flow rate significantly increased (0.042±0.016 versus 0.052±0.019 mg/kg, P=0.02, N=11). This was accompanied by a small significant increase in methadone’s mass transfer rate (0.113±0.002 versus 0.014±0.002 mg/kg/h, P=0.02, N=11). The ODE/PDE model accurately predicted methadone’s removal during dialysis. The absolute value of the prediction errors for methadone's extraction and throughput were less than 2%.
Conclusion: ODE/PDE modeling of methadone’s hemodialysis is a new approach to study methadone’s removal, in particular, and opioid removal, in general, in patients with end-stage renal disease on hemodialysis. ODE/PDE modeling accurately quantified the fundamental phenomena of methadone’s mass transfer during hemodialysis. This methodology may lead to development of optimally designed intradialytic opioid treatment protocols, and allow dynamic monitoring of outflow plasma opioid concentrations for model predictive control during dialysis in humans.
Keywords: methadone, hemodialysis, renal failure, modeling
Introduction
Methadone is a synthetic full opioid receptor mu-1 (OPRM1) agonist for oral dosing with affinity for the NMDA receptor.1 It is a Drug Enforcement Agency Schedule II controlled substance metabolized mostly by the Phase I hepatic CYP 3A4 system, and to a lesser extent, by CYP2D6, CYP2C8, CYP2C19, CYP2B6, and CYP1A2 to seven metabolites including two minor active metabolites: methadol and normethadol.2,3 Methadone consists of two enantiomers, the d- and l-isoforms, the former is responsible for analgesic activity. The l-isoform is dependent on 2B6 metabolism. Foreseeable accumulation of the l-isoform by poor 2B6 metabolizers consequently elevates risk for cardiotoxicty.4,5 Methadone and its metabolites are almost equally excreted in urine and feces.6 Notwithstanding, however, there is a 30-fold variability in the liver CYP3A4 and 11-fold in the intestinal CYP3A4 enzymes.7,8 But, in patients with anuria, methadone is metabolized by the gastrointestinal system9 and excreted only in the feces.10
Hemodialysis involves passing a patient’s blood through an extracorporeal circuit with a synthetic membrane attached. Plasma water and small molecular weight (MW) <500 Da solutes, including methadone hydrochloride (MW 345.91 Da), are readily removed from the blood by convective and diffusive forces and are lost as ultrafiltrate.11 However, hemodialysis causes little change in pre-dialysis compared with post-dialysis plasma methadone concentrations,12 which means that hemodialysis removes only a small portion of methadone from blood. This intuitively makes methadone an attractive opioid for the management of chronic pain in patients undergoing dialysis.13
Nonetheless, any methadone removed during dialysis may be important and require adjusting or supplementing a patient’s routine dose regimen when dosed three to four times daily for analgesia. Supplementing a patient’s methadone dose regimen would be particularly relevant for a hemodialysis patient undergoing treatment for substance abuse or pain management with methadone. Supplementation may be needed to prevent methadone levels from falling below their minimum effective concentrations,14 which could precipitate acute withdrawal, pain crisis, or both. No recommendations currently exist for methadone’s use in patients undergoing hemodialysis. No information is available to guide dosing. Therefore, there is a need to have a model to study methadone’s losses during hemodialysis to provide informed methadone dose recommendations for the practitioner.
We built a one-dimensional (1-D), hollow-fiber geometry, ordinary differential equation (ODE) and partial differential equation (PDE) countercurrent hemodialyzer model (ODE/PDE model). The ODE/PDE model mimicked methadone’s disposition during hemodialysis. We used this ODE/PDE model to measure methadone’s intradialytic mass transfer and removal rate. To determine whether the model could detect an expected increase in methadone’s removal with increased dialysate flow, we measured methadone’s removal at dialysate flow rates of 250 mL/min and 800 mL/min. The ODE/PDE model allowed us to implement a clinical strategy for estimating a patient’s post-hemodialysis methadone restoration dose.
Methods
Subjects and protocol
To develop the model, we used the data from the published experiments by Perlman et al.12 The data were digitally extracted from their publication using high-resolution image processing with GIMP version 2.8 (http://www.gimp.org/), and measured using UN-SCAN-IT version 6.0 software (Silk Scientific, Orem, UT, USA). A similar approach has been successfully used to study the dynamic relationship between glucose, insulin and non-esterified fatty acids.15,16
We studied eleven patients (see Table 1). Patients received a ceiling dose of methadone hydrochloride (hereafter methadone) in divided doses totaling 30 mg/day for patients receiving other than once daily dosing for analgesic purposes. Specific details including dose escalation of opioid-naïve patients to reach the ceiling dose are provided by Perlman et al.12 This research was conducted according to ethical principles in the World Medical Association Declaration of Helsinki (59th WMA General Assembly, Seoul, October 2008), which includes research on published human data. The study was approved by the Emerio & Lourdes Linares Research and Education Center Institutional Review Board.
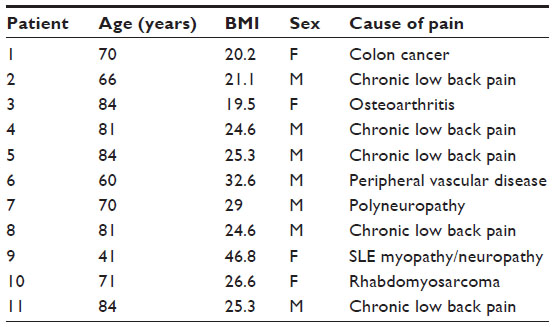 | Table 1 Patient demographics |
Dialyzer model development
Hemodialysis experiments to test the model were performed in silico. On the one hand, we compared methadone’s mass transfer to that of a perfect reference standard. On the other hand, we compared methadone’s mass transfer at dialysate flow rates we defined as low, equal to 250 mL/min, and high, equal to 800 mL/min. For each patient, hemodialysis blood flow rates were held constant at 250 mL/min. We sought to identify a potential dependence of methadone’s removal on dialysate flow rate. If the model could detect such a dependence, it would serve as a test of the model’s sensitivity to detect a mechanism-based change.
We implemented the ODE/PDE model illustrated in Figure 1. Dialyzer geometry refers to the cross-sectional area in contact with the blood, semipermeable membrane, and dialysate. Table 2 presents a glossary of symbols and units.
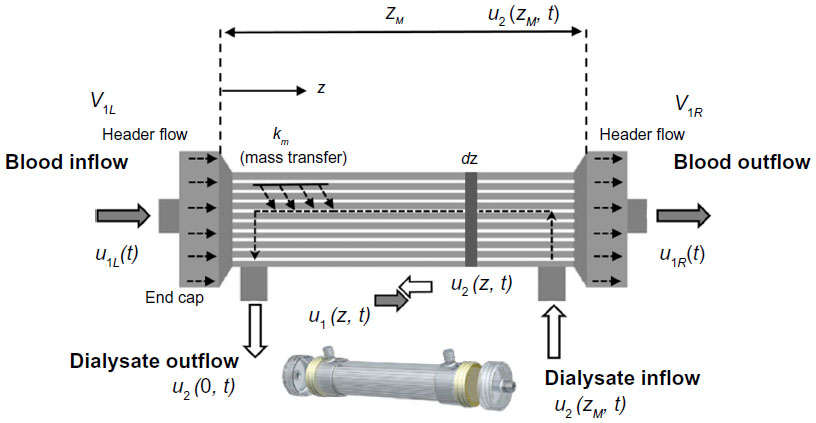 | Figure 1 ODE/PDE model of one-dimensional (1-D) counter current hemodialyzer with distance z of the spatial boundary independent variable along the dialyzer. |
 | Table 2 Glossary of symbols and units |
Closely following Schiesser,17 as shown in Figure 1, the ODE/PDE model is 1-D with distance z the spatial boundary independent variable along the dialyzer. Time t is the temporal initial value independent variable. The two PDE dependent variables, u1(z, t) and u2(z, t), represent normalized methadone concentrations in the blood and dialysate, respectively, and z stands for the length of the dialyzer excluding the headers. The independent time variable is t in minutes. The derivation of the ODE/PDE model equations are presented in the Supplementary material.
Figure 1 also shows blood enters the left end of the dialyzer at a methadone blood concentration of u1L(t). This boundary condition is not defined as u1(z = 0, t) due to the header flow volume at the left end, V1L. Similarly, the exiting methadone blood concentration at the right end is u1R(t) rather than u1(z = Zm, t) because of the header flow volume there also, V1R. Zm stands for the length of the dialyzer membrane excluding the headers. The entering and exiting dialysate concentrations are u2(z = Zm, t) and u2(z = 0, t).
The header is the space enclosed by the end cap of the dialyzer and the polyurethane potting material that holds the hollow fibers together (inset Figure 1). The header forms a barrier between the blood and dialysate compartments. Headers channel blood from the dialyzer inlet into the membrane fibers, and from the membrane fibers into the dialyzer outlet. The end caps can be removed from some dialyzers (inset Figure 1). The headers can be assumed to be well mixed and therefore modeled with ODEs. The dialyzer membrane passage is distributed in space and time so we use PDEs. Thus, ODE/PDE model results which are easily handled with the method of lines (MOL).18 Note, the headers serve as low-pass filters in the sense that they smooth abrupt changes such as step changes at the inlet.
Our objective in formulating our experiments with the model and computing numerical solutions with it was to dete- rmine u1(z, t) and u2(z, t), and in particular, how methadone’s mass transfer reduced the outflow methadone concentration, u1R(t), below its inflow value, u1L(t). This approach allowed us to perform a methadone mass balance on the blood and thereby estimate methadone’s mass transfer coefficient, km (see Supplementary material).
Our objective was not to examine the efficiency of a particular commercially available dialyzer to remove methadone from blood. Therefore, we set the ODE/PDE model parameters to arbitrary, though realistic values, comparable to those of commercially available dialyzers19,20 as follows: D: dialyzer diameter 5 cm; A: dialyzer cross-sectional area equal to π×D2cm2 (used in Equations S1 and S2 [see Supplementary materials]); AM: dialyzer mass transfer area per unit length of dialyzer cm2/cm (used in Equations S2 and S3). We set AM = A; q1, q2: volumetric flow rate of blood equal to 0.25×10³ and dialysate equal to 0.25×103 cm3/min, respectively; ξ fraction of A available for blood flow, 0 ≤ ξ ≤ 1, dimensionless. Hence, 1–ξ is the fraction of A available for dialysate flow; v1, v2: linear flow velocities for blood, equal to q1/ξ×A, and dialysate, equal to −q2/([1 – ξ]×A), respectively, cm3/min (used in Equations S2 and S3). Note, for countercurrent flow, v1>0 and v2<0, which maximizes methadone’s convective and diffusive mass transfer; u1L normalized inflow blood methadone concentration equals 1, as z=0, dimensionless; V1L, V2R header volumes for u1 at z=0, Zm, are cm3. The length of these header volumes is 1 cm (V1L = 1×A). However, these values cannot be zero because of the division by the volume in the numerical integration of the ODEs in Equations S5 and S6; u10, u20: initial conditions (ICs) for Equations S2 and S5 equal zero, respectively, and dimensionless (in Equation S4: u1(z, t = 0) = f1(z) = u10 and u2(z, t = 0) = f2(z) = u20, respectively); ZM: dialyzer length equal to 50 cm; n: number of grid points in z equal to 51.
Methadone’s mass transfer coefficient from blood into dialysate, km, was estimated by solving the coefficients in Equations S1 and S2. Detailed MATLAB (matrix laboratory) code for estimating methadone’s km using the MOL to solve the ODE/PDE model is provided in Schiesser’s work.17
Hemodialysis experiments
In brief, Perlman et al12 improved methadone pain control in their patients over a 2-week period. After this 2-week period, blood samples were drawn during the patients’ first scheduled dialysis session. The first sample was drawn immediately before starting dialysis and the last sample was drawn immediately after the 4-hour dialysis session. Patients were instructed to take their last dose of methadone 6 hours before starting dialysis to make sure that plasma methadone concentrations were measured during the elimination phase. This may be a limitation for maintenance therapy patients as they receive their dose early in the day. However, this schedule enables accurate assessment of methadone’s elimination with minimal influence from absorption or redistribution.21 Patients did not receive extra or breakthrough doses of methadone during dialysis. Acetaminophen was used to treat pain during dialysis.
Perlman et al12 measured methadone serum concentrations using liquid chromatography tandem mass spectrometry.22 In non-dialysis patients, plasma methadone levels increased linearly by 260 ng/mL for every 1 mg/kg of methadone ingested.23 The coefficient of variation and accuracy for all standards were within the acceptable range of 20% of the lower limit of detection and 15% of other standards and quality control samples. Linearity was achieved in the analytical ranges of 0.5 to 300 ng/mL. For all calculations and ODE/PDE modeling, the published methadone concentration for an individual time point for the first and second dialysis sessions were combined and averaged. Methadone’s intradialytic extraction ratio was calculated from the simultaneously sampled arterial (inflow) and venous (outflow) plasma methadone concentrations by dividing their difference by the arterial plasma methadone concentration (see results, Table 3). Full details of the experimental protocol and procedures utilized by Perlman et al have been previously described in detail.12
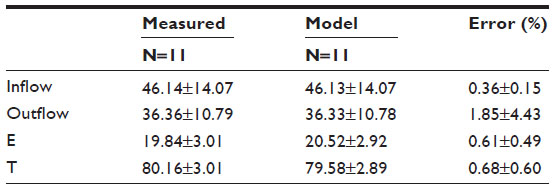 | Table 3 Experimentally measured plasma methadone concentrations versus ODE/PDE model predictionsa,b |
Statistics
Statistical analyses were performed using R version 3.1.3 (R Foundation for Statistical Computing, Vienna, Austria). Solution of the ODE/PDE model was performed using MATLAB MOL codes20 translated into R.24,25 A sample size of eleven was calculated to be the smallest n that would achieve a power of 90% to detect a 2% difference with α=5% between the measured and ODE/PDE model predicted values.26 All values are mean ± standard deviation unless otherwise indicated. Values in brackets are 95% confidence intervals (95% CIs). Mathematical computations with error propagation were performed using Mathematica 10.1 (Wolfram Research, Champaign, IL, USA). A significant difference or relationship was established when the probability of rejecting the null hypothesis was ≤0.05.
Results
For each patient, Figure 2 shows the plots for the case where no methadone mass transfer into the dialysate occurred, ie, km=0. This simulation is used for reference. The two solutions, u1R(t) and u2(z = 0, t), are close. Both have the same inflow values: u1L=u2zM=1. However, the solutions are not exactly the same because of the blood flow at the inflow and outflow headers (Figure 1). As expected, the responses of the normalized plasma methadone concentrations with headers (black curves), u1(z, t), are slightly delayed compared to those for the dialyzer with no headers (gray curves). Both solutions approach 1 with increasing t as expected because when there is no mass transfer (km=0), the entire unit inflow plasma methadone concentrations move through the system and exit.
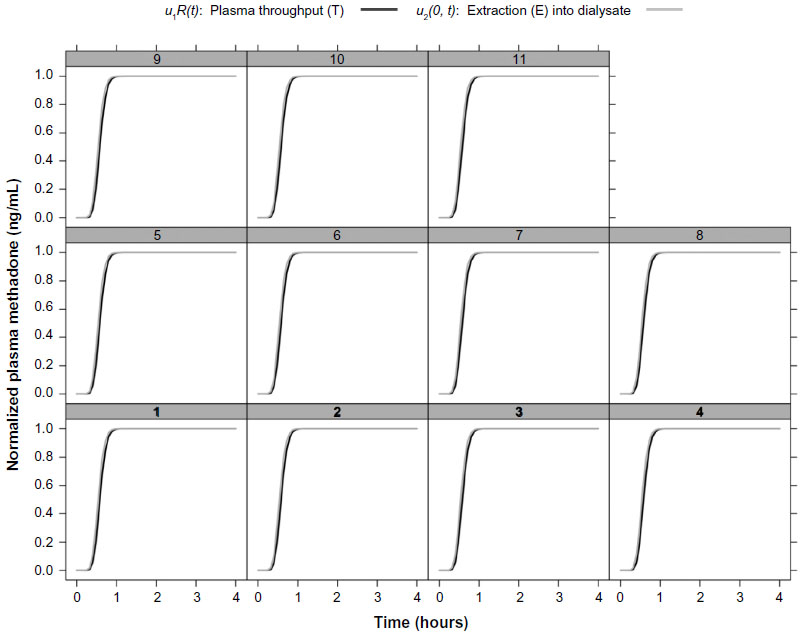 | Figure 2 One-dimensional (1-D) ODE/PDE model’s perfect reference standard response with zero mass transfer of methadone into dialysate. |
Both solutions in Figure 2, u1R(t) and u2(z = 0, t), reflect a traveling wave27 that results from the PDE’s ICs u10=u20=0. The inflow unit methadone concentrations travel through the dialyzer and eventually reach the outflow, at which time both solutions move from the zero ICs to the unit boundary conditions. The step is not instantaneous because of the so-called numerical diffusion (which is not physically realistic) from the two point upwinding of the derivatives in z of Equations S2 and S3. However, we largely eliminated numerical diffusion by using flux limiters.
The arrival time of methadone molecules at the outflow (right end, z = Zm) for u1 can be estimated as Zm/v1 = 50 cm ÷ 0.025 cm/s = 2,000 s = 0.56 hour. Similarly, for u2, since v2 = −v1 the arrival time at the left end (z=0) is also approximately 0.56 h. These arrival times may not be exact due to some numerical diffusion and the delay in methadone’s u1 response due to the two headers. Notice, while the time for convection through the dialyzer may be of the order of minutes, the time to reach equilibrium or steady state can be considerably longer because of the interaction of the blood and dialysate streams through the membrane mass transport.
Table 3 presents results of the experimentally measured versus the ODE/PDE model predicted plasma methadone inflow and outflow concentrations, and their extraction (E) and throughput (T), by and through the dialyzer, respectively. Table 3 shows that the ODE/PDE model accurately predicted methadone’s experimentally measured values. There were no significant differences between methadone’s experimentally measured values and the ODE/PDE model predictions (all P>0.05). In addition, the absolute value of the prediction errors for methadone’s intradialytic E and T were less than 2%.
Figure 3 shows the case where each patient’s methadone km was estimated with the ODE/PDE model using the measured experimental data presented in Table 3. Blood and dialysate flow rates were set equal to 250 mL/min. Methadone’s km was equal to 3.64×10⁻³±2.16×10⁻⁵ cm/min. Compared to the solutions in Figure 2, the two solutions in Figure 3, u1R(t) and u2(z = 0, t), are not so close. Although both solutions have the same normalized inflow values:, their normalized outflow values were significantly different. At t = 4 h, u1R(t) = 0.824±0.013 with a 95% CI (0.723, 0.922), and u2(z = 0, t) = 0.175±0.013 with a 95% CI (0.076, 0.274), P < 0.05. Methadone’s maximum extraction during dialysis occurred at 1.82±0.30 h with a 95% CI (1.56, 2.08). Thereafter, its extraction did not significantly increase.
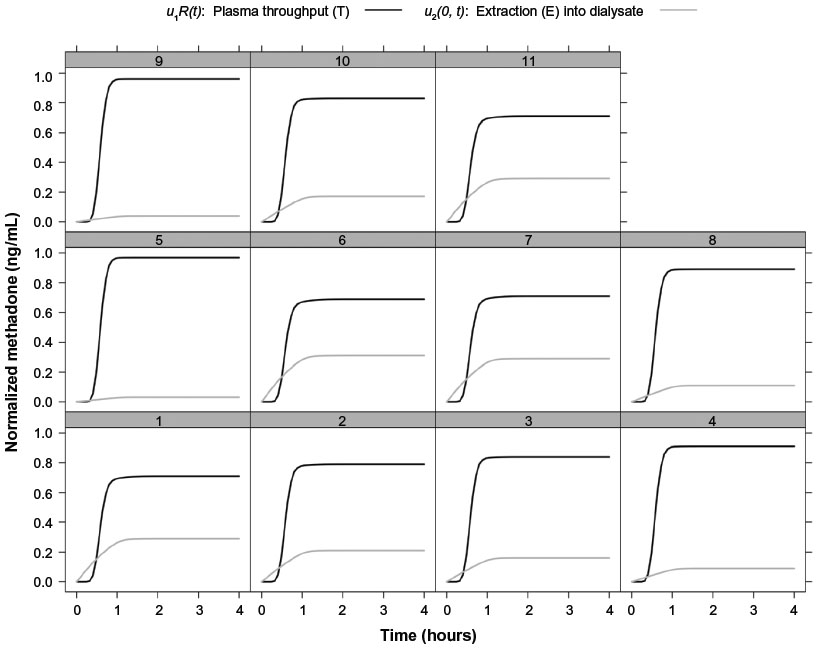 | Figure 3 One-dimensional (1-D) ODE/PDE model’s response with estimated mass transfers of methadone into dialysate. |
For each patient in Figure 3, methadone’s u1 response to u1L arrives at the right end (z = Zm) at approximately 0.56 h, as in Figure 2. But due to methadone’s mass transfer into the dialysate, the response is reduced so that the exiting u1 concentration, u1R(t), reaches 0.824±0.013 at t = 4 h. As shown in Figure 3, just after t=0, methadone’s u2 responses (gray curves) were immediate because the outflowing dialysate “sees” the unit inflowing plasma methadone concentration at z=0. Notice also that the inflow methadone concentration into the dialysate, u2(z = Zm, t), is ; so the outflow u2 at z=0 is determined entirely by the plasma methadone concentration on the blood side of the membrane. At t = 4 h, this outflowing normalized plasma methadone concentration, u2(z = Zm, t), reaches 0.175±0.013.
For each patient, Figure 4 shows the plot of normalized methadone’s removal via dialysate at low dialysate flow rates of 250 mL/min and high dialysate flow rates of 800 mL/min. The model revealed a significant increase in the change of methadone’s mass transfer associated with the increase in dialysate flow rate, %Δ km=18.56, P=0.02, N=11. The total amount of methadone mass transferred across the dialyzer membrane with high dialysate flow rate significantly increased (0.042±0.016 versus 0.052±0.019 mg/kg, P=0.02, N=11). This was accompanied by a significant but small increase in methadone’s mass transfer rate (0.113±0.002 versus 0.014±0.002 mg/kg/h, P=0.02, N=11).
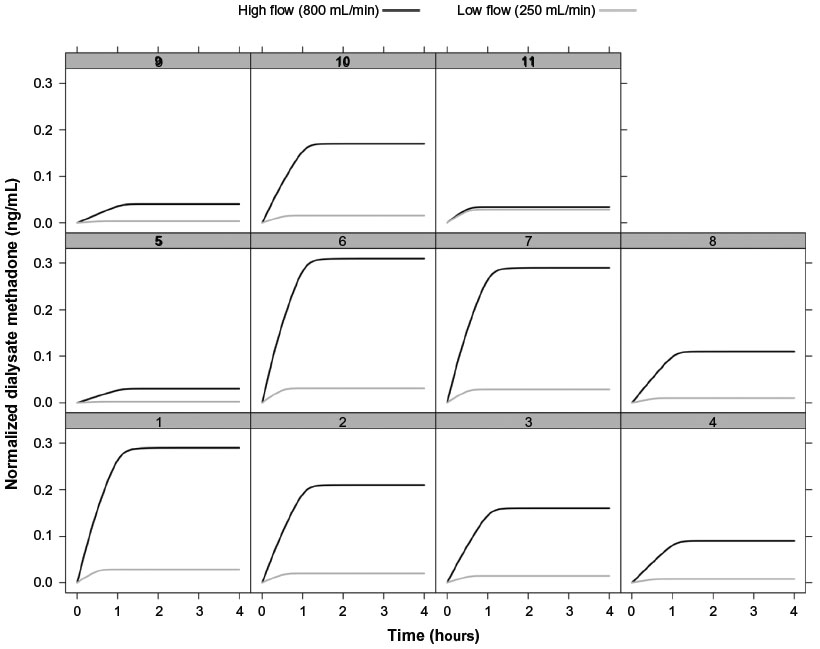 | Figure 4 One-dimensional (1-D) ODE/PDE model’s normalized methadone’s response to its removal via the dialysate at low dialysate flow rates of 250 mL/min and high dialysate flow rates of 800 mL/min. |
Discussion
Our results show the ODE/PDE model (Figure 1) accurately predicted methadone’s inflow and outflow plasma concentrations as well as its E and T during dialysis. Results using the ODE/PDE model also showed methadone’s removal was decreased at low dialysate flow rates compared to its removal at high dialysate flow rates. The ODE/PDE model suggested that methadone’s reduced intradialytic removal was caused by a reduction in its mass transfer across the hemodialyzer membrane in a dialysate flow rate-dependent manner. This result was consistent with previous results that show increasing dialysate flow rate can give rise to an increase in mass transfer of low MW substances across dialyzer membranes,28,29 and that increasing dialysate flow rate may increase the mass transfer of a highly protein-bound substance.30,31
While it is possible to qualitatively predict methadone’s extent of removal during dialysis, our study aimed to advance a quantitative measure of methadone’s removal. It is known that a few basic physicochemical properties of a drug govern the extent to which it is dialyzed: 1) MW, 2) apparent volume of distribution, 3) protein binding, 4) hydrophilicity, and 5) lipophilicity.32 Molecules with low MW (<500 Da) are easily dialyzed, while higher MW compounds (>1,000–2,000 Da) are not. In general, drugs with an apparent volume of distribution greater than 1 L/kg are poorly dialyzed. Drugs with high protein binding, low water solubility, or that have high lipophilicity are also poorly dialyzed.32
Methadone has a low MW equal to 345.91 Da. It also has a high apparent volume of distribution with reported values in opioid addicts estimated as 4.1±0.65 L/kg in one study33 and 2.1–5.61 L/kg in another.34 Bootstrap population statistics give an apparent volume of distribution for methadone of 5.5±0.89 L/kg.35 Methadone is highly bound to plasma proteins, particularly AAG.36 Its plasma protein binding has been reported to be 60%–90%.37 It is highly hydrophobic with a log 1-octanol:water partition coefficient (log Po/w) of 4.762 at pH=7.4;38 morphine’s log Po/w =−0.10, oxycodone’s log Po/w =0.70, and codeine’s log Po/w =0.60.39 Log Po/w >0 characterizes hydrophobic substances soluble in the lipid phase, while log Po/w <0 typifies polar compounds soluble in the water phase.40 Methadone is highly lipophilic as explained by its high log Po/w. Only the first property (small MW) supports that methadone is easily dialyzable. The other four properties indicate its removal by hemodialysis is reduced.
Our results showed that during low dialysate flow rates equal to the hemodialyzer’s blood flow rates, low concentrations of methadone appeared in each patient’s dialysate, compared to those during high dialysate flow rates. This finding objectively indicates methadone’s dialyzability is low. Methadone clearance and extraction ratios have also been previously observed to be low in other studies.12,41 But, the ODE/PDE model extends the concepts by providing quantitative measures of methadone’s extent of dialyzability, including its mass transfer coefficient, km. Methadone’s km allows quantitative estimation of the amount of methadone removed during hemodialysis.
If the objective is to determine the amount of methadone removed by dialysis, eg, to control dose replacement, estimation of km and the amount of methadone removed by dialysis may provide a better index for methadone dose replacement than dialysis clearance. Dialysis clearance has been found to correlate poorly with the fraction of drug in the body removed by hemodialysis.42 Moreover, a drug’s dialyzability cannot be predicted reliably from its MW, volume of distribution, or plasma protein binding.43
Clinical application
The ODE/PDE model results can be applied as follows. Using a low dialysate flow rate of 250 mL/min, methadone’s estimated removal during dialysis is jME = 0.013±0.002 mg/kg/h, for a 70±0.001 kg patient. Then, methadone’s removal rate with error during dialysis can be estimated as jME×70±0.001 kg = 0.90±0.14 mg/h (95% CI: 0.67, 1.18). Thus, over the 4 h period of a dialysis session it is estimated that about 3.6±0.56 mg (95% CI: 2.5, 4.7) of methadone will be removed by hemodialysis in a 70 kg patient. The value of 3.01 mg calculated from the mass balance of measured values from Perlman et al12 falls within that 95% CI.
The range of methadone concentrations from 100 ng/mL44 to 400 ng/mL45 are presumed to provide effective methadone maintenance. Yet other studies consider that effective maintenance depends on keeping serum methadone levels above 150–200 ng/mL during the 24 h interval between methadone doses.46–48 In contrast, for pain treatment, methadone serum concentrations in opioid naïve patients range from 10 ng/mL to 80 ng/mL with a minimum lethal level of 670 ng/mL.49,50 Notice that the ODE/PDE model’s estimate of amount of methadone removed by dialysis translates into a plasma methadone concentration of about 11.96 ng/mL; since, concentration = amount/volume of distribution (Vd = 4.3 L/kg×70 kg = 301 L). Hence, while a plasma methadone concentration change of about 11.96 ng/mL seems modest, it may be sufficient to cause a lack of a sense of well-being in maintenance and chronic pain patients undergoing dialysis.51 Especially, if levels fall 11.96 ng/mL below their minimum effective concentrations.
The aim of our study was not to examine the performance of a particular commercially available hemodialyzer or dialyzer membrane to remove methadone from blood. Therefore, we set the ODE/PDE model parameters to arbitrary, though realistic, values comparable to those of commercially available dialyzers.19,20 Accordingly, interpretation of our results should be tempered with the understanding that they do not generalize to membranes with different characteristics, and hemodialysis prescriptions with different blood and dialysate flow rates. Nevertheless, given a specific membrane’s characteristics, and a particular patient’s hemodialysis prescription, initializing the ODE/PDE model with those parameter values is straightforward and will provide accurate results with little error comparable to those obtained in our study.
Drug to dialyzer–membrane binding has been demonstrated during continuous hemofiltration in the absence of protein.52 The ODE/PDE model does not account for the possibility that methadone might bind to a dialyzer’s membrane. Still, there is currently no factual evidence or anticipation that methadone does or should bind to dialyzer membranes. In addition, methadone is a neutral molecule with a formal charge of zero,53 and thus is not expected to undergo cation exchange reactions with the dialyzer membrane.
Dialyzer reuse may cause a decrease in methadone’s mass transfer due to a reduced number of dialyzer fiber bundles with associated loss of surface area. A reduction in the number of fiber bundles can either alter the membrane’s diffusive properties or lead to a loss of hydraulic permeability32 both of which could lead to a decline in methadone’s mass transfer across the membrane. Although observations recorded during continuous hemodialysis indicate this decline is predictable, the role of membrane deposition of protein with reuse on the mass transfer across dialyzer membranes of low MW drugs, including methadone, is presently unknown.
It is known that some highly bound protein substances may be dialyzable when subjected to high dialysate flow rates.28 We used this fact to test the model’s ability to possibly detect an increase in methadone’s dialyzability with increased dialysate flow. The ODE/PDE model predicted that methadone’s dialyzability increases with high dialysate flow rates. Moreover, the model provided a quantitative estimate of methadone’s removal during high dialysate flow.
We assumed methadone distributes in the whole blood compartment, while in reality the hematocrit fraction of dialyzer blood flow is not accessible to protein bound solutes like methadone. This means that to completely account for the hematocrit effect, the fraction of red cell volume available for dialysis (γ) must be taken into account. This value is not known for methadone. For urea, it is 1.11. It is not 1 due to a reversibly bound pool of urea within red blood cells.54 For creatinine γ is 0.50 and for phosphorus it is 0. Nevertheless, although γ is not known for methadone, it can be estimated as follows. The equation relating hematocrit to dialyzer blood flow is given by Sargent and Gotch:55

where QB is whole blood flow into the dialyzer, QBw is blood water flow, HCT is the fractional red cell volume of whole blood (hematocrit: 45% men, 40% women), 0.93 is the water fraction of plasma, and 0.72 is the effective water fraction of the red cell. γ accounts for the hematocrit effect. Solving Equation 1 for γ gives:

for both men and women. Hence, methadone’s hematocrit fraction of dialyzer blood flow is about 29%. In this sense, our results may represent predictable underestimates.
The Peclet number, Pe = (v1×Zm)/D = 347046.2 for our model. Thus Pe >>100, which indicates we can neglect diffusion relative to convection because the system is strongly hyperbolic (convective). D denotes methadone’s diffusivity equal to 3.67×10⁻⁶ cm2/s using the Stokes–Einstein equation with a plasma viscosity of 1.2 centipoise, where 1 centipoise = 0.01 g/cm/s.56
Finally, our experiments were not designed to detect the possibility that methadone could exhibit post-hemodialysis rebound resulting from equilibration between blood plasma and its tissue reservoir.57 This could lead to a 10%–25% post-hemodialysis rebound of drug due to equilibration.32 Therefore, sustained spillover of methadone into plasma from its tissue reservoir could (at least theoretically) cause a delayed toxic methadone concentration, particularly in acute poisoning. However, further studies are needed to determine the potential impact the interaction between inter-compartmental methadone equilibration and methadone spillover into plasma from tissue reservoirs could have on post-hemodialysis methadone concentrations. One approach would be to investigate inclusion of ODEs to model the delayed release and spillover.
Acknowledgment
This research received no specific grant from any funding agency in the public, commercial, or not-for-profit sectors.
Disclosure
J Fudin is an expert legal advisor and on the speakers’ bureau for Millennium Laboratories, Inc. He is on speakers’ bureaus for Kaléo Pharma and Astra Zeneca. He is a consultant to Zogenix, Astra Zeneca, Millennium Health LLC, and to Practical Pain Management in the development of the online Opioid Calculator. He is founder and owner of Remitigate LLC. J Fudin’s participation does not reflect the opinion of employers, employee affiliates, and/or pharmaceutical companies listed. This article is the sole work of the authors and stated opinions/assertions do not reflect the opinion of employers, employee affiliates, and/or pharmaceutical companies listed. It was not prepared as part of J Fudin, TC Pham, RO Mathew, or JJ Bettinger’s official government duties in their various roles as government employees/affiliates. All other authors have no conflicts of interest to disclose in this work.
References
Borg L, Kravets I, Kreek MJ. The pharmacology of long-acting as contrasted with short-acting opioids. In: Ries RK, Miller SC, Fielin DA, editors. Principles of Addiction Medicine. Fourth ed. Philadelphia, PA: Lippincott Wiliamms and Wilkins; 2009:117–132. | |
Ferrari A, Pio Rosario Coccia C, Bertolini A, Sternieri E. Methadone-metabolism, pharmacokinetics, and interactions. Pharmacol Res. 2004;50(6):551–559. | |
Foster DJ, Somogyi AA, Bochner F. Methadone N-demethylation in human liver microsomes: lack of stereoselectivity and involvement of CYP3A4. Br J Clin Pharmacol. 1999;47(4):403–412. | |
Gadel S, Crafford A, Regina K, Kharasch ED. Methadone N-demethylation by the common CYP2B6 allelic variant CYP2B6.6. Drug Metab Dispos. 2013;41(4):709–713. | |
Gerber JG, Rhodes RJ, Gal J. Stereoselective metabolism of methadone N-demethylation by cytochrome P4502B6 and 2C19. Chirality. 2004;16(1):36–44. | |
Kreek MJ, Kalisman M, Irwin M, Jaffery NF. Biliary secretion of methadone and methadone metabolism in man. Res Commun Chem Pathol Pharmacol. 1980;29(1):67–78. | |
Shaiova L. Demystifying opioid conversion calculations, a guide for effective dosing by Mary Lynn McPherson. J Palliat Med. 2011;14(5):668. | |
Eap CB, Buclin T, Baumann P. Interindividual variability of the clinical pharmacokinetics of methadone: implications for the treatment of opioid dependence. Clin Pharmacokinet. 2002;41(14):1153–1193. | |
Sternini C, Patierno S, Selmer IS, Kirchgessner A. The opioid system in the gastrointestinal tract. Neurogastroenterol Motil. 2004;16 Suppl 2:3–16. | |
Kreek MJ, Schecter AJ, Gutjahr CL, Hecht M. Methadone use in patients with chronic renal disease. Drug Alcohol Depend. 1980;5(3):197–205. | |
Sternby JP, Nilsson A, Gared LJ. Diffusive-convective mass transfer rates for solutes present on both sides of a dialyzer membrane. ASAIO J. 2005;51(3):246–251. | |
Perlman R, Giladi H, Brecht K et al. Intradialytic clearance of opioids: Methadone versus hydromorphone. Pain. 2013;154(12):2794–2800. | |
Atkinson TJ, Fudin J, Wegrzyn EL, Bettinger JJ. Dialysis, opioids, and pain management: Where’s the evidence? Practical Pain Management. 2014;14(8):49–57. | |
Kreek MJ, Borg L, Ducat E, Ray B. Pharmacotherapy in the treatment of addiction: methadone. J Addict Dis. 2010;29(2):200–216. | |
Boston RC, Moate PJ. A novel minimal model to describe NEFA kinetics following an intravenous glucose challenge. Am J Physiol Regul Integr Comp Physiol. 2008;294(4):R1140–R1147. | |
Boston RC, Moate PJ. NEFA minimal model parameters estimated from the oral glucose tolerance test and the meal tolerance test. Am J Physiol Regul Integr Comp Physiol. 2008;295(2):R395-R403. | |
Schiesser WE. Hemodialyzer dynamics. In: Schiesser WE, author. Partial Differential Equation Analysis in Biomedical Engineering. New York: Cambridge University Press; 2013:284–299. | |
Schiesser WE. The Numerical Method of Lines Integration of Partial Differential Equations. San Diego: Academic Press; 1991. | |
Clark WR, Gao D. Properties of membranes used for hemodialysis. Semin Dial. 2002;15(3):191–195. | |
Sakai K. Dialysis membranes for blood purification. Front Med Biol Eng. 2000;10(2):117–129. | |
Tortorici MA, Cutler D, Zhang L, Pfister M. Design, conduct, analysis, and interpretation of clinical studies in patients with impaired kidney function. J Clin Pharmacol. 2012;52(1 Suppl):109S–118S. | |
Liang HR, Foltz RL, Meng M, Bennett P. Method development and validation for quantitative determination of methadone enantiomers in human plasma by liquid chromatography/tandem mass spectrometry. J Chromatogr B Analyt Technol Biomed Life Sci. 2004;806(2):191–198. | |
Fudin J, Perkins R. Opioid pharmacokinetics and expected metabolites. Available from: http://paindrcom/wp-content/uploads/2012/05/Opioid-Serum-Predictability-and-Metabolites pdf 2011. Accessed February 4, 2015. | |
Schiesser WE. Differential Equation Analysis in Biomedical Science and Engineering: Ordinary Differential Equation Applications with R. Hoboken, New Jersey: John Wiley and Sons, Inc.; 2014. | |
Schiesser WE. Differential Equation Analysis in Biomedical Science and Engineering: Partial Differential Equation Applications with R. Hoboken, New Jersey: John Wiley and Sons, Inc.; 2014. | |
Chow SC, Shao J, Wang H. A note on sample size calculation for mean comparisons based on noncentral t-statistics. J Biopharm Stat. 2002;12(4):441–456. | |
Griffiths GW, Schiesser WE. Traveling Wave Analysis of Partial Differential Equations. Boston, MA: Academic Press; 2012. | |
Bhimani JP, Ouseph R, Ward RA. Effect of increasing dialysate flow rate on diffusive mass transfer of urea, phosphate, and β2-microglobulin during clinical haemodialysis. Nephrol Dial Transplant. 2010;25(12):3990–3995. | |
Leypoldt JK, Cheung AK. Effect of low dialysate flow rate on hemodialyzer mass transfer area coefficients for urea and creatinine. Home Hemodial Int. 1999;3(51):54. | |
Meyer TW, Leeper EC, Bartlett DW et al. Increasing dialysate flow and dialyzer mass transfer area coefficient to increase the clearance of protein-bound solutes. J Am Soc Nephrol. 2004;15(7):1927–1935. | |
Luo FJ, Patel KP, Marquez IO, Plummer NS, Hosttetter TH, Meyer TW. Effect of increasing dialyzer mass transfer area coefficient and dialysate flow on clearance of protein-bound solutes: a pilot crossover trial. Am J Kidney Dis. 2009;53(6):1042–1049. | |
Šefer S, Degoricija V. About drug dialyzability. Acta Clin Croat. 2003;42:257–267. | |
Nilsson MI, Änggård E, Holmstrand J, Gunne LM. Pharmacokinetics of methadone during maintenance treatment: adaptive changes during the induction phase. Eur J Clin Pharmacol. 1982;22(4):343–349. | |
Meresaar U, Nilsson MI, Holmstrand J, Anggard E. Single dose pharmacokinetics and bioavailability of methadone in man studied with a stable isotope method. Eur J Clin Pharmacol. 1981;20(6):473–478. | |
Linares OA, Linares AL. Computational opioid prescribing: A novel application of clinical pharmacokinetics. J Pain Palliat Care Pharmacother. 2011;25(2):125–135. | |
Garrido MJ, Aguirre C, Trocóniz IF et al. Alpha 1-acid glycoprotein (AAG) and serum protein binding of methadone in heroin addicts with abstinence syndrome. Int J Clin Pharmacol Ther. 2000;38(1):35–40. | |
Fainsinger R, Schoeller T, Bruera E. Methadone in the management of cancer pain: a review. Pain. 1993;52(2):137–147. | |
United States Pharmacopeia. Methadone HCl Safety Data Sheet. USP; 2014. Available from: http://www.usp.org/pdf/EN/referenceStandards/msds/1398009.pdf. Accessed January 28, 2015. | |
Ferner RE. Post-mortem clinical pharmacology. Br J Clin Pharmacol. 2008;66(4):430–443. | |
Mannhold R, Dross KP, Rekker RF. Drug lipophilicity in QSAR practice: I. A comparison of experimental with calculative approaches. Molecular Informatics. 1990;9(1):21–28. | |
Furlan V, Hafi A, Dessalles MC, Bouchez J, Charpentier B, Taburet AM. Methadone is poorly removed by dialysis. Nephrol Dial Transplant. 1999;14(1):254–255. | |
Gwitt PR, Perrier D. Plasma protein binding and distribution characteristics of drugs as indices of their hemodialyzability. Clin Pharmacol Ther. 1978;24(2):154–161. | |
Keller F, Wilms H, Schultze G, Offerman G, Molzahn M. Effect of plasma protein binding, volume of distribution and molecular weight on the fraction of drugs eliminated by hemodialysis. Clin Nephrol. 1983;19(4):201–205. | |
Bell J, Seres V, Bowdron P, Lewis J, Batey R. The use of serum methadone levels in patients receiving methadone maintenance. Clin Pharm Ther. 1988;43(6):623–629. | |
Loimer N, Schmid R, Grunberger J, Jagsch R, Linzmayer L, Presslich O. Pathophysiological reactions in methadone maintenance patients do not correlate with methadone plasma levels. Psychopharmacology (Berl). 1991;103(4):538–540. | |
Holmstrand J, Anggård E, Gunne LM. Methadone maintenance: plasma levels and therapeutic outcome. Clin Pharmacol Ther. 1978;23(2):175–180. | |
Tennant FS Jr. Inadequate plasma concentrations in some high-dose methadone maintenance patients. Am J Psychiatry. 1987;144(10):1349–1350. | |
Tennant F, Shannon J. Cocaine abuse in methadone maintenance patients is associated with low serum methadone concentrations. J Addict Dis. 1995;14(1):67–74. | |
Tennant F. Opioid serum concentrations in patients with chronic pain. J Palliat Med. 2007;10(6):1253–1255. | |
Jung BF, Reidenberg MM. Interpretation of opioid levels: comparison of blood levels during chronic pain therapy to levels from forensic autopsies. Clin Pharmacol Ther. 2005;77(4):324–334. | |
Hiltunen AJ, Beck O, Hjemdahl P et al. Rated well-being in relation to plasma concentrations of l- and d-methadone in satisfied and dissatisfied patients on methadone mainenance treatment. Psychopharmacology (Berl). 1999;143(4):385–393. | |
Rumpf KW, Rieger J, Ansog R, Doht B, Scheler F. Binding of antibiotics by dialysis membranes and its clinical relevance. Proc Eur Dial Transplant Assoc. 1978;14:607–609. | |
PubChem [homepage on the Internet]. (-)-Methadone hydrochloride compound summary for CID 20055402. Available from: http://pubchem.ncbi.nlm.nih.gov/compound/20055402. Accessed January 28, 2015. | |
Grossman DF, Kopp KF, Frey J. Transport of urea by erythrocytes during hemodialysis. Proc Eur Dial Transplant Assoc. 1968;4:250–253. | |
Sargent JA, Gotch FA. Principles and biophysics of dialysis. In: Majer JF, editor. Replacement of Renal Function by Dialysis. 3rd ed. Dordrecht: Kluwer; 1989:87–143. | |
Fournier RL. Basic Transport Phenomena in Biomedical Engineering. 3rd ed. Boca Raton: CRC Press; 2012. | |
Dole VP, Kreek MJ. Methadone plasma level: sustained by a reservoir of drug in tissue. Proc Natl Acad Sci U S A. 1973;70(1):10. |
Supplementary materials
Closely following Schiesser,1 the blood methadone mass conservation balance gives:
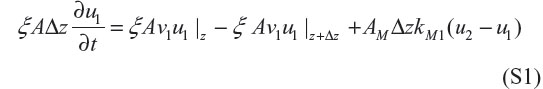
In Equation S1, ξAΔz (∂u1/∂t) represents accumulation of methadone in an incremental volume of blood ξ AΔz (or depletion if the derivative in t is negative). The units of this term are (cm2)(cm)(ng/cm3)(1/min) = ng/min. ξ Av1u1|z represents methadone’s flow by convection into the incremental volume at z. The units of this term are (cm2)(cm/s)(ng/cm3) = ng/min –ξ Av1u1|z+Δz represents methadone’s flow by convection into the incremental volume at z + Δ z. + AM ΔzkM1 (u2 – u1) represents methadone’s mass balance between blood and dialysate into or out of the incremental volume at z. The units of this term are (cm2/cm)(cm)(cm/s)(gmol/cm3) = ng/min. Note that methadone’s mass transfer will be from blood to dialysate if u1 > u2 as u1 decreases with t. Methadone’s mass transfer coefficient km has units of cm/min. This coefficient presumes that only free methadone molecules pass through the dialyzer membrane and that bound methadone remains in the blood stream.
Dividing Equation S1 by ξ AΔz gives,

Taking the limit as Δz → 0,

Equation S2 is the partial differential equation (PDE) for computing u1(z, t). We assume v1 is independent of z so that it can be taken outside the derivative in z.
The PDE for u2 follows from an analogous blood methadone mass conservation balance for the dialysate:
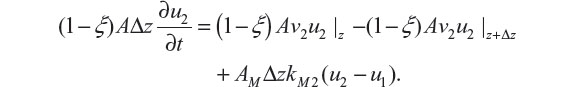
Dividing by (1 – ξ) AΔz and taking the limit as Δz → 0 gives

Notice that the mass transfer terms in Equations S2 and S3 are opposite in sign indicating that the methadone that leaves the blood equals the methadone that enters the dialysate.
Equations S2 and S3 are first order in t and z (they are first order hyperbolic PDEs). Therefore, each requires an initial condition (IC) and a boundary condition (BC). The ICs are

The BCs are somewhat more complicated because of the entering and exiting blood volumes (these header volumes result from the dialyzer design). In each of these volumes, we assume perfect or complete mixing. Therefore, the blood methadone concentration in each volume is described by an ordinary differential equation (ODE) in t (variations in z do not occur through the perfect mixing assumption). The ODE for the left volume header is
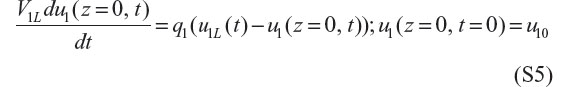
where V1L represents the left volume, q1 the blood volumetric flow rate, u1L the inlet methadone blood concentration, and u10 the initial condition for u1(z = 0, t) at t=0.
Also, the right header volume is described by the following ODE:
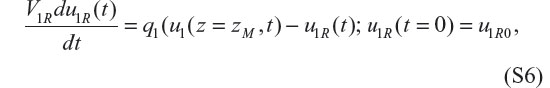
which gives the outflow blood methadone concentration u1R(t). Note that the input into S6 is the outflow blood methadone concentration u1(z = Zm, t) from Equation S2; Zm is the length of the dialyzer membrane. Equation S6 is an ODE in addition to the PDEs of Equations S2 and S3. In addition, q1 = v1ξA relates the blood volumetric and linear flow rates.
The BC for Equation S3 is

where g2(t) is a prescribed function. Equations S2 to S7 constitute the ODE/PDE equations of the model for our in silico experiments using the model.
The ODE/PDE model for the dialyzer is first order in t (convective, hyperbolic), and since it models convection, it naturally propagates steep fronts (even discontinuities) which makes its numerical solution relatively difficult. However, we designed methadone mass flux limiters for this situation to eliminate numerical distortions such as oscillations.2
References
Schiesser WE. Hemodialyzer Dynamics. In: Schiesser WE, author. Partial Differential Equation Analysis in Biomedical Engineering. New York: Cambridge University Press; 2013:284–299. | |
Schiesser WE. Partial Differential Equation Analysis in Biomedical Engineering. Cambridge, UK: Cambridge University Press; 2013. |
 © 2015 The Author(s). This work is published and licensed by Dove Medical Press Limited. The full terms of this license are available at https://www.dovepress.com/terms.php and incorporate the Creative Commons Attribution - Non Commercial (unported, v3.0) License.
By accessing the work you hereby accept the Terms. Non-commercial uses of the work are permitted without any further permission from Dove Medical Press Limited, provided the work is properly attributed. For permission for commercial use of this work, please see paragraphs 4.2 and 5 of our Terms.
© 2015 The Author(s). This work is published and licensed by Dove Medical Press Limited. The full terms of this license are available at https://www.dovepress.com/terms.php and incorporate the Creative Commons Attribution - Non Commercial (unported, v3.0) License.
By accessing the work you hereby accept the Terms. Non-commercial uses of the work are permitted without any further permission from Dove Medical Press Limited, provided the work is properly attributed. For permission for commercial use of this work, please see paragraphs 4.2 and 5 of our Terms.