")
Back to Journals » Clinical Interventions in Aging » Volume 13
Blood pressure response to resistance training in hypertensive and normotensive older women
Authors da Cunha Nascimento D , da Silva CR, Valduga R, Saraiva B, Sousa Neto IV , Vieira A, Schwerz Funghetto S , Silva AO , Oliveira SC, Pereira GB , Willardson JM, Prestes J
Received 19 November 2017
Accepted for publication 8 February 2018
Published 9 April 2018 Volume 2018:13 Pages 541—553
DOI https://doi.org/10.2147/CIA.S157479
Checked for plagiarism Yes
Review by Single anonymous peer review
Peer reviewer comments 2
Editor who approved publication: Dr Richard Walker
Dahan da Cunha Nascimento,1,2 Cristiane Rocha da Silva,1 Renato Valduga,1,3 Bruno Saraiva,1 Ivo Vieira de Sousa Neto,4 Amilton Vieira,4 Silvana Schwerz Funghetto,4 Alessandro Oliveira Silva,5 Samuel da Cunha Oliveira,1 Guilherme Borges Pereira,1 Jefrey M Willardson,6 Jonato Prestes1
1Programa de Pós-Graduação em Educação Física, Universidade Católica de Brasília, Brasília, Brazil; 2Centro Universitário do Distrito Federal (UDF), Brasília, Brazil; 3Centro Universitário Unieuro, Brasília, Brazil; 4Universidade de Brasília (UNB), Brasília, Brazil; 5Centro Universitário de Brasília (UNICEUB), Brasília, Brazil; 6Health and Human Performance Department, Rocky Mountain College, Billings, MT, USA
Purpose: The purpose of the present study was to identify the variability of blood pressure response to a 10-week resistance training (RT) program in hypertensive and normotensive elderly women.
Participants and methods: Twenty-seven untrained hypertensive and 12 normotensive elderly women participated in the present study. A whole-body RT program was performed on two nonconsecutive days per week for 10 weeks. The responsiveness of resting systolic blood pressure (SBP) was determined based on the percent decline between the pre- and post-training time points T1 and T4. The term responders were used to describe subjects who exhibited a percent SBP decline ≥−2.58% and the term nonresponders for subjects who exhibited a percent SBP decline <−2.58%, respectively.
Results: Both the responders and nonresponders in the hypertensive group presented significant changes in SBP (−7.83 ± 5.70 mmHg vs 3.78 ± 7.42 mmHg), respectively. Moreover, the responders and nonresponders in the normotensive group presented significant changes in SBP as well (−8.58 ± 5.52 mmHg vs 5.71 ± 3.84 mmHg).
Conclusion: SBP presents a heterogeneous response to a controlled RT program in hypertensive and normotensive elderly women. A different modality of training and additional therapies should be used for nonresponders in order to decrease resting SBP.
Keywords: resistance training, exercise, hypertension, responsiveness, elderly, obesity
Introduction
Hypertension is a modifiable risk factor for cardiovascular morbidity, with a 68% prevalence in elderly persons.1 Resistance training (RT) is considered as an effective tool to decrease blood pressure (BP) as well as enhance muscle strength, power, hypertrophy, localized endurance, motor performance, and bone mineral density.2–4 Nevertheless, some subjects may exhibit little or an unfavorable BP response to RT as compared with the expected improvement.5
Recently, the premise that exercise always results in beneficial improvements in health-related variables (eg, systolic blood pressure [SBP], fasting insulin, high-density lipoprotein cholesterol, and triglycerides) has been challenged. Bouchard et al analyzed data from six studies with a total of 1,687 adults.5 The percentage of individuals that did not respond in the expected positive direction was 8.0%, 13.0%, 10%, and 12% for fasting insulin, high-density lipoprotein cholesterol, triglycerides, and resting SBP, respectively. These results could not be explained by prior health status, age, amount of exercise, and drug–exercise interactions, confirming that some individuals may not exhibit the expected positive improvements to consistent aerobic training.5 On the other hand, postexercise acute BP decrease is claimed to promote cardiovascular protection and is associated with chronic BP lowering.6 An important mechanism of positive BP lowering promoted by exercise might be explained by the lower renal and muscle sympathetic nerve activity, lower norepinephrine spillover, less renal and cardiac baroreflexes, and lower heart rate variability.7,8
Loenneke et al retrospectively analyzed the BP response of 74 adults from four separate studies and reported that BP adaptation to regular exercise was not always uniform, and some subjects presented a lack of responsiveness to aerobic training.9 A key point raised by the author was that this finding would not have been highlighted or discussed when considering only the group means. To note, it is typical to report only the mean and SD for a group and the analyzed variable, when considerable individual variation may exist in the response to an exercise stimulus.10–12
Regarding the variability in responsiveness to RT, Machado and Willardson showed individuality in the creatine kinase response, especially when shorter rest intervals were utilized between sets.12 Similarly, Prestes et al showed that in elderly women, there was individual variability in irisin, interleukin-1 β, toll-like receptor-4, and brain-derived neurotrophic factor in response to RT.11 Although it is important to report positive health-related responses to RT, it is also important to consider the lesser studied cases in which a low response or lack of response occurs. Presently, little is known concerning the variability in BP response over the course of an RT program. Therefore, the purpose of the present study was to assess the variability in BP in elderly women following a 10-week RT program. We hypothesized that within a sample of elderly women, consisting of both hypertensive and normotensive subjects, there would be both responders and nonresponders.
Participants and methods
Study design and sample
A total of 157 elderly women were assessed for eligibility; 104 were excluded (did not meet inclusion criteria) and 39 hypertensive and 14 normotensive women started the RT program. All subjects were recruited on a voluntary basis from the local community through posters and lectures about the study. Each subject was interviewed and responded to a medical history questionnaire and answered a questionnaire about lifestyle information and use of medications. According to the American College of Sports Medicine, subjects were considered untrained because they had no previous experience with RT.3 After that, subjects were submitted to a resting and exercise electrocardiogram, manual BP measurements, body composition assessment via dual-energy X-ray absorptiometry, fitness functional tests, and orthopedic evaluation by an experienced physiotherapist before participation in the study. Following the initial examination, subjects underwent a 2-week familiarization period to practice the exercises that comprised the RT program.
The characteristics of subject are presented in Tables 1 and 2, for the hypertensive and normotensive groups, respectively. Inclusion criteria for the hypertensive group and for the normotensive group were as follows: women age ≥60 years and body fat percentage ≥30% (according to the recommendations of the National Institute of Diabetes and Digestive and Kidney Diseases obesity was determined as a cutoff point of 30% for women); subjects who self-reported hypertension and had SBP and diastolic blood pressure (DBP) below the threshold of hypertension stage 1 but were using antihypertensive medications.13–15 Subjects were excluded if they had a history of heart failure, valvular or congenital disease, pacemaker implantation, osteoarticular disorders, if they were smokers, or were consuming alcohol.
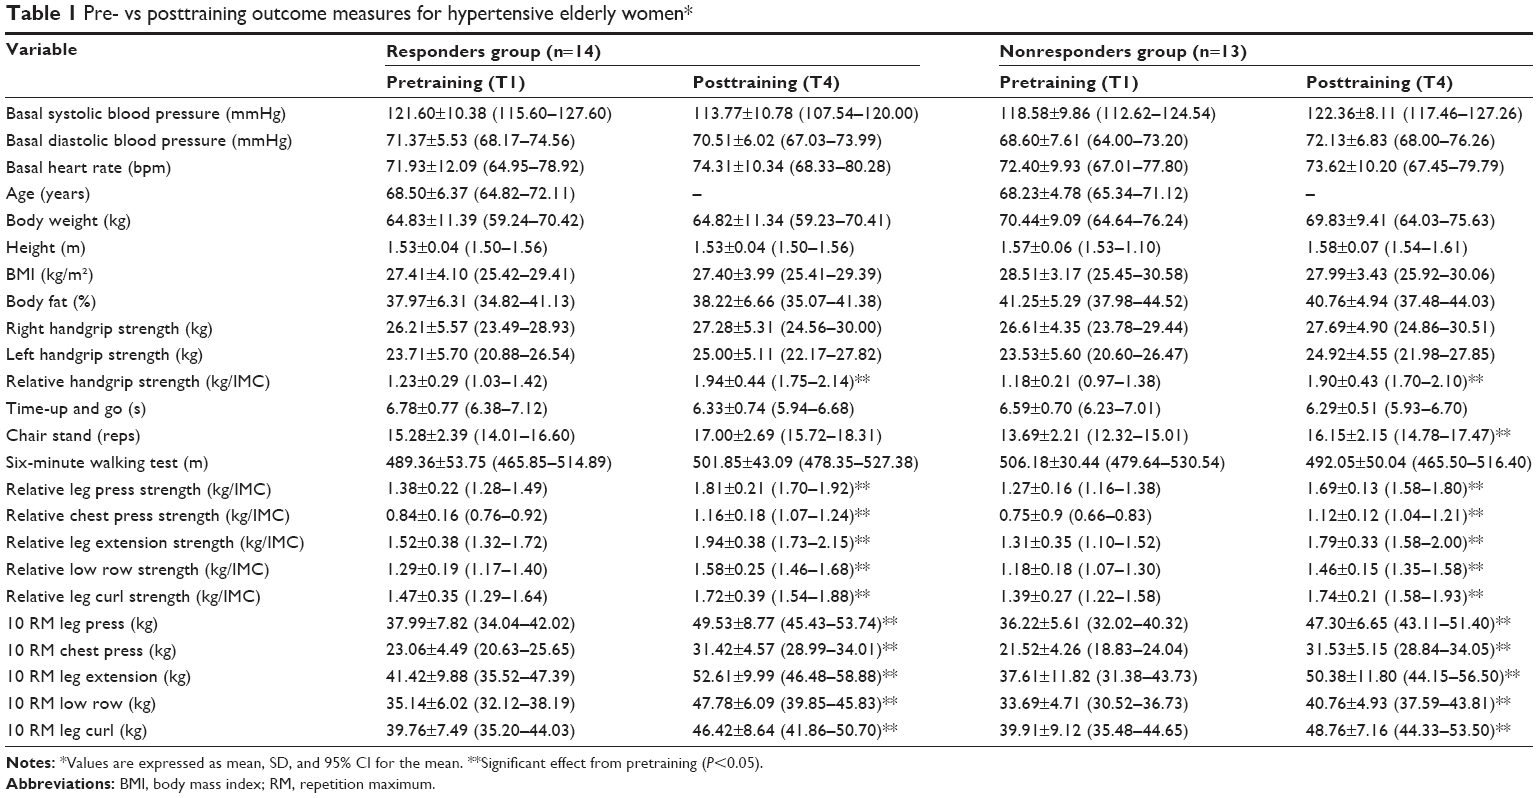 | Table 1 Pre- vs posttraining outcome measures for hypertensive elderly women* |
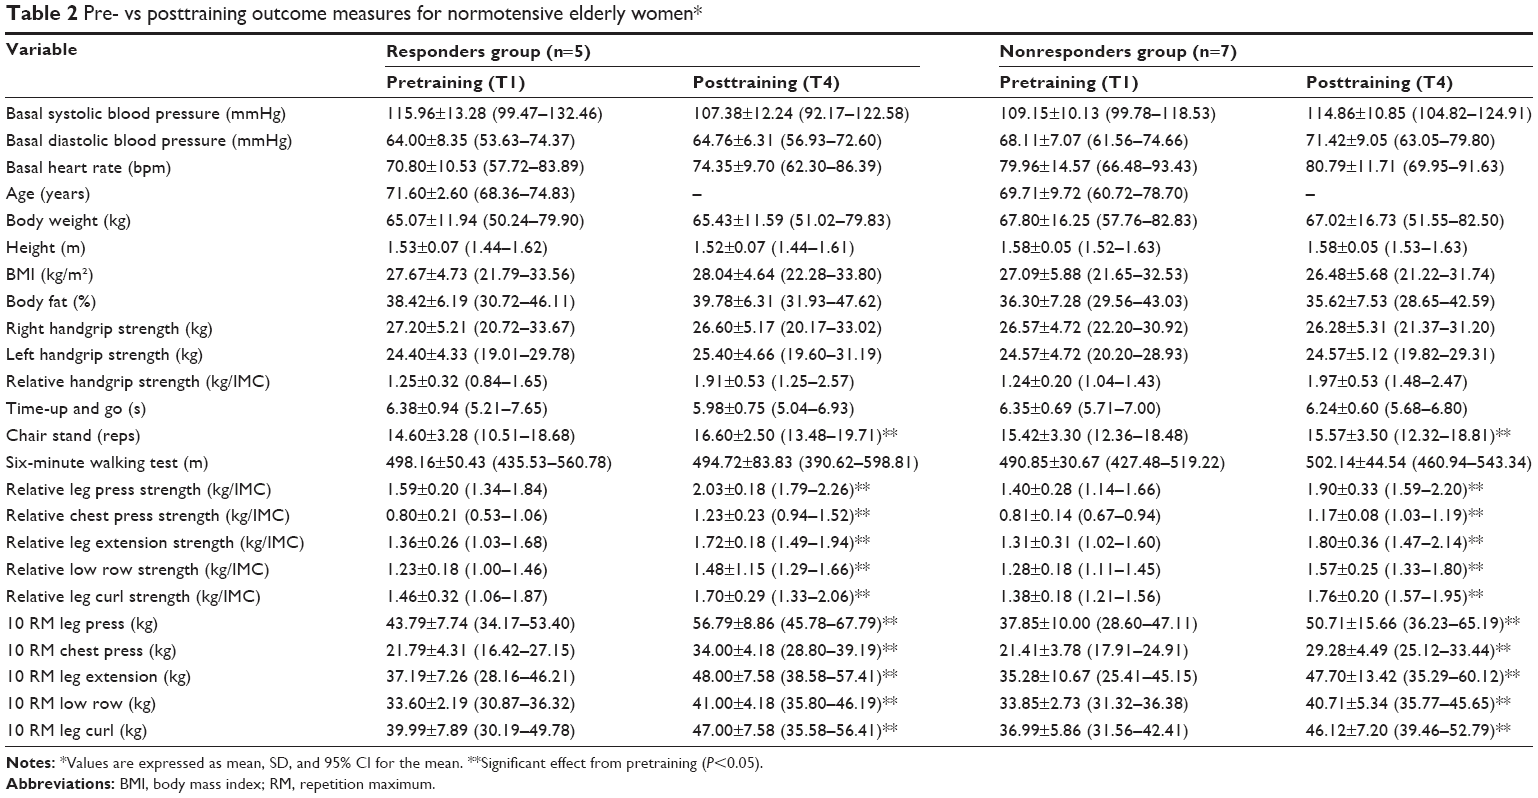 | Table 2 Pre- vs posttraining outcome measures for normotensive elderly women* |
The present study was approved by the Institutional Research Ethic Committee of Catholic University of Brasília (protocol 45648115.8.0000.5650/2016). The study design and employed procedures were in accordance with ethical standards of the Helsinki Declaration. Each subject was fully informed about the risks and benefits associated with participation in the present study and they gave their written informed consent.
RT procedures
The RT consisted of a periodized linear model.16 The exercises performed were: machine leg press, machine chest press, machine leg extension, machine low row, and machine leg curl. The number of repetitions were reduced (maintaining the minimal zone established for each cycle) as the intensity increased. The periodization scheme was in accordance and adapted with our previous research described in detail elsewhere.16 The RT lasted 10 weeks, with two RT sessions performed per week, with a minimum of 24 hours between sessions. The mean duration of training sessions in each mesocycle was 34 min (T1), 42 min (T2), 43 min (T3), and 48 min (T4).
Subjects were instructed to lift and lower loads at a constant velocity, taking ~2 sec for the concentric (muscle shortening) and 2 sec for the eccentric phase (muscle lengthening). All sessions were supervised by experienced RT professionals with a high supervision ratio of 1:1 (coach to participant ratio) to favor greater strength gains and for safety.17 In the first 3 weeks, three sets of 12–14 repetition maximum (RM) with a 60-sec rest interval were performed; from weeks 4–6, three sets of 10–12 RM with a 80-sec rest interval were performed; from weeks 7–8, three sets of 8–10 RM with a 100-sec rest interval were performed; and from weeks 9–10, three sets of 6–8 RM with a 120-sec rest interval were performed. When subjects performed more than three repetitions in the third set beyond the RM zone prescribed the loads were adjusted. During sessions, subjects commonly reported tiredness and difficulty to complete the proposed repetition range on the third set.
In all weeks, repetitions were performed close to concentric failure at the intensities indicated. The loads were monitored in each session. The list and order of the used exercises were as follows: 1) machine leg press; 2) machine chest press; 3) machine leg extension; 4) machine low row; and 5) machine leg curl. Training volume for each exercise was calculated as the product of number of repetitions by the load lifted. Moreover, during the 10 weeks of RT, volume (P>0.05) and intensity (P>0.05) were equated for normotensive and hypertensive elderly women.
Ten-RM tests
The strength of upper and lower body was evaluated by 10-RM strength testing. After the 2-week familiarization period, subjects were tested for a 10 RM for the following exercises in this order: machine leg press, machine chest press, machine leg extension, machine low row, and machine leg curl (Righetto Fitness Equipment, SP, Brazil) with 5 min rest between exercise tests. Subjects were advised to refrain from any exercise other than activities of daily living for at least 48 h before 10-RM testing. In brief, subjects warmed-up on each exercise with 5–10 submaximal repetitions. Subjects performed 10 repetitions of increasing weight until reaching a valid 10 RM. Two minutes of rest was provided between attempts. All 10-RM tests were registered within two attempts.
Two experienced RT professionals supervised the tests. Furthermore, subjects were evaluated by an experienced physiotherapist before the 10-RM testing and study participation. Previous studies from our research group demonstrated a high test and retest reliability for this type of test r>0.97.11,18 All testing sessions were scheduled between the hours of 8:00 AM and 10:00 AM (morning class group) and 1:00 PM and 3:00 PM (afternoon class group). Before each training session, the correct use of hypertensive medications and the risks associated with nonuse were reinforced.19 The medication characteristics are presented in Table 3.
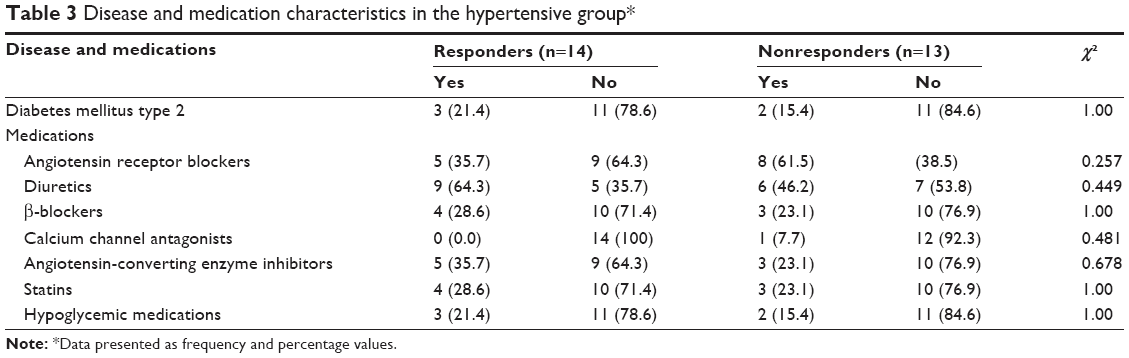 | Table 3 Disease and medication characteristics in the hypertensive group* |
Functional tests and handgrip strength
The functional tests performed were: the 6-min walk test to assess aerobic endurance by the number of meters completed in a 30 meters distance; the 30-sec chair stand to asses lower body strength by the number of full stands during 30 sec with arms folded across; and timed-up-and-go test to determine dynamic balance by the number of seconds to rise from seated position, walk 3 meters, turn, and return to seated position on chair.20 Handgrip strength was evaluated using a handgrip hydraulic dynamometer (SH5001; SAEHAN Corp®, South Korea). Three measures on the right and left hand were obtained and the highest value was recorded. Verbal encouragement was used for all subjects with 1-min rest intervals between measurements. To calculate the relative handgrip strength, the highest reading from each hand was divided by the subject’s body mass index (BMI). In addition, previous research supported strength corrected for BMI over absolute strength measures.21–24 Furthermore, relative strength was calculated for all exercises used during RT program by dividing the 10 RM weight by the subject’s BMI.
Hemodynamic measurements
The SBP, DBP, and heart rate were measured before each training session with an automatic oscillometric validated device (model Microlife BP 3BTO-A; Microlife AG, Espenstrasse, Widnau, Switzerland), considering the recommendations of Committee on Prevention, Detection, Evaluation, and treatment of High Blood Pressure in adults.25–27 The measurements were performed after 10 min of seated rest in a quietly, controlled room temperature and cuff size was adapted to the arm circumference of each subject. All measurements of BP were taken between 8:00 AM and 10:00 AM (morning class group) and 1:00 PM and 3:00 PM (afternoon class group). Before measurements, subjects were advised to refrain from programmed exercise and caffeine consumption.
Subgrouping
The term responders was used to describe subjects who exhibited a percent SBP decline ≥−2.58% (50th percentile or ≥−2.75 mmHg) and the term nonresponders for subjects who exhibited a percent SBP decline <−2.58% (50th percentile or <−2.75 mmHg). Thus, the percent change between SBP time points T4 and T1 was calculated and then used to establish the cut points for two equal groups with the 50th percentile. The 50th percentile was first calculated for the hypertensive group by the exploratory analysis and also used for the normotensive group as the standard cutoff value for categorization. On the basis of this criterion, 14 and 5 of hypertensive and normotensive subjects were classified as responders and 13 and 7 of hypertensive and normotensive subjects were classified as nonresponders. The cutoff value of −2.58% was decided based on the exploratory analysis of the data and dichotomization was applied based on the number of the subjects.28 The responsiveness for SBP was chosen because a decline of least 2 mmHg reduces the risk for stroke and coronary artery disease, respectively.29,30 Furthermore, a clinical or case definition of high responders and adverse responders for SBP does not exist, thus a clinical and physiological criterion to define the SBP at which an individual would be considered a nonresponders needs further evaluation, and one should be very cautious about giving classification of individuals according to the magnitude of their individual pre–post difference.31
It is important to note that we carried out the 10-week RT program period in a subgroup of normotensive subjects to reinforce the hypothesis raised by Bouchard et al that irrespective of prior health status and drug–exercise interactions, a nonuniform BP response would occur.5
Statistical analysis
Data were expressed as means and SD. Shapiro-Wilk and Mauchly’ tests were applied to check for normality and sphericity, respectively. When the assumption of sphericity was not met, the significance of F ratios was adjusted according to the Greenhouse-Geisser correction. A two-way mixed analysis of variance (2×4, groups × moments [T1, T2, T3, and T4]) controlling for preintervention covariate (time of training: morning and afternoon class groups) was applied to determine the effect of responsiveness on hemodynamic, total volume training, and intensity, and a three-way analysis of variance (3×2, factors [training time of the day, groups and moments {pre- and post-10 weeks}]) was considered to compare the differences for height, body weight, BMI, percent body fat, relative strength, absolute strength, and functional fitness tests variables between groups and to verify possible interactions between responsiveness*time (pretraining and posttraining)*time of training (morning class group and afternoon class group).27,32 When differences were indicated, a simple analysis was used and a Bonferroni post hoc test was applied. The differences between groups in the percent changes from pre- to posttraining were analyzed with independent t-test.
For the nonparametric variables (disease and medications), a χ2 for proportions with Fisher’s exact test (expected cell frequencies less than five) was applied. For effect size, we considered the following values of 0.01, 0.06, and 0.14 to indicate small, medium, or large effects for partial eta squared.33 For data presentation, we followed the recommendations by Weissgerber et al, a total sample size of 27 subjects were required to achieve a power level of 0.96 for SBP interaction. Considering an α-error of 0.05, effect size of 0.51 (large), and partial eta squared of 0.20, an α level of ≤0.05 was considered significant, and P-values were two-tailed.34,35 All analyses were conducted with SPSS version 18.0 (SPSS Inc., Chicago, IL, USA). The sample power was calculated by the software G*Power 3.1.6.36 In addition, GraphPad Prism 6.0 software was also used (San Diego, CA, USA).
Results
A total of 27 hypertensive and 12 normotensive elderly women completed the study, and their adherence to the training sessions was >90%. This was determined by dividing the number of exercise sessions attended by the total number of exercise sessions (20 sessions). Twelve subjects from the hypertensive group dropped out before completion: 3 because of prior joint problems specific to the muscle being trained during the first mesocycle (T1) and 9 because their mean participation rate was <90%. Two subjects from normotensive group dropped out before completion because their mean participation rate was <90% (Figure 1).
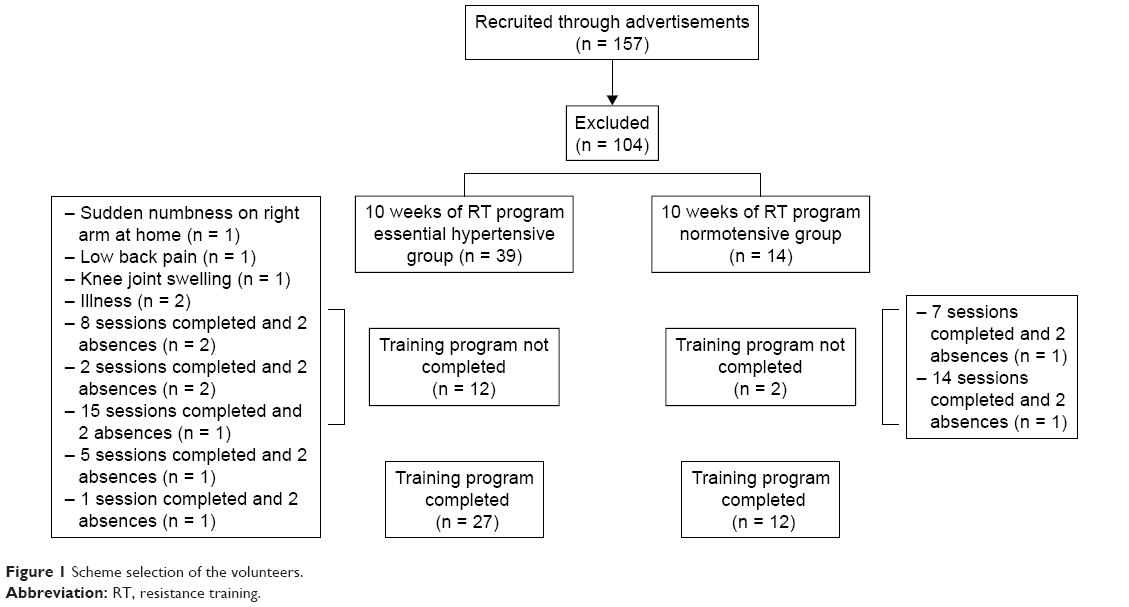 | Figure 1 Scheme selection of the volunteers. |
Hypertensive group results
There was no statistically significant three-way interaction between responsiveness, time, (pretraining vs posttraining) and time of training (morning class group vs afternoon class group) (P>0.05) and no differences in general characteristics between responders and nonresponders (P>0.05). However, differences within time points were verified for both groups on relative handgrip strength (F[1.00, 46.00] = 53.56, P=0.001, η2=0.538), relative leg press strength (F[1.00, 45.00] = 61.90, P=0.001, η2=0.579), chest press (F[1.00, 46.00] = 66.93, P=0.001, η2=0.593), leg extension (F[1.00, 45.00] = 16.66, P=0.001, η2=0.270), low row (F[1.00, 46.00] = 23.69, P=0.001, η2=0.340), and leg curl (F[1.00, 46.00] = 10.57, P=0.002, η2=0.187).
Moreover, differences within time points were verified for both groups for the 10-RM leg press (F[1.00, 45.00] = 28.50, P=0.001, η2=0.388), chest press (F[1.00, 46.00] = 48.67, P=0.001, η2=0.514), leg extension (F[1.00, 45.00] = 13.19, P=0.001, η2=0227), low row (F[1.00, 46.00] = 20.75, P=0.001, η2=0.311), and leg curl (F[1.00, 46.00] = 10.75, P=0.002, η2=0.190). Conversely, only the nonresponders significantly improved on the chair stand test between time points (P=0.001), whereas the responders bordered on statistical significance (P=0.052) (Table 1). Although, no differences between time points within groups were identified for timed-up-and-go test, a tendency toward a statistically significant simple main effect was observed (F[1.00, 46.00] = 3.82, P=0.057, η2=0.077) (Table 1).
Hemodynamic variables in the hypertensive group
There was a statistically significant effect for time (F[3.00, 72.00] = 2.95, P=0.038, partial η2=0.109), and interaction between responsiveness and time on SPB levels (F[3.00, 72.00] = 6.70, P=0.001, partial η2=0.218), but no interaction between time of training (morning class and afternoon class) and responsiveness (F[3.00, 72.00] = 1.14, P=0.338, partial η2=0.00). The nonresponders displayed higher SBP levels when compared with the responders at T4 (P=0.029). Moreover, only the responders diminished SBP at T4 when compared to T1 (F[3.00, 39.00] = 6.02, P=0.002, partial η2=0.317). While an increment was observed for the nonresponders during the RT program, it was not statistically significant (F[3.00, 36.00] = 2.08, P=0.119, partial η2=0.148). Responders and nonresponders changed SBP from T1 to T4 by −7.83 ± 5.70 mmHg (−6.40%) and 3.78 ± 7.42 mmHg (3.51%), respectively. The mean and percent changes from T1 to T4 were different between groups (P=0.001 and P=0.001, respectively) (Figure 2).
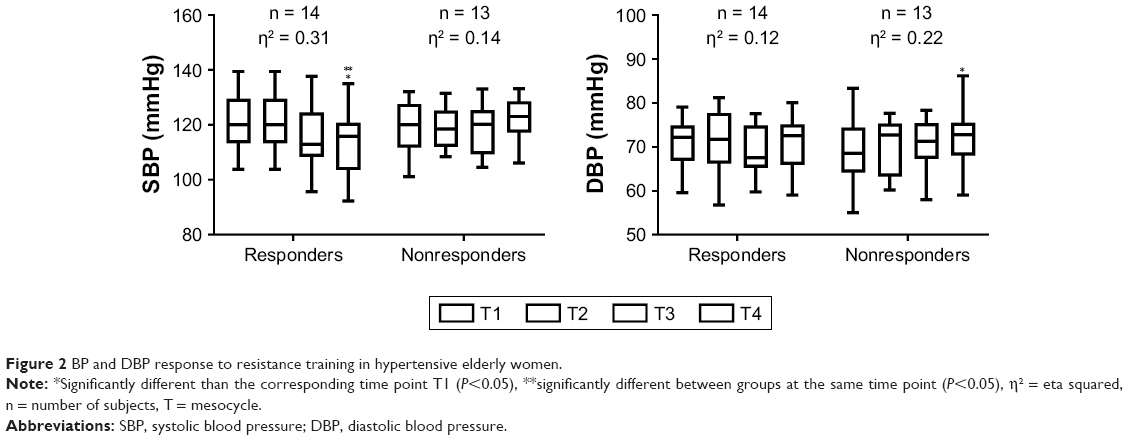 | Figure 2 BP and DBP response to resistance training in hypertensive elderly women. |
DBP of the subjects presented a statistically significant effect of time (F[3.00, 72.00] = 6.02, P=0.001, partial η2=0.20), with an interaction between responsiveness and time (F[3.00, 72.00] = 3.76, P=0.014, partial η2=0.135), and an interaction between time of training (morning class and afternoon class) and responsiveness (F[3.00, 72.00] = 4.52, P=0.06, partial η2=0.159). The nonresponders displayed a higher DBP at T4 when compared with T1 (F[3.00, 36.00] = 3.57, P=0.023, partial η2=0.229). Moreover, the afternoon class group presented a significantly low DBP at T2 (P=0.005) and T4 (P=0.018) when compared with the morning class group. After simple analysis, the simple main effect of time and main effect between time of training and responsiveness became null. The responders and nonresponders changed DBP from T1 to T4 by −0.83 ± 2.14 mmHg (−1.22%) and 3.52 ± 3.58 mmHg (5.45%), respectively. The mean and percent changes from T1 to T4 were different between groups (P=0.001 and P=0.001, respectively) (Figure 2).
Normotensive group results
There was no statistically three-way interaction between responsiveness, time (pretraining and posttraining) and time of training (morning class group and afternoon class group) (P>0.05) and no differences on general characteristics between responders and nonresponders in normotensive elderly women (P>0.05). Although, no differences between groups were identified for relative leg press and chest press, a tendency toward a statistically significant effect was observed (F[1.00, 16.00] = 3.89, P=0.066, η2=0.196) and (F[1.00, 16.00] = 3.39, P=0.084, η2=0.175), respectively (Table 2).
However, differences between time points were verified for both groups on relative handgrip strength (F[1.00, 16.00] = 15.07, P=0.001, partial η2=0.485), relative leg press strength (F[1.00, 16.00] = 22.92, P=0.001, partial η2=0.589), chest press (F[1.00, 16.00] = 42.82, P=0.001, partial η2=0.728), leg extension (F[1.00, 16.00] = 12.48, P=0.003, partial η2=0.438), low row (F[1.00, 16.00] = 8.11, P=0.012, partial η2=0.336), and leg curl (F[1.00, 16.00] = 8.91, P=0.009, partial η2=0.358) (Table 2).
Moreover, differences between time points were verified for both groups on 10-RM leg press (F[1.00, 16.00] = 6.22, P=0.024, partial η2=0.280), chest press (F[1.00, 16.00] = 35.63, P=0.001, partial η2=0.690), leg extension (F[1.00, 16.00] = 6.20, P=0.024, partial η2=0.279), low row (F[1.00, 16.00] = 19.05, P=0.001, partial η2=0.544), and leg curl (F[1.00, 16.00] = 7.18, P=0.016, partial η2=0.310) (Table 2).
Hemodynamic variables for normotensive group
There was no statistically significant effect of time (F[3.00, 27.00] = 0.97, P=0.418, partial η2=0.098), no interaction between time of training (morning class and afternoon class) and responsiveness (F[3.00, 27.00] = 0.51, P=0.67, partial η2=0.054), but an interaction between responsiveness and time on SBP levels (F[3.00, 27.00] = 10.69, P=0.001, partial η2=0.543), was verified. However, when analyzed by interaction, after simple analysis, differences between responders became null. Responders and nonresponders changed SBP from T1 to T4 by −8.58 ± 5.52 mmHg (−7.32%) and 5.71 ± 3.84 mmHg (5.25%), respectively. The mean and percent changes from T1 to T4 were different between groups (P=0.001 and P=0.001, respectively) (Figure 3).
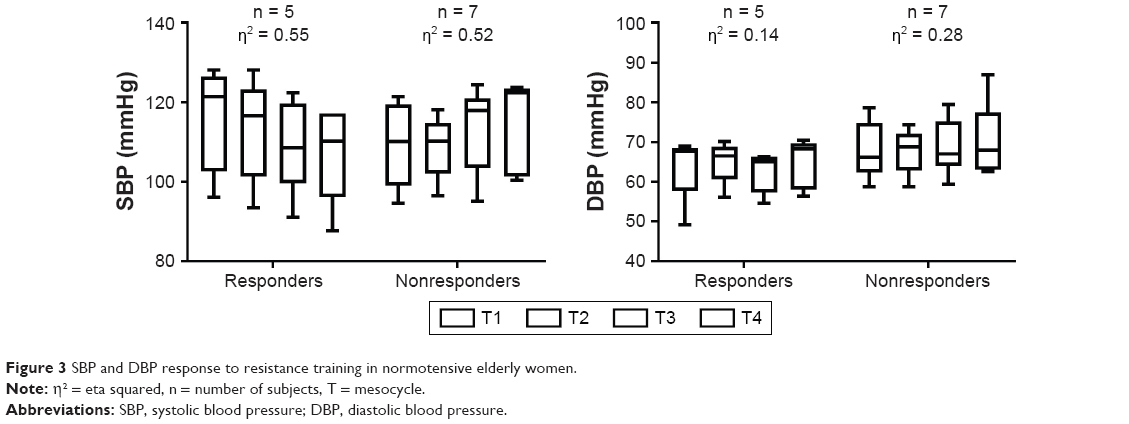 | Figure 3 SBP and DBP response to resistance training in normotensive elderly women. |
DBP of normotensive subjects showed no statistically significant effect of time (F[3.00, 27.00] = 1.43, P=0.25, partial η2=0.138), no interaction between time of training (morning class and afternoon class) and responsiveness (F[3.00, 27.00] = 0.58, P=0.63, partial η2=0.061), and no interaction between responsiveness and time on DBP levels (F[3.00, 27.00] = 1.07, P=0.37, partial η2=0.378). Responders and nonresponders changed DBP from T1 to T4 by −0.76 ± 6.04 mmHg (1.98%) and 3.31 ± 3.59 mmHg (4.75%), respectively. The mean and percent changes from T1 to T4 were not different between groups (P=0.379 and P=0.538, respectively) (Figure 3).
Total training volume and intensity for hypertensive and normotensive groups
No significant between-responders group differences were noted for intensity nor when controlling time of training (morning class and afternoon class) as covariate. (Figures 4 and 5 for hypertensive and normotensive groups, respectively). Similarly, no significant between-responders group differences were noted for total training volume nor when controlling time of training (morning class and afternoon class) as covariate. (Figures 6 and 7 for hypertensive and normotensive groups, respectively).
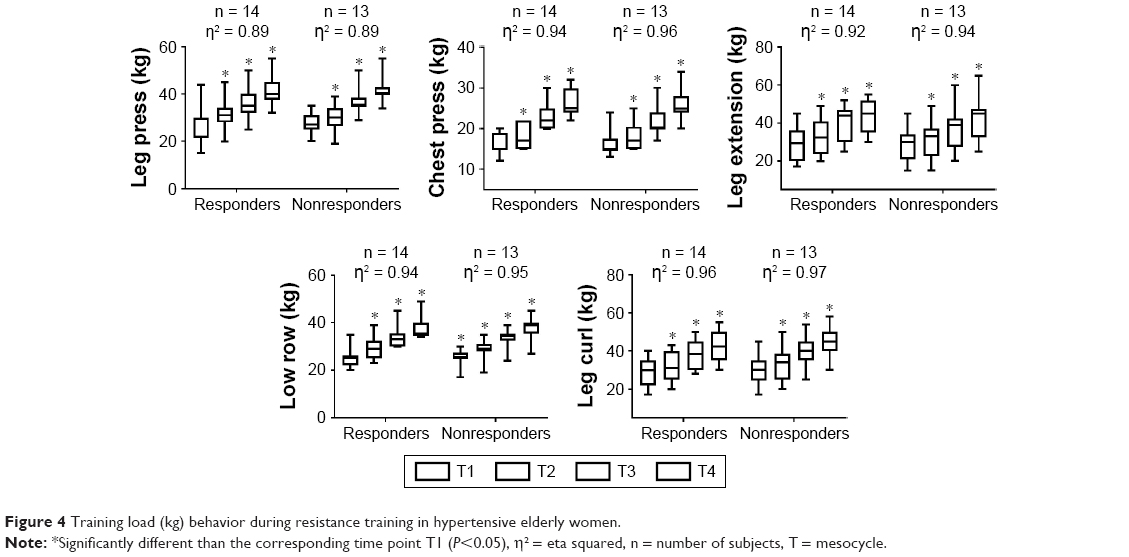 | Figure 4 Training load (kg) behavior during resistance training in hypertensive elderly women. |
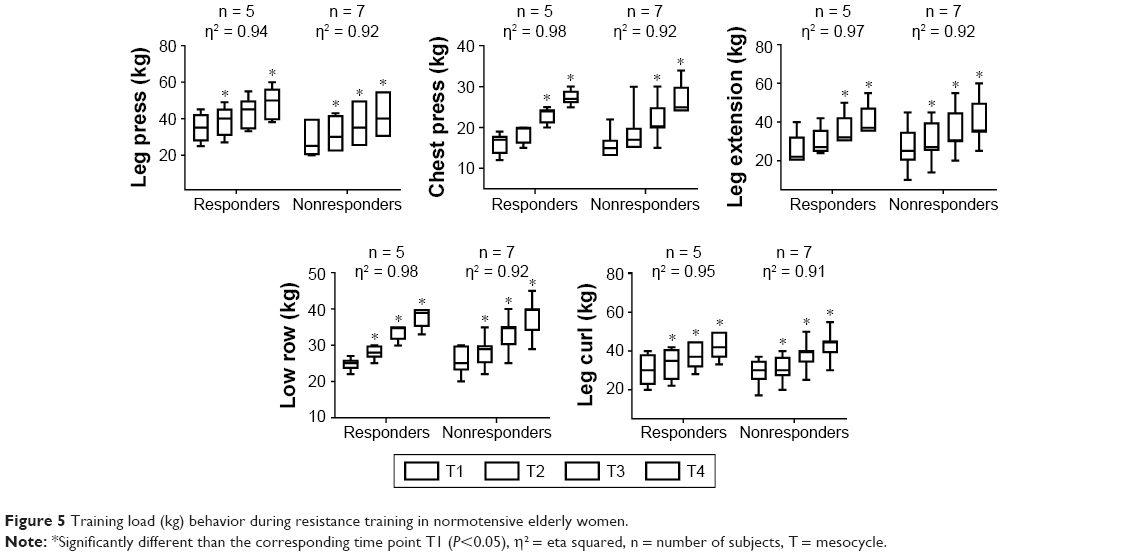 | Figure 5 Training load (kg) behavior during resistance training in normotensive elderly women. |
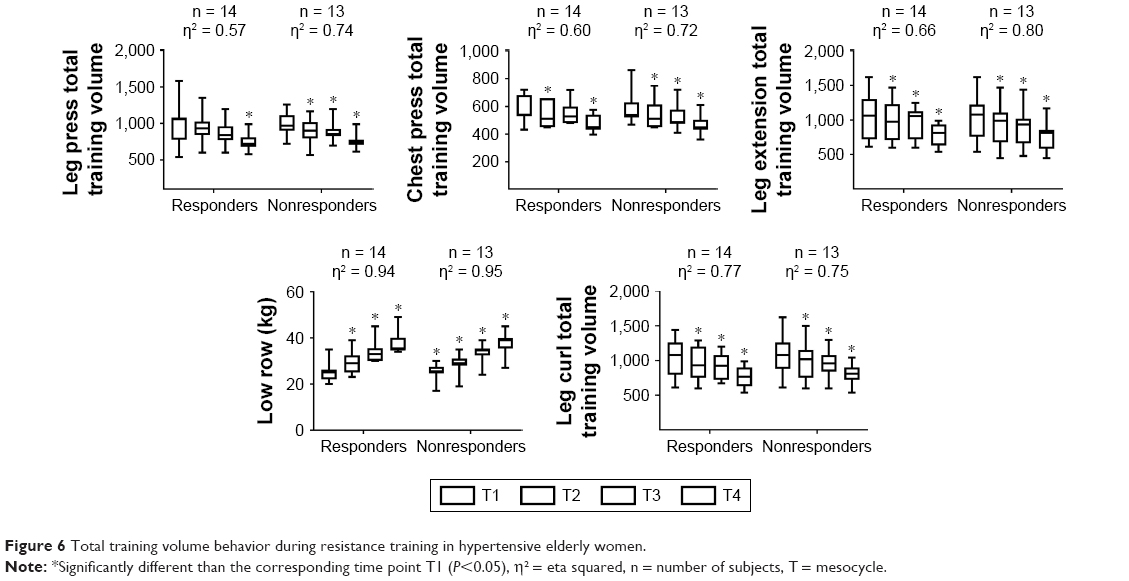 | Figure 6 Total training volume behavior during resistance training in hypertensive elderly women. |
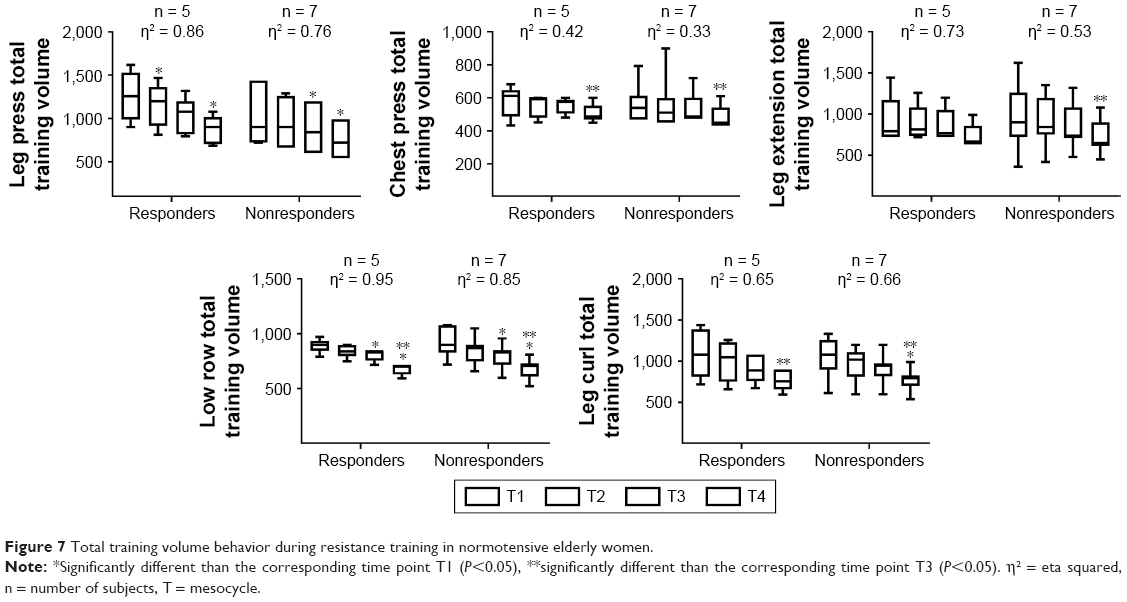 | Figure 7 Total training volume behavior during resistance training in normotensive elderly women. |
Discussion
To the authors’ knowledge, this was the first study to assess SBP response variability in elderly hypertensive and normotensive women following a periodized RT program. The present findings demonstrated that the SBP response between elderly hypertensive and normotensive women was not always in the antihypertensive direction. These results show that not all subjects will benefit from RT as an antihypertensive lifestyle therapy.2,4,30
With respect to the BP measurements, both the responders and nonresponders in the hypertensive group presented significant changes in SBP (−7.83 ± 5.70 mmHg vs 3.78 ± 7.42 mmHg), respectively. Moreover, the responders and nonresponders in the normotensive group presented significant changes in SBP (−8.58 ± 5.52 mmHg vs 5.71 ± 3.84 mmHg), respectively. Additionally, a significant improvement in the 30-sec chair stand test and strength for all exercises was observed between time points.
A relevant question is whether such relations between RT and lack of response in BP improvement were affected by time of day. Jones et al evaluated the BP reactivity index to investigate whether the BP response to everyday physical activities changed during the normal sleep-wake cycle.32 The highest reactivity of SBP and DBP was observed between 8:00 AM and 10:00 AM. In addition, the morning increase in BP was present irrespective of BP status (normotensive or hypertensive group).32 This is in line with our study, because the afternoon class from the hypertensive group presented a significantly lower DBP response at T2 and T4 when compared with the morning class from the same group (trained between 8:00 AM and 10:00 AM). Nevertheless, time of day was introduced as a covariate in the present study and no interactions in responsiveness were observed.
Another important factor is that SBP reductions have been shown to be greater for individuals with higher baseline SBP.2 However, in the present study, there was no significant difference between groups in baseline SBP. This suggests that starting values might not necessarily determine the beneficial response to training.9 Moreover, Bouchard et al5 reinforced that a lack of responsiveness in BP following exercise training could not be explained by prior health status, age, amount of exercise imposed, and drug–exercise interactions. Although, mechanisms for the lack of responsiveness are unknown, the present study reinforces the suggestions of Bouchard et al, and further research is required to clarify the potential molecular mechanisms that may account for the lack of improvement in BP from an RT program.5 Between the possible mechanisms involved in BP decrease following RT, lower renal and muscle sympathetic nerve activity, lower norepinephrine spillover, less renal and cardiac baroreflexes, and lower heart rate variability may contribute.7,8
It is also possible that intensity and volume could affect responsiveness.31 Previous research comparing low (1 set of 13 repetitions with 50% of 1 RM) vs high intensity (1 set of 8 repetitions with 80% of 1 RM) RT in adults aged 60–85 years37 demonstrated that resting SBP and mean blood pressure were significantly lower in the high intensity protocol compared to the low intensity group after training. However, no significant between-groups differences were observed for intensity and total training volume in the present study. Furthermore, Brito et al evaluated the effect of two RT sessions with different volumes on postexercise hypotension in hypertensive elderly subjects. Subjects completed 1 set of exercises with 50% of 1 RM and exercises with 3 sets at 50% of 1 RM. The results demonstrated that the reduction in SBP, DBP, and mean BP was superior in the recovery period after a higher volume of training.38
The lack of BP responsiveness to an RT program might be influenced by external factors such as nutritional status.39 Moreover, Moreira et al demonstrated that elderly hypertensive subjects carrying the D/D genotype of the angiotensin-converting enzyme (ACE) presented an impaired (increase) BP response following an aerobic exercise session, especially during sleep.40 In addition, an impaired release of nitric oxide, and higher activity of sympathetic tone during the 24 h postexercise recovery period was also observed. Finally, the time taken to return to resting homeostasis after a training session (eg, vagal-related heart variability), might differ between high and adverse responders.39 Thus, further research is required to clarify the effect of nutritional, ACE polymorphism, and exercise recovery on the variability in BP response to an RT program.
Although, some subjects did not respond positively in terms of their BP response, the observed increase in muscle strength and functional fitness tests promoted by RT would facilitate better performance in daily living activities in elderly subjects. In addition, a higher level of muscle strength appears to protect hypertensive subjects against all-cause mortality.41 Although, the BP response to an RT program was different between responders and nonresponders, not all subjects who are low BP responders to RT will necessarily be nonresponders to aerobic or combined training, and this issue requires further investigation.39
It is important to note that the present study has some limitations. First, lack of nutritional control. Second, measures of ACE-D/D genotypes that are more prone for higher plasma activity and angiotensin production, and oxidative stress variables measures that are responsible for endothelial dysfunction. Third, assessment of the RT effects on arterial stiffness in normotensive and hypertensive elderly subjects by noninvasive techniques such as echo-Doppler, which could explain the BP variability, were observed in the present study. Furthermore, we cannot affirm that hypertensive subjects enrolled in our study were at hypertensive stage 1 category as the hypertensive medications can promote an SBP and DBP below the threshold classification and finally the present study was lacking from a control group.27,42–45
Another important limitation of our study is that, the classification of individuals as responders and nonresponders differs considerably, and one way of establishing responsiveness is by the use of subjects according to the magnitude of their individual prepost difference, as used in our study and previous research.10–12,46 However, we are aware that this intuitive approach of using 50th percentile by our research group might present a shortcoming. The percentile used to define the SBP at which an individual would be considered a responder and nonresponder needs further evaluation.
The increase in BP with aging is a contributor to the development of hypertension and cardiovascular disease, this study supports RT as a nonpharmacological therapy in the management of BP control, both in normotensive and hypertensive elderly women. The results of the present study provide compelling evidence that some hypertensive and normotensive elderly women will present a variable BP response to RT. So, considering the inconclusive nature and the sparse data about the variability in BP response, we still encourage the use of RT for health promotion, antihypertensive therapy, and protection against all-cause mortality in hypertensive individuals.2,4,41 Nonetheless, it is important that individuals with a nonresponse pattern must be identified. For nonresponders to RT, the practitioner may change the exercise type, because not all subjects who are classified as low RT responders will exhibit a lack of responsiveness to another exercise modality.
Acknowledgments
The authors would like to thank the laboratory LAFIT of the Universidade Católica de Brasília (Daniele Garcia and contributors). In addition, the first author wants to dedicate this paper to his family (Rita de Cassia and Nicolas Cunha). The authors (Dahan da Cunha Nascimento, Cristiane Rocha Silva and Bruno Saraiva) would also like to acknowledge the financial support from Coordenação de Aperfeiçoamento de Pessoal de Nível Superior (CAPES) and Fundação de Apoio a Pesquisa do Distrito Federal (FAP/DF).
Author contributions
All authors contributed significantly to this study and have read and approved the submitted manuscript. DCN, JP, AV, JMW, CRS, and GBP designed and conducted the research and wrote the manuscript. BS, RV, IVSN, SCO, AOS, and SSF conducted the research. DCN and JP designed the research, analyzed the data, wrote the manuscript, and had primary responsibility for final content. All the authors contributed to the study design, data collection, and drafting the article.
Disclosure
The authors report no conflict of interest in this work.
References
Picon RV, Fuchs FD, Moreira LB, Riegel G, Fuchs SC. Trends in prevalence of hypertension in Brazil: a systematic review with meta-analysis. PLoS One. 2012;7(10):e48255. | ||
MacDonald HV, Johnson BT, Huedo-Medina TB, et al. Dynamic resistance training as stand-alone antihypertensive lifestyle therapy: a meta-analysis. J Am Heart Assoc. 2016;5(10). pii: e003231. | ||
Kim TN, Yang SJ, Yoo HJ, et al. Prevalence of sarcopenia and sarcopenic obesity in Korean adults: the Korean sarcopenic obesity study. Int J Obes (Lond). 2009;33(8):885–892. | ||
Pollock ML, Franklin BA, Balady GJ, et al. AHA Science Advisory. Resistance exercise in individuals with and without cardiovascular disease: benefits, rationale, safety, and prescription: An advisory from the Committee on Exercise, Rehabilitation, and Prevention, Council on Clinical Cardiology, American Heart Association; Position paper endorsed by the American College of Sports Medicine. Circulation. 2000;101(7):828–833. | ||
Bouchard C, Blair SN, Church TS, et al. Adverse metabolic response to regular exercise: is it a rare or common occurrence? PLoS One. 2012;7(5):e37887. | ||
Tibana RA, de Sousa NM, da Cunha Nascimento D, et al. Correlation between acute and chronic 24-hour blood pressure response to resistance training in adult women. Int J Sports Med. 2015;36(1):82–89. | ||
Sharman JE, La Gerche A, Coombes JS. Exercise and cardiovascular risk in patients with hypertension. Am J Hypertens. 2015;28(2):147–158. | ||
de Sousa EC, Abrahin O, Ferreira ALL, Rodrigues RP, Alves EAC, Vieira RP. Resistance training alone reduces systolic and diastolic blood pressure in prehypertensive and hypertensive individuals: meta-analysis. Hypertens Res. 2017;40(11):927–931. | ||
Loenneke JP, Fahs CA, Abe T, et al. Hypertension risk: exercise is medicine* for most but not all. Clin Physiol Funct Imaging. 2014;34(1):77–81. | ||
Tajra V, Tibana RA, Vieira DC, et al. Identification of high responders for interleukin-6 and creatine kinase following acute eccentric resistance exercise in elderly obese women. J Sci Med Sport. 2014;17(6):662–666. | ||
Prestes J, da Cunha Nascimento D, Tibana RA, et al. Understanding the individual responsiveness to resistance training periodization. Age (Dordr). 2015;37(3):9793. | ||
Machado M, Willardson JM. Short recovery augments magnitude of muscle damage in high responders. Med Sci Sports Exerc. 2010;42(7):1370–1374. | ||
National Institute of Health. Understanding Adult Overweight and Obesity. Bethesda: National Institute of Diabetes and Digestive and Kidney Diseases; 2001. Available from: https://www.niddk.nih.gov/health-information/communication-programs/win. Accessed March 16, 2018. | ||
Lima-Costa MF, Peixoto SV, Firmo JO. [Validity of self-reported hypertension and its determinants (the Bambui study)]. Rev Saude Publica. 2004;38(5):637–642. Portuguese [with English abstract]. | ||
Alonso A, Beunza JJ, Delgado-Rodriguez M, Martinez-Gonzalez MA. Validation of self reported diagnosis of hypertension in a cohort of university graduates in Spain. BMC Public Health. 2005;5:94. | ||
Prestes J, Shiguemoto G, Botero JP, et al. Effects of resistance training on resistin, leptin, cytokines, and muscle force in elderly post-menopausal women. J Sports Sci. 2009;27(14):1607–1615. | ||
Gentil P, Bottaro M. Influence of supervision ratio on muscle adaptations to resistance training in nontrained subjects. J Strength Cond Res. 2010;24(3):639–643. | ||
Dos Santos ES, Asano RY, Filho IG, et al. Acute and chronic cardiovascular response to 16 weeks of combined eccentric or traditional resistance and aerobic training in elderly hypertensive women: a randomized controlled trial. J Strength Cond Res. 2014;28(11):3073–3084. | ||
Gomides RS, Costa LA, Souza DR, et al. Atenolol blunts blood pressure increase during dynamic resistance exercise in hypertensives. Br J Clin Pharmacol. 2010;70(5):664–673. | ||
Rikli RE, Jones CJ. Functional fitness normative scores for community-residing older adults, ages 60–94. J Aging Phys Act. 1999;7(2):162–181. | ||
Lee WJ, Peng LN, Chiou ST, Chen LK. Relative handgrip strength is a simple indicator of cardiometabolic risk among middle-aged and older people: a nationwide population-based study in Taiwan. PLoS One. 2016;11(8):e0160876. | ||
Prestes J, Tibana RA. Muscular static strength test performance and health: absolute or relative values? Rev Assoc Med Bras (1992). 2013;59(4):308–309. | ||
Lawman HG, Troiano RP, Perna FM, Wang CY, Fryar CD, Ogden CL. Associations of relative handgrip strength and cardiovascular disease biomarkers in U.S. Adults, 2011–2012. Am J Prev Med. 2016;50(6):677–683. | ||
Choquette S, Bouchard DR, Doyon CY, Senechal M, Brochu M, Dionne IJ. Relative strength as a determinant of mobility in elders 67–84 years of age. A nuage study: nutrition as a determinant of successful aging. J Nutr Health Aging. 2010;14(3):190–195. | ||
Cuckson AC, Reinders A, Shabeeh H, Shennan AH. Validation of the Microlife BP 3BTO-A oscillometric blood pressure monitoring device according to a modified British Hypertension Society protocol. Blood Press Monit. 2002;7(6):319–324. | ||
Jones DW, Hall JE. Seventh report of the Joint National Committee on Prevention, Detection, Evaluation, and Treatment of High Blood Pressure and evidence from new hypertension trials. Hypertension. 2004;43(1):1–3. | ||
Whelton PK, Carey RM, Aronow WS, et al. 2017 ACC/AHA/AAPA/ABC/ACPM/AGS/APhA/ASH/ASPC/NMA/PCNA Guideline for the prevention, detection, evaluation, and management of high blood pressure in adults: executive summary: a report of the American College of Cardiology/American Heart Association Task Force on Clinical Practice Guidelines. Hypertension. Epub 2017 Nov 13. | ||
Streiner DL. Breaking up is hard to do: the heartbreak of dichotomizing continuous data. Can J Psychiatry. 2002;47(3):262–266. | ||
Cook NR, Cohen J, Hebert PR, Taylor JO, Hennekens CH. Implications of small reductions in diastolic blood pressure for primary prevention. Arch Intern Med. 1995;155(7):701–709. | ||
Pescatello LS, Franklin BA, Fagard R, Farquhar WB, Kelley GA, Ray CA. American College of Sports Medicine position stand. Exercise and hypertension. Med Sci Sports Exerc. 2004;36(3):533–553. | ||
Hecksteden A, Kraushaar J, Scharhag-Rosenberger F, Theisen D, Senn S, Meyer T. Individual response to exercise training: a statistical perspective. J Appl Physiol (1985). 2015;118(12):1450–1459. | ||
Jones H, Atkinson G, Leary A, George K, Murphy M, Waterhouse J. Reactivity of ambulatory blood pressure to physical activity varies with time of day. Hypertension. 2006;47(4):778–784. | ||
Cohen J. Statistical Power Analysis for the Behavioral Sciences. 2nd ed. Hillsdale: L. Erlbaum Associates; 1988. | ||
Weissgerber TL, Milic NM, Winham SJ, Garovic VD. Beyond bar and line graphs: time for a new data presentation paradigm. PLoS Biol. 2015;13(4):e1002128. | ||
Beck TW. The importance of a priori sample size estimation in strength and conditioning research. J Strength Cond Res. 2013;27(8):2323–2337. | ||
Faul F, Erdfelder E, Lang AG, Buchner A. G*Power 3: a flexible statistical power analysis program for the social, behavioral, and biomedical sciences. Behav Res Methods. 2007;39(2):175–191. | ||
Vincent KR, Vincent HK, Braith RW, Bhatnagar V, Lowenthal DT. Strength training and hemodynamic responses to exercise. Am J Geriatr Cardiol. 2003;12(2):97–106. | ||
Brito Ade F, de Oliveira CV, Brasileiro-Santos Mdo S, Santos Ada C. Resistance exercise with different volumes: blood pressure response and forearm blood flow in the hypertensive elderly. Clin Interv Aging. 2014;9:2151–2158. | ||
Mann TN, Lamberts RP, Lambert MI. High responders and low responders: factors associated with individual variation in response to standardized training. Sports Med. 2014;44(8):1113–1124. | ||
Moreira SR, Nóbrega OT, Santana HAP, Sales MM, Farinatti PTV, Simões HG. Impact of ACE I/D gene polymorphism on blood pressure, heart ratevariability and nitric oxide responses to the aerobic exercisein hypertensive elderly. Revista Andaluza de Medicina del Deporte. In press 2016. | ||
Artero EG, Lee DC, Ruiz JR, et al. A prospective study of muscular strength and all-cause mortality in men with hypertension. J Am Coll Cardiol. 2011;57(18):1831–1837. | ||
Choudhury I, Jothimalar R, Patra AK. Angiotensin converting enzyme gene polymorphism and its association with hypertension in South Indian population. Indian J Clin Biochem. 2012;27(3):265–269. | ||
Mozos I, Luca CT. Crosstalk between oxidative and nitrosative stress and arterial stiffness. Curr Vasc Pharmacol. 2017;15(5):446–456. | ||
Quinn U, Tomlinson LA, Cockcroft JR. Arterial stiffness. JRSM Cardiovasc Dis. 2012;1(6):cvd.2012.012024. | ||
Li Y, Hanssen H, Cordes M, Rossmeissl A, Endes S, Schmidt-Trucksass A. Aerobic, resistance and combined exercise training on arterial stiffness in normotensive and hypertensive adults: a review. Eur J Sport Sci. 2015;15(5):443–457. | ||
Prestes J, Nascimento DDC, Neto IVS, et al. The effects of muscle strength responsiveness to periodized resistance training on resistin, leptin, and cytokine in elderly postmenopausal women. J Strength Cond Res. 2018;32(1):113–120. |
 © 2018 The Author(s). This work is published and licensed by Dove Medical Press Limited. The full terms of this license are available at https://www.dovepress.com/terms.php and incorporate the Creative Commons Attribution - Non Commercial (unported, v3.0) License.
By accessing the work you hereby accept the Terms. Non-commercial uses of the work are permitted without any further permission from Dove Medical Press Limited, provided the work is properly attributed. For permission for commercial use of this work, please see paragraphs 4.2 and 5 of our Terms.
© 2018 The Author(s). This work is published and licensed by Dove Medical Press Limited. The full terms of this license are available at https://www.dovepress.com/terms.php and incorporate the Creative Commons Attribution - Non Commercial (unported, v3.0) License.
By accessing the work you hereby accept the Terms. Non-commercial uses of the work are permitted without any further permission from Dove Medical Press Limited, provided the work is properly attributed. For permission for commercial use of this work, please see paragraphs 4.2 and 5 of our Terms.