")
Back to Journals » Nature and Science of Sleep » Volume 9
The effect of physical activity on sleep quality, well-being, and affect in academic stress periods
Authors Wunsch K, Kasten N, Fuchs R
Received 12 January 2017
Accepted for publication 14 March 2017
Published 26 April 2017 Volume 2017:9 Pages 117—126
DOI https://doi.org/10.2147/NSS.S132078
Checked for plagiarism Yes
Review by Single anonymous peer review
Peer reviewer comments 4
Editor who approved publication: Dr Steven A Shea
Kathrin Wunsch, Nadine Kasten, Reinhard Fuchs
Department of Sport Science, Sport Psychology Unit, Albert-Ludwigs University Freiburg, Freiburg im Breisgau, Germany
Abstract: The stress-buffering hypothesis postulates that physical activity and exercise can buffer the negative effects of (academic) stress on health. It still remains an open question whether students, who regularly engage in physical activity and exercise within their academic examination period, can successfully diminish these negative effects. Sixty-four subjects participated in this study and completed a total of five surveys, with T1 at the end of the semester break (baseline) and T2–T5 being presented every Friday in the last 4 weeks of the semester (examination period). They were asked to answer questions about their activity level, sleep quality, well-being and affect. Hierarchical linear models showed significant dependencies on time for all dependent measures. The expansion of the model for exercise also showed significant main effects of this predictor on well-being and positive affect (PA) and negative affect. Moreover, significant interactions with time for sleep quality and PA were found. Results suggest that physical activity and exercise in the academic examination period may be able to buffer the negative effects of stress on health-related outcomes. Therefore, activity levels should be maintained in times of high stress to prevent negative effects on sleep, well-being and affect in students.
Keywords: examination stress, exercise, stress-buffering hypothesis
Introduction
One of the most eminent stressors in students’ lives is academic stress (AS).1 Students report experiencing AS at predictable times each semester with the greatest extent at the end of a semester, resulting from taking and studying for exams, grade competition and the large amount of time invested in studying.2–5
The effectiveness of AS as a psychosocial stressor is well established regarding repercussions on physiological and psychological health.6 It has been shown that AS has negative implications on physiological health variables, such as immune functions (suppresses cellular immunity while preserving humoral immunity)7 and neuroendocrine functions (increase in adrenocorticotropic hormone levels and cortisol levels, when perceiving high stress).8 Furthermore, in AS periods, different effects on psychological parameters can be detected, such as increased anxiety,9 poor sleep quality,10 a negative effect on well-being,11 increased negative affectivity12 and increases in the prevalence of depressive symptoms.13 Based on these findings, it can be assumed that times of high AS (ie, examination periods) have a negative impact on health-related physiological and psychological outcomes.
Evidence suggests the relationship between stress and sleep quality to be bidirectional: 1) high stress levels have negative effects on sleep quality14 and 2) poor sleep quality affects subsequent stress levels.15 Regarding the effect of stress on sleep quality, a growing body of research suggests that high stress levels negatively influence sleep quality.16 Taking AS as the stress-evoking situation, a study conducted by Lund et al10 found that students with higher stress levels also report poorer sleep quality and more negative mood and illness. Regarding the reverse effect of sleep quality on stress, studies have shown that sleep deprivation (ie, poor sleep quality) potentiated stress responses of the hypothalamic–pituitary–adrenal (HPA) axis (ie, cortisol secretion) in a similar way as real stress does17 and that reactivity to a psychosocial laboratory stressor after sleep deprivation was increased compared to that in normal sleeping participants. These effects have also been shown for psychological stress outcomes, as participants with poor sleep quality showed significantly more fatigue and lower behavioral alertness.17,18 These results were also confirmed in a longitudinal approach with student’s sleep quality and duration predicting mood and self-esteem, showing direct and indirect effects on academic performance.19
Well-being is commonly defined as the optimal functioning that enables an individual to live an effective life and to accomplish satisfaction in life and genuine happiness.20 It has been found to be inversely related to perceived stress in students,21 meaning that students show decreased well-being in high stress periods, whereby poor well-being also has a negative effect on health.22 Sugiura et al21 have shown that well-being has a protective role in the relationship between stress and health. To avoid any stress-induced health complaints in AS periods, well-being can be seen as a resource of mental health, which should be obtained even in phases of high stress.
The impact of positive affect (PA) and negative affect (NA; or mood in common) is an important aspect of health behavior changes (ie, to change or maintain the healthy behavior even in times of high stress).23 Therefore, in an AS situation, changes in health behavior are often coupled with changes in affectivity, with a progression from positive affectivity to a negative one. Studies have shown that high levels of PA are positively correlated to desirable health behaviors such as nutrition or drug avoidance in low stress situations and therefore should be maintained in high stress periods.24 As opposed to this, this pattern changes in phases with high stress, showing significant increases in NA as well as decreases in PA and health-related outcomes (ie, depression, psychosomatic symptoms and chronic difficulties).25 Therefore, a temporally stable PA disposition may be related to adaptive health behaviors in AS periods.26
Taken together, it is well known that sleep quality, well-being and affectivity are negatively affected by stress and that their deterioration has negative impacts on general health. It needs to be asked, however, how healthy students in AS periods can counteract these negative effects of stress on health. Although there is evidence that physical activity and exercise (as part of behavioral activation interventions) can alleviate symptoms of depression,26 bipolar spectrum symptomatology27 or mood disorders28 in clinical student samples, less is known about their influence in healthy student populations. A meta-analysis conducted by Regehr et al29 found several interventions to counteract these negative implications. These authors stated that interventions can be divided into three subgroups, cognitive, behavioral and/or mindfulness-based techniques. Most of the studies found a positive effect of interventions on physiological and psychological stress parameters (eg, anxiety, depressive symptoms and well-being). However, it is surprising that physical activity does not appear as an intervention method in this review, as it is commonly known to positively affect physiological (ie, the cardiovascular system)30 and psychological health (ie, cognitive functions).31 Moreover, its positive effect on health-related outcomes in stressful situations is commonly known. The stress-buffering hypothesis, which was derived from the assumption of Cohen and Willis,32 who found social support to protect individuals from potentially pathogenetic effects of stress, is one of the most discussed assumptions on how physical activity might influence the stress-coping system. This hypothesis postulates that physical activity (which is hereafter used as a hypernym, including all exercise activities and activities with exercise character such as bicycling) might act as a moderator of the stress–health relationship by reducing the detrimental effects of stress on physical and mental health and therefore can buffer the negative effects of stress on health.33,34 This hypothesis has been verified in many studies for acute activity35 as well as for habitual, regular activity.33
Based on these findings, the present study was conducted to shed light on the question whether those students, who are regularly physically active, have higher sleep quality, higher well-being and higher PA in AS periods than those who do not. In the present study, the regular examination period at the end of each semester therefore serves as a naturalistic stressor for studying the effects of stress on health outcomes. In particular, it is hypothesized that 1) sleep quality, well-being and PA decrease (NA increases) over time from baseline to AS period in all subjects. Moreover, it is assumed that 2) physically active students – while progressing from baseline to AS period – show better sleep quality, higher well-being and more positive and less negative affectivity than their inactive counterparts. This would confirm the stress-buffering effect of physical activity among healthy students in a naturalistic stress setting for the first time.
Methods
Participants
A total of 64 university students (Mage = 23.13 ± 5.12 years, 67% women) volunteered in the current study. Participation was voluntary and could be discontinued at every point without any disadvantages. Since the current study involved only a survey and the obtained information from the participants was recorded pseudonymized in a manner that human subjects cannot be identified and/or linked to the specific data, this study was exempted from obtaining informed consent prior to questioning. Nevertheless, this study complies with the Declaration of Helsinki36 and the Belmont Report37 in its entirety.
Although participants enrolled in different faculties, most of them were psychology students (88%). They, however, were able to gain participation credits by providing their code after study termination.
Task and procedure
Participants completed a total of five surveys, with T1 at the end of the semester break, which lasted from the end of July until mid October (serving as baseline condition, as it is hypothesized that this is the most unstressful time in the semester), and T2–T5 being presented every Friday in the last 4 weeks of the semester, representing the stressful examination period. T1 and T5 slightly differed from T2, T3 and T4, as additional data were acquired. In total, five different measurements were used in this study: the total amount of physical activity per week as well as sleep quality, well-being, affect and perceived stress.
Physical activity
Physical activitity was assessed using the German Physical Activity, Exercise, and Sport Questionnaire ([Bewegungs- und Sportaktivität Fragebogen]; BSA-F).38 Participants were instructed to name the number of different exercise activities they participated during the last week and to indicate the frequency and duration of each episode in minutes for every activity. The latter amounts were added up to obtain a total activity index in minutes per week.
Sleep quality
To assess sleep quality of participants, the German version of the Pittsburgh Sleep Quality Index (PSQI) was used.39,40 Subjects were asked to answer a total of 19 questions, assessing a wide variety of factors relating to sleep quality, including estimates of sleep duration and latency as well as the frequency and severity of specific sleep-related problems they possibly perceived over the last 7 days. These 19 items were grouped into seven component scores, each weighted on a 0–3 scale. These seven components were then summed to yield a global PSQI score, which had a range of 0–21, with higher scores indicating poorer sleep quality. A score worse (ie, higher) than “5” is an empirically validated cutoff value for bad sleep quality.39
Well-being
For the acquisition of interindividual well-being, the German Questionnaire for Assessing Subjective Physical Well-Being ([Fragebogen zur Erfassung des körperlichen Wohlbefindens]; FEW-16) was applied.41 Here, participants had to answer 16 questions, each loading on one of the four subscales (resilience, vitality, ease of mind and ability of enjoyment). Answers were coded from 1 (strongly disagree) to 6 (strongly agree), resulting in a total sum score of well-being between 16 and 96.
Positive and negative affect
To ascertain positive and negative affectivity in participants, the Positive and Negative Affect Schedule (PANAS) was used.42,43 Here, subjects had to rate a total of 24 adjectives on a 5-point Likert scale from 1 (very slightly or not at all) to 5 (extremely), depending on the intensity they felt like this in the last week. Examples were “interested” for PA or “upset” for NA. Ten items could be summarized to a score for positive and negative affectivity, respectively, ranging from 12 to 60.
Perceived stress
To determine the extent to which students perceived their life to be stressful, the 14 items from the Perceived Stress Scale (PSS) were used.44 Participants were instructed to indicate how often they encountered stressful events within the last week. Responses were given on a 5-point Likert scale ranging from 0 (never) to 4 (very often). Participants could reach a total sum score ranging from 0 to 56.
Results
A preliminary manipulation check was performed in order to examine whether students indeed perceived the AS phase as a real-life stressor. The empirical mean stress scores of the PSS measured within the AS phase (ie, within times T2–T5) showed pronounced medium to large differences from the baseline measurement at T1, indicating support for this assumption (Figure 1).
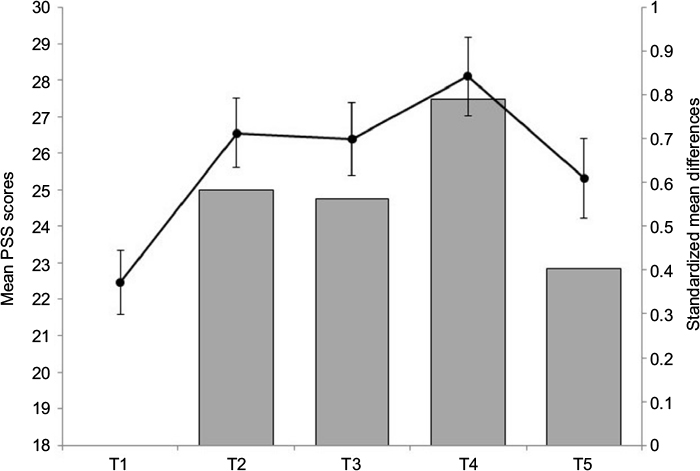 | Figure 1 PSS scores and standardized mean differences for every measurement occasion, from baseline (T1) throughout the examination period (T2-T5). Notes: Line graph displays mean scale scores of perceived stress with error bars representing 95% confidence intervals. The vertical bars show the standardized difference between the mean scores of measurement occasions compared to baseline at T1. Abbreviation: PSS, Perceived Stress Scale. |
Table 1 shows the mean scores for each dependent variable. It can be seen, however, that overall sleep quality, well-being and PA decrease until T4, which is the point in time where most examinations took place. In the week between T4 and T5, 89% of participants completed their examinations. However, for some students, some examinations took place after T5 as well, but the overall (mental) health started to increase again from T4 onward. Positive affectivity, however, was actually even higher at T5 than at the end of the semester break (T1), probably resulting from the fall of the enormous weight of writing examinations.
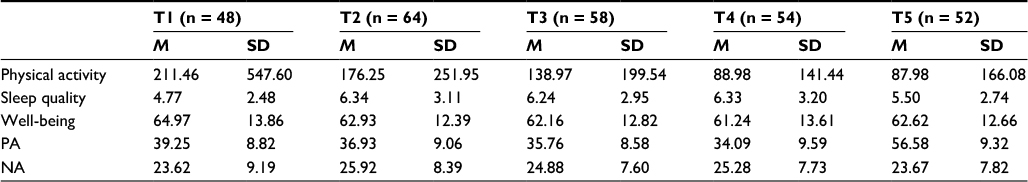 | Table 1 Mean scores (M) and SD values for the four dependent variables, as well as for physical activity on all five measurement occasions Abbreviations: SD, standard deviation; PA, positive affect; NA, negative affect. |
Subsequently, to test our hypotheses, we generated and tested a series of multilevel growth curve models using HLM 7.45 Since hypothesis 1 builds on the basic assumption that students exhibit change (ie, deterioration) in their sleep quality, (positive) affectivity and well-being over the course of the examination period, separate unconditional growth models were constructed to examine this change over time.46 Preliminary analyses revealed that a second-order quadratic change trajectory, including two time predictors (ie, a linear and a quadratic one), yielded the best model fit for all dependent variables. For every model, the time predictor was centered at the initial status. Accordingly, the models tested were as follows:
|
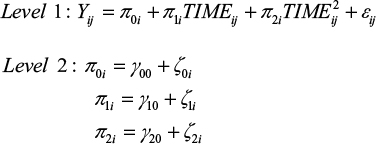
The level 1 component represents the individual growth model that defines the value of the dependent variable of every individual as a function of a systematic growth parameter plus random error. Up to this point, the level 1 model is very similar to a typical regression model, but the growth parameters are assumed to randomly vary across individuals, what is represented by residual terms of level 2. This specification of level 1 and level 2 components is called an unconditional growth model because it involves no substantive predictor variables beyond the ones capturing change over time (ie, TIME and TIME2). Accordingly, this model can be used to test hypothesis 1. Table 2 summarizes the results for the unconditional growth model for every dependent variable.
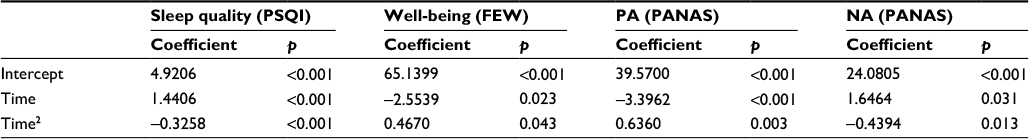 | Table 2 Results of the unconditional growth models for the four dependent variables Abbreviations: PSQI, Pittsburgh Sleep Quality Index; FEW, Fragebogen zur Erfassung des Wohlbefindens; PA, positive affect; NA, negative affect; PANAS, Positive and Negative Affect Schedule. |
Hypothesis 1 was confirmed for every dependent variable, as the coefficients associated with the TIME predictors are all significant and indicate a worsening of sleep quality, well-being and affectivity. However, these initial negative effects diminish over time, as indicated by the TIME2 coefficient. Therefore, the curves reach their angular points at some points in time, with values of dependent variables approaching baseline levels again.
In a next step, we analyzed whether this change over time is the same for all participants or whether there are differences between participants regarding their levels of physical activity. To test for this prediction associated with hypothesis 2, conditional growth models were set up for each dependent variable, including physical activity as a time-varying predictor at level 1. Since both a predictor that incorporates the main effect of physical activity and a predictor that represents the interaction between time and activity were included, the tested model extended to:
|
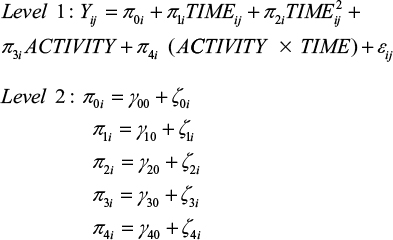
Note that the main effect presents a direct effect of physical activity (ie, students differ in the health-related variables as a function of physical activity) and that the interaction term implies the assumption associated with the stress-buffering hypothesis (ie, different patterns of change within the examination period as a function of physical activity).
When comparing level 1 error variance between the unconditional growth model and the subsequent conditional growth model, it can be concluded that the within-individual variance associated with differences in physical activity for every dependent measure is not negligible (ie, 6% for sleep quality, 19% for well-being, 18% for PA and 7% for NA). Results of the four conditional growth models are shown in Table 3.
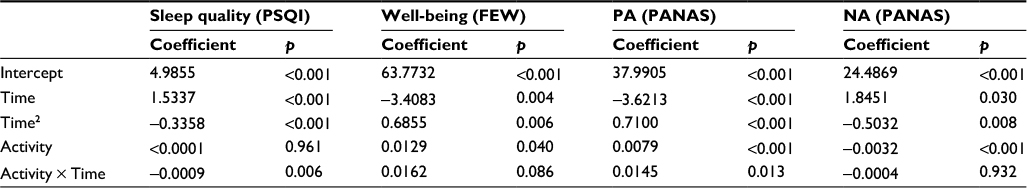 | Table 3 Results of the conditional growth models for the four dependent variables Abbreviations: PSQI, Pittsburgh Sleep Quality Index; FEW, Fragebogen zur Erfassung des Wohlbefindens; PA, positive affect; NA, negative affect; PANAS, Positive and Negative Affect Schedule. |
Examining the regression coefficients for sleep quality in the conditional model, no significant main effect for physical activity, t(63) = 0.049, p = 0.961, could be detected, but a significant interaction between physical activity and time, t(63) = −2.851, p < 0.01, indicating different patterns of change in sleep quality over time depending on one’s activity level was observed (Table 2).
For well-being, the conditional growth model revealed a significant main effect for physical activity, t(63) = 2.095, p < 0.05, indicating that physically active students feel better in general (Table 2). Moreover, the interaction between physical activity and time is significant by trend, t(63) = 1.743, p = 0.086.
Regarding affectivity, physical activity provoked different effects for PA and NA (Table 2). For PA, results showed both, a significant main effect for physical activity, t(63) = 4.164, p < 0.001, and a significant interaction, t(63) = 2.555, p < 0.05. For NA, only the main effect yielded significance, t(63) = −4.763, p < 0.001, but not the interaction between time and activity, t(63) = −0.111, p = 0.912.
Discussion
The first goal of the present study was to assess changes in health-related outcomes (sleep quality, well-being and affectivity) as students progress from stress-free times to more stressful times of their semester. Results confirm the first hypothesis showing a significant deterioration of sleep quality, well-being and PA over time from baseline to the end of the AS period. Moreover, concerning hypothesis 2, results also demonstrate how these changes are shaped as a function of physical activity. To illustrate this influence, the regression coefficients were used to determine estimated trajectories for three prototypical activity levels based on common classifications of the World Health Organization (WHO):47 1) highly active students who indicate at least 300 minutes of moderate intensity activity per week, 2) moderately active students with a reported amount of moderate intensity activity up to 150 minutes per week and 3) sedentary students who are not active at all (Figure 2).
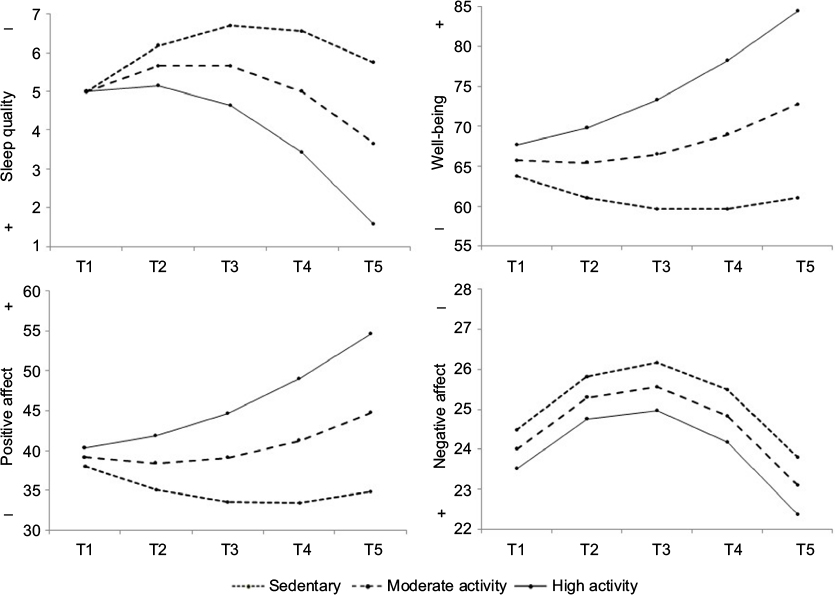 | Figure 2 Estimated pattern of change in sedentary, moderate and high physical activity levels for sleep quality, subjective well-being, PA and NA. Abbreviations: PA, positive affect; NA, negative affect. |
These classifications are considered prototypes since they build on the assumption of a constant amount of physical activity over all measurement occasions. Since studying and taking exams are very time-consuming for many students, these classifications are neither likely nor supported by the empirical data. Indeed, we found physical activity to decrease continuously over the measurement occasions in our data set (from an average amount of physical activity of 211 minutes at T1 to 88 minutes at T5). Such changes in the amount of physical activity would appear in Figure 2 as a discontinuous shift. For example, imagine a student who engages in 300 minutes of physical activity at the baseline measurement (T1). This would lead to an estimated value of 5.00 in sleep quality. Over the course of the semester, he manages to maintain his level of physical activity until T2 (estimated value: 5.15). Accordingly, he would follow the solid line (high activity) and exhibit only minor deterioration in sleep quality until then. If this student now entirely stops being physically active, his sleep quality would shift and follow the dotted line in Figure 2 afterward (sedentary; T3 = 6.70; T4 = 6.56; T5 = 5.75).
For all dependent variables, results are discussed in more detail in the following section.
Concerning sleep quality, highly active, moderately active and sedentary students did not differ at baseline (T1). However, overall sleep quality was rather poor in all students over all 5 points of measurement (M = 5.89, SD = 2.96; Table 1), given that Buysse et al39 proposed a cutoff at 5 points, with a higher score indicating bad sleep quality. However, the fact that no main effect of weekly physical activity on sleep quality could be detected in this study is contradictory to the results of studies on the effect of acute physical activity on sleep in healthy subjects. Youngstedt et al47 found in a meta-analysis that acute physical activity showed a positive impact on total sleep time, deep sleep and rapid eye movement (REM) sleep and therefore had a positive impact on sleep quality in total. Kredlow et al48 confirmed these results in a recent meta-analysis as they found a longer sleep duration, shorter latency and better deep sleep as a result of acute physical activity. In a 3-week intervention of aerobic exercise training, Kalak et al49 also found positive effects of acute physical activity on subjective sleep quality. However, this does not seem to be the case in our study, which may be due to the fact that students are also more stressed and have lower sleep quality in the semester break, as they need to work or do an internship and/or write academic project papers, so that physical activity loses its positive effect due to higher stress levels.
Moreover, a systematic review on the influence of physical activity on sleep insomnia (as sometimes caused by stress phases such as AS periods) showed a significant reduction in sleep latency and drug use in physically active people suffering from insomnia.50 In this population, a randomized controlled trial on the effect of acute activity (for at least 150 minutes per week, as advised by the WHO)51 also indicated a significant improvement in sleep quality and a decrease in insomnia symptoms, depressive symptoms and anxiety.52 The present study confirmed these findings, as physical activity had a positive effect on sleep quality during the AS period, which is shown to deteriorate sleep patterns in students.53
It is known that stress negatively affects well-being in students.54 This finding was replicated by the present results as impaired well-being was detected in students in more stressful times during the AS phase. Moreover, many large-scale studies have shown the positive effect of physical activity on well-being (eg, the Scottish Health Survey55 or the Copenhagen Heart Study56), which was confirmed by the main effect in the present study. Students who are more physically active feel generally better than those who are not active at all. However, as there was no interaction found in the present study, this pattern did not change in AS periods.
Whereas NA is accepted to predict increased risk of illness and mortality, PA is associated with lower morbidity and decreased symptoms.57,58 It is known that AS periods have a negative impact on affective state with NA increased and PA decreased during times of high academic demands,24 which was replicated in the present findings. However, there is extensive evidence for the proposition that physical activity or exercise is associated with enhanced affect and mood59 and therefore can buffer the negative effects of stress on affectivity. More active students have higher PA and lower NA than inactive students, as signified by the results of the present study. Moreover, it was shown in previous studies that PA predicts academic performance.60,61 In this vein, physical activity during the examination period might also have an effect on academic performance, albeit an indirect one. There are many studies providing evidence for the positive effects of physical activity on student performance in school.62 However, there is a lack of evidence for this relationship in university students. Therefore, future research should aim at examining whether these positive effects do also emerge in AS periods and whether they are a direct effect of physical activity, or whether they are mediated by an increase in positive affectivity or other health-related variables.
The major strengths of this study include the longitudinal design and the usage of AS as a naturalistic stressor. However, the inclusion of only one baseline measure may have been inadequate. For future studies, it may be of interest to include more than one baseline measure in times of little stress to determine if there is any variability in the dependent variables outside of high stress times. External validity of the results should be limited to the specific nature of the sample, as mostly psychology students participated. Results of the present study point to the importance of physical activity in AS periods. Therefore, it can be assumed that the results can provide the basis for activity interventions, which can be offered to students in AS periods to help them maintain their activity levels to buffer the negative effects of stress on health. Another limitation of the present study is that only self-report measures were used. In terms of the activity measure, this might have led to an erroneous assessment of the actual amount of physical activity due to social desirable responding. In this vein, a study conducted by Dyrstad et al revealed that people tend to overestimate their activity time ascertained via self-report measures when compared to accelerometer data.63 However, participants of the present study reported decreasing amounts of activity during the AS phase. Therefore, the potential overestimation of physical activity time might only be present as an additive shift that might not lead to a distorted representation of the process modeled within the AS period. However, future studies might use more objective measures, such as accelerometers, for effective activity time and the intensity of the given activity. In this regard, intensity levels or metabolic equivalents (METs) of physical activity could play an important role. It might be that either the intensity of activities per se or the kind of activity moderates the described effects.
Moreover, there are still significant variance components for every conditional model, within both the intercepts and the slopes, that call for additional moderating variables to explain this variability. Owing to personality factors of participants or organizational or cultural conditions, it may be that students have the same amount of stress but cope differently and therefore differ in their perceived amount of stress, as proposed in the transactional theory.64 Therefore, future studies should examine time-invariant variables, such as organizational skills, coping style, year in college, difficulty of classes, number of credits taken in the semester, other academic pursuits, outside academic responsibilities and personality or organizational culture within different faculties, which can then be integrated on level 2 in the described model. Moreover, additional health-related variables should be included in the following examinations, such as diet, smoking status and drug abuse.
Taken together, the results of the present study suggest a positive effect of physical activity on sleep quality, well-being and affect in AS periods. This effect, however, seems to depend on the total amount of activity made within the stress period. Therefore, it should be students’ goal to maintain their physical activity levels (or even to start exercising) in times with high (academic) stress. Moderate intensity activity of 150 minutes/week seems to be enough to profit from the stress-buffering and health-promoting effects. It needs to be asked, however, if an amount of 150 minutes of moderate intensity activity per week is really reconcilable with the imminent work load within the AS phase. If an average student gets lectures for 6–8 hours a day, studies for another 6–8 hours for exams and may need to go to work to fund his studying, it is hardly surprising that students save time by decreasing their activity times. Consequently, future studies should aim at examining possible moderators such as students’ time management and non-university workload.
Acknowledgment
This article was funded by the German Research Foundation (DFG) and the University of Freiburg through the funding program Open Access Publishing.
Disclosure
The authors report no conflicts of interest in this work.
References
Misra R, McKean M. College students’ academic stress and its relation to their anxiety, time management, and leisure satisfaction. AM J Health Stud. 2000;16:41–51. | ||
Abouserie R. Sources and levels of stress in relation to locus of control and self-esteem in university students. Educ Psychol UK. 1994;14:323–330. | ||
Archer J, Lamnin A. An investigation of personal and academic stressors on college campuses. J Coll St Personnel. 1985;26:210–215. | ||
Britton BK, Tesser A. Effects of time-management practices on college grades. J Educ Psychol. 1991;83:405–410. | ||
Kohn JP, Frazer GH. An academic stress scale: identification and rated importance of academic stressors. Psychol Rep. 1986;59:415–426. | ||
Zunhammer M, Eberle H, Eichhammer P, Busch V. Somatic symptoms evoked by exam stress in university students: the role of alexithymia, neuroticism, anxiety and depression. PLoS One. 2013;8(12):e84911. | ||
Segerstrom SC, Miller GE. Psychological stress and the human immune system. A meta-analytic study of 30 years of inquiry. Psychol Bull. 2004;130(4):601–630. | ||
Malarkey WB, Pearl DK, Demers LM, Kiecolt-Glaser JK, Glaser R. Influence of academic stress and season on 24-hour mean concentrations of ACTH, Cortisol, and ß-endorphin. Psychoneuroendocrinology. 1995;29:499–508. | ||
Putwain D. Researching academic stress and anxiety in students: some methodological considerations. Br Educ Res J. 2007;33:207–219. | ||
Lund HG, Reider BD, Whiting AB, Prichard JR. Sleep patterns and predictors of disturbed sleep in a large population of college students. J Adolescent Health. 2010;46(2):124–132. | ||
Edwards JR, Rothbard NP. Work and family stress and well-being: an examination of person-environment fit in the work and family domains. Organ Behav Hum Decis Process. 1999;77(2):85–129. | ||
Watson D, Pennebaker JW. Health complaints, stress, and distress: exploring the central role of negative affectivity. Psychol Rev. 1989;96(2):234–254. | ||
Dyrbye LN, Thomas MR, Shanafelt MD. Systematic review of depression, anxiety, and other indicators of psychological distress among U.S. and Canadian medical students. Acad Med. 2006;81(4):354–373. | ||
Dahlgren A, Kecklund G, Åkerstedt T. Different levels of work-related stress and the effects on sleep, fatigue and cortisol. Scand J Work Environ Health. 2005;31(4):277–285. | ||
Meerlo P, Sgoifo A, Suchecki D. Restricted and disrupted sleep: effects on autonomic function, neuroendocrine stress systems and stress responsivity. Sleep Med Rev. 2008;12(3):97–210. | ||
Sadeh A, Keinan G, Daon K. Effects of stress on sleep: the moderating role of coping style. Health Psychol. 2004;23:542–545. | ||
Bassett SM, Lupis SB, Gianferante D, Rohleder N, Wolf JM. Sleep quality but not sleep quantity effect on cortisol responses to acute psychosocial stress. Stress. 2015;18:638–644. | ||
Minkel J, Moreta M, Muto J, et al. Sleep deprivation potentiates HPA axis stress reactivity in healthy adults. Health Psychol. 2014;33(11):1430–1434. | ||
Wong ML, Lau EYY, Wan JHY, Cheung SF, Hui CH, Mok DSY. The interplay between sleep and mood in predicting academic functioning, physical health and psychological health: a longitudinal study. J Psychosom Res. 2013;74(4):271–277. | ||
Seligman MEP. Authentic Happiness. New York, NY: The Free Press; 1993. | ||
Sugiura G, Shinada K, Kawaguchi Y. Psychological well-being and perceptions of stress amongst Japanese dental students. Eur J Dent Educ. 2005;9(1):17–25. | ||
Heidrich SM. The relationship between physical health and psychological well-being in elderly women: a developmental perspective. Res Nurs Health. 1993;16(2):123–130. | ||
Schneiderman N, Ironson G, Siegel SD. Stress and health: psychological, behavioral, and biological determinants. Annu Rev Clin Psychol. 2005;1:607–628. | ||
Weidner G, Kohlmann CW, Dotzauer E, Burns LR. The effects of academic stress on health behaviors in young adults. Anxiety Stress Copi. 1996;9:123–133. | ||
Van Eck MMS, Berkhof HMS, Nicolson N, Sulon J. The effects of perceived stress, traits, mood states and stressful daily events on salivary cortisol. Psychosom Med. 1996;58(5):447–458. | ||
Gawrysiak M, Nicholas C, Hopko DR. Behavioral activation for moderately depressed university students: randomized controlled trial. J Counsel Psychol. 2009;56:468–475. | ||
Meyer B, Johnson SL, Carver CS. Exploring behavioral activation and inhibition sensitivities among college students at risk for bipolar spectrum symptomatology. J Psychopathol Behav Assess. 1999;21(4):275–292. | ||
Harmon-Jones E, Allen JJ. Behavioral activation sensitivity and resting frontal EEG asymmetry: covariation of putative indicators related to risk for mood disorders. J Abnorm Psychol. 1997;106(1):159–163. | ||
Regehr C, Glancy D, Pitts A. Interventions to reduce stress in university students: a review and meta-analysis. J Affect Disord. 2013;148(1):1–11. | ||
Whelton SP, Chin A, Xin X, He J. Effect of aerobic exercise on blood pressure: a meta-analysis of randomized, controlled trials. Ann Intern Med. 2002;136(7):493–503. | ||
Hillman CH, Erickson KI, Kramer AF. Be smart, exercise your heart: exercise effects on brain and cognition. Nat Rev Neurosci. 2008;9(1):58–65. | ||
Cohen S, Willis TA. Stress, social support, and the buffering hypothesis. Psychol Bull. 1985;98:310–357. | ||
Gerber M, Pühse U. Do exercise and fitness protect against stress-induced health complaints? A review of literature. Scand J Pub Health. 2009;37:801–819. | ||
Tsatsoulis A, Fountoulakis S. The protective role of exercise on stress system dysregulation and comorbidities. Ann N Y Acad Sci. 2006;1083:196–213. | ||
Hamer M, Taylor A, Steptoe A. The effect of acute aerobic exercise on stress related blood pressure responses: a systematic review and meta-analysis. Biol Psychol. 2006;71(2):183–190. | ||
World Medical Association. Declaration of Helsinki: ethical principles for medical research involving human subjects. JAMA. 2013;310:2191–2194. | ||
The National Commission for the Protection of Human Subjects of Biomedical and Behavioral Research. The Belmont Report: Ethical Principles and Guidelines for the Protection of Human Subjects of Research. Bethesda, MD: The National Commission for the Protection of Human Subjects of Biomedical and Behavioral Research; 1978. | ||
Fuchs R, Klaperski S, Gerber M, Seelig H. Messung der Bewegungs- und Sportaktivität mit dem BSA-Fragebogen. Eine methodische Zwischenbilanz. [Measurement of Physical Activity and Sport Activity with the BSA Questionnaire]. Z Gesundh. 2015;23:60–76. German. | ||
Buysse DJ, Reynolds CF 3rd, Monk TH, Berman SR, Kupfer DJ. The Pittsburgh Sleep Quality Index: a new instrument for psychiatric practice and research. Psychiatry Res. 1988;28(2):193–213. | ||
Riemann D, Backhaus J. Behandlung von Schlafstörungen. [Treatment of sleep disturbances]. Weinheim: Psychologie Verlags Union; 1996. German. | ||
Kolip P, Schmidt B. Fragebogen zur Erfassung des körperlichen Wohlbefindens (FEW 16). [Questionnaire for assessing subjective physical well-being (FEW 16)]. Z Gesundh. 1999;7:77–87. German. | ||
Watson D, Clark LA, Tellegen A. Development and validation of brief measures of positive and negative affect: the PANAS scales. J Pers Soc Psychol. 1988;54(6):1063–1070. | ||
Krohne HW, Egloff B, Kohlmann C-W, Tausch A. Untersuchungen mit einer deutschen Version der “positive and negative affect schedule” (PANAS). [Investigations with a German version of the positive and negative affect schedule (PANAS)]. Diagnostica. 1996;42:139–156. German. | ||
Cohen S, Kamarck T, Mermelstein R. A global measure of psychological stress. J Health Soc Behav. 1983;24:385–396. | ||
Raudenbush SW, Bryk AS, Congdon R. HLM 7.00 for Windows [Computer software]. Lincolnwood, IL: Scientific Software International, Inc; 2011. | ||
Singer JD, Willett JB. Applied Longitudinal Data Analysis: Modeling Change and Event Occurrence. Oxford: Oxford University Press; 2003. | ||
Youngstedt SD, O’Connor PJ, Dishman RK. The effects of acute exercise on sleep: a quantitative synthesis. Sleep. 1997;20(3):203–214. | ||
Kredlow MA, Capozzoli MS, Hearon BA, Calkins AW, Otto MW. The effects of physical activity on sleep: a meta-analytic review. J Behav Med. 2015;38:427–449. | ||
Kalak N, Gerber M, Kirov R, et al. Daily morning running for 3 weeks improved sleep and psychological functioning in healthy adolescents compared with controls. J Adolesc Health. 2012;51(6):615–622. | ||
Yang PY, Ho KH, Chen HC, Chien MY. Exercise training improves sleep quality in middle-aged and older adults with sleep problems: a systematic review. J Physiother. 2012;58(3):157–163. | ||
World Health Organization (WHO). Global Recommendations on Physical Activity for Health; 2011. Available from: http://www.who.int/dietphysicalactivity/physical-activity-recommendations-18-64years.pdf. Accessed March, 2017. | ||
Hartescu I, Morgan K, Stevinson CD. Increased physical activity improves sleep and mood outcomes in inactive people with insomnia: a randomized controlled trial. J Sleep Res. 2015;24(5):526–534. | ||
Oaten M, Cheng K. Academic examination stress impairs self-control. J Soc Clin Psychol. 2005;24:254–279. | ||
Cotton SJ, Dollard MF, de Jonge J. Stress and student job design: satisfaction, well-being, and performance in university students. Int J Stress Manage. 2002;9:147–162. | ||
Dong W, Erens B, editors. Scottish Health Survey 1995 Volume 1. Edinburgh: The Stationery Office; 1997. | ||
Schnohr P, Kristensen TS, Prescott E, Scharling H. Stress and life dissatisfaction are inversely associated with jogging and other types of physical activity in leisure time – The Copenhagen City Heart Study. Scand J Med Sci Sports. 2005;15:107–112. | ||
Cohen S, Pressman S. Positive affect and health. Curr Dir Psychol Sci. 2006;15:122–125. | ||
Pressman S, Cohen S. Does positive affect influence health? Psychol Bull. 2005;131:925–971. | ||
Biddle SJH, Mutrie N. Psychology of Physical Activity. London: Routledge; 2001. | ||
Nickerson C, Diener ED, Schwarz N. Positive affect and college success. J Happinness Stud. 2010;12:717–746. | ||
Saklofske DH, Austin EJ, Mastoras SM, Beaton L, Osborne SE. Relationships of personality, affect, emotional intelligence and coping with student stress and academic success: different patterns of association for stress and success. Learn Individ Differ. 2011;22:251–257. | ||
Taras H. Physical activity and student performance in school. J School Health. 2005;75:214–218. | ||
Dyrstad SM, Hansen BH, Holme IM, Anderssen SA. Comparison of self-reported versus accelerometer-measured physical activity. Med Sci Sport Exer. 2013;46:99–106. | ||
Lazarus RS, Folkman S. Transactional theory and research on emotions and coping. Eur J Pers. 1987;1:141–169. |
 © 2017 The Author(s). This work is published and licensed by Dove Medical Press Limited. The full terms of this license are available at https://www.dovepress.com/terms.php and incorporate the Creative Commons Attribution - Non Commercial (unported, v3.0) License.
By accessing the work you hereby accept the Terms. Non-commercial uses of the work are permitted without any further permission from Dove Medical Press Limited, provided the work is properly attributed. For permission for commercial use of this work, please see paragraphs 4.2 and 5 of our Terms.
© 2017 The Author(s). This work is published and licensed by Dove Medical Press Limited. The full terms of this license are available at https://www.dovepress.com/terms.php and incorporate the Creative Commons Attribution - Non Commercial (unported, v3.0) License.
By accessing the work you hereby accept the Terms. Non-commercial uses of the work are permitted without any further permission from Dove Medical Press Limited, provided the work is properly attributed. For permission for commercial use of this work, please see paragraphs 4.2 and 5 of our Terms.