")
Back to Journals » Diabetes, Metabolic Syndrome and Obesity » Volume 13
Artemether Regulates Metaflammation to Improve Glycolipid Metabolism in db/db Mice
Authors Fu W , Ma Y , Li L, Liu J, Fu L, Guo Y, Zhang Z, Li J , Jiang H
Received 2 December 2019
Accepted for publication 17 April 2020
Published 19 May 2020 Volume 2020:13 Pages 1703—1713
DOI https://doi.org/10.2147/DMSO.S240786
Checked for plagiarism Yes
Review by Single anonymous peer review
Peer reviewer comments 2
Editor who approved publication: Prof. Dr. Antonio Brunetti
Wei Fu,1– 3 Yujin Ma,1– 3 Liping Li,1– 3 Jie Liu,1– 3 Liujun Fu,1– 3 Yu Guo,1– 3 Zhiyin Zhang,1– 3 Jiaxi Li,1– 3 Hongwei Jiang1– 3
1Department of Endocrinology, The First Affiliated Hospital and Clinical Medicine College, Henan University of Science and Technology, Luoyang 471003, People’s Republic of China; 2National Center for Clinical Research of Metabolic Diseases, Luoyang Center for Endocrinology and Metabolism, Luoyang 471003, People’s Republic of China; 3Diabetic Nephropathy Academician Workstation of Henan Province, Luoyang 471003, People’s Republic of China
Correspondence: Hongwei Jiang
Endocrinology Department, The First Affiliated Hospital and Clinical Medicine College, Henan University of Science and Technology, Luoyang 471003, People’s Republic of China
Tel +86 13653880139
Email [email protected]
Background: Artemether, a commonly used artemisinin derivative, has been shown to possess potential antidiabetic activities. However, only limited information is available on the mechanisms of artemether in type 2 diabetes. Therefore, in this study, we examined some of the possible mechanisms of artemether (ATM) upon glycolipid metabolism in the db/db mouse model of diabetes.
Materials and Methods: Male C57BL/KsJ-db/db and C57BL/KsJ-db/+ mice at 4 weeks of age were divided into four groups (N=6/group): (1) NC (normal control – db/+ mice, 1% methylcellulose, intragastric administration), (2) DM (diabetic model – db/db mice, 1% methylcellulose, intragastric administration), (3) ATM 100 (DM + 100 mg/kg of artemether) and (4) ATM 200 (DM + 200 mg/kg of artemether). A number of assays related to diabetes were then performed following a 4-week period of these treatments.
Results: Artemether at both doses significantly reduced rates of weight gain and fasting blood glucose levels, improved islet function and insulin resistance and reduced serum lipid levels to varying degrees in db/db mice. Artemether exerted a positive effect on islet vacuolar degeneration and hepatic steatosis, and increased expressions of AMP-activated protein kinase, glucose transporter 4 and Insulin receptor β protein in the liver of these db/db mice. With the use of liver protein chip detection, we found that artemether significantly improved the immune microenvironment, down-regulated the expression of inflammatory factors and activated the cytokine-mediated signaling pathway through cytokine–cytokine receptor interactions.
Conclusion: Artemether may regulate glycolipid metabolism in db/db mice by improving the immune microenvironment. The results of this study provide important new information that can serve as the foundation for future research into the use of artemether as a means to improve glycolipid metabolism.
Keywords: artemether, glycolipid metabolism, immune microenvironment, AMPK, type 2 diabetes
Introduction
Type 2 diabetes, which represents the most common form of diabetes, is a metabolic disorder characterized by alterations in carbohydrate, protein, and fat metabolism resulting from insulin resistance.1 In particular, the liver plays an important role as a vital insulin target through its ability to maintain systemic blood glucose homeostasis.2 A number of oral antidiabetic drugs are currently available for the treatment of type 2 diabetes, including sulfonylureas, thiazolidinediones, biguanides, alpha-glucosidase inhibitors, and dipeptidyl peptidase-IV inhibitors; however, the side effects and secondary treatment failure rates associated with some of these agents limit their effectiveness.3 Therefore, there is a growing interest in the identification of natural products, especially those of Chinese herbal medicines, that could be applied in the treatment of this disorder.4
Artemisinin, a naturally occurring sesquiterpene endoperoxide lactone found in medicinal plants, has been extracted and manufactured for decades for use in the treatment of malaria.5 It also has been shown to possess anti-tumor potential in clinical applications,6 anti-fungal, anti-infective and immunomodulatory effects7,8 and may have great potential as an anti-inflammatory agent through its capacity to activate NF-κB and MAPK, as well as other pathways.9,10 The ability for artemisinin to interact with non-heme, as well as many other types of proteins, provides some explanation for the variety of these effects. Some of the common derivatives of artemisinin include dihydroartemisinin (DHA), artemether (ATM), artesunate and arteether.11
Recent evidence has indicated that artemisinin also shows potential therapeutic effects in glucose and lipid metabolism disorders. For example, artemisinin drugs can exert antioxidant activity and anti-hyperlipidemic effects in Streptozotocin-induced diabetic Sprague–Dawley rats and can lower blood glucose levels and improve liver and kidney functions.12,13 The artemisinin derivative, ATM, can convert white fat as induced by high-fat diets to brown fat, thereby improving lipid metabolism in obese mice, and an artemisia extract can alleviate insulin resistance and fatty liver in mice as induced by high-fat diets. Moreover, artemisinin can reduce liver steatosis and inflammatory responses.14,15 There are also studies that indicate that artemisinin has the potential to improve type 1 diabetes. Specifically, artemisinin can promote the conversion of pancreatic glucagon-producing α cells to rat insulin-secreting β cells. In the process of improving glucose homeostasis, artemisinin binds to the molybdenum (Mo2C)-carrying gephyrin, activates gamma-aminobutyric acid A receptor (GABAAR) and inhibits aristaless related homeobox (ARX), eventually leading to enhanced β cell proliferation and enhanced insulin secretion.16 Surprisingly, there is a report that artemisinin had been used clinically in the treatment of diabetes over 20 years ago, with the results of this study showing that artemisinin alleviated the symptoms of hyperglycemia in diabetic patients with no reported side effects. However, in that study, the number of enrolled patients was only 15 and there were no follow-up reports on this effect.17
Based on the above findings, our team conducted an initial experiment with ATM using the db/db mouse model on the C57BL/KsJ background (C57BL/KsJ-db/db). This model is a well-established obese T2DM mouse model, originating from an autosomal recessive mutation in the leptin receptor, resulting in impaired signaling of leptin.18 As a result of this mutation, these mice show an initial bulimia and weight gain within their first month of age, followed by polydipsia and polyuria and obvious symptom characteristics of type 2 diabetes such as hyperglycemia, hyperlipemia and hyperinsulinemia. Accordingly, these mice provide an ideal model for conducting research on type 2 diabetes. The blank control group for this model was selected from normal mice (C57BL/KsJ-db/+) with the same genes in their maternal background.19 In this db/db mouse model, it was found that ATM was effective in producing anti-diabetic and anti-obesity effects and increased insulin secretion while decreasing islet cell apoptosis.20 Although this study, as well as other studies, has shown some salient beneficial effects of artemisinin in the treatment of diabetes,21 a number of issues regarding these effects need to be addressed. For example, in that study, the artemisinin intervention time was short, no dose–response therapeutic effects were tested, nor are molecular mechanisms involved with this modulation of glucose metabolism known. Therefore, the purpose of the present study was to examine the role and some of the mechanisms of artemisinin in improving glycolipid metabolism. Such information will be critical for the expansion and application prospects of this traditional Chinese medicine.
Materials and Methods
Drugs, Reagents and Assays
The main drugs and reagents used in these experiments included: Artemether (Purity 98%) and methylcellulose from DASF Bio-Tech Ltd (Nanjing, China), Assay kits primarily used to test cholesterol (TC), triglyceride (TG) and free fatty acid (FFA) from Nanjing Jiancheng Bio-Engineering Research Institute (Nanjing, China).
Antibodies for glucose transporter 4 (GLUT4), insulin receptor β (IR) and AMP-activated protein kinase (AMPK) from Abcam Biotechnology, Inc. (Abcam, UK), protein chip from Guangzhou RayBiotech Biotechnology Co., Ltd (Guangzhou, China), glucose (1.0 g/kg) from China Otsuka Pharmaceutical Co., Ltd and insulin (0.5 IU/kg) from Wanbang Biopharma.
Carrier production required that 1% methylcellulose, which was dissolved in distilled water, was heated to 80°C with stirring and then stored at 4°C. The artemether suspension in 1% methylcellulose was made on the day before treatment to ensure freshness.
Animal Grouping and Treatment
A total of 24 male mice (6–8 weeks of age) were used in these experiments: 18 C57BL/KsJ-db/db and 6 C57BL/KsJ-db/+ mice. The mice were housed under standard laboratory conditions of 23±1°C, relative humidity of 40–60% and a 12-h light/dark cycle. All mice were purchased from the Better Biotechnology Co., Ltd. (Nanjing, China). The animal care facilities and techniques for the Laboratory of the Clinical Medicine College of First Affiliated Hospital of Henan University of Science and Technology were approved for use in these experiments.
All mice were maintained under these laboratory conditions for 2 weeks prior to use in the experiment. The db/db mice were then randomly allocated to one of the three treatment groups for 4weeks (N = 6/group). The four groups comprising the experiment were:
1) Normal control: NC, db/+, 1% methylcellulose, intragastric administration,
2) Diabetes control: DM, db/db, 1% methylcellulose, intragastric administration,
3) ATM 100: DM + ATM 100 mg/kg artemether, intragastric administration and 4) ATM 200: DM + ATM, 200 mg/kg artemether, intragastric administration.
The dose of ATM was determined as based upon results from previous studies, the period of measuring body weight and water intake was 4 days, and the period of measuring food intake was 7 days. Upon completion of the 4-weeks of treatment, all mice were fasted for 12 h, anesthetized with ether, and blood collected for analysis. The liver and pancreas of the mice were then removed, rinsed immediately and stored in liquid nitrogen at −80°C for analysis.
Glucose and Insulin Tolerance Tests
Mice were required to fast overnight (12 h) prior to their intraperitoneal glucose tolerance test (IPGTT). Mice were then injected intraperitoneally with glucose and blood glucose levels in the tail vein were measured at 0, 15, 30, 60 and 120 min after administration. The intraperitoneal insulin tolerance test (IPITT) followed a similar procedure with the exception that the injection was insulin. The IPITT and IPGTT were performed on separate days.
Measurement of Blood Glucose and Serum Lipids
Mice were required to be fasted prior to assay using a blood glucose meter (Roche ACCU-CHEK, Germany), and fasting blood glucose levels were measured once a week. Mouse tail vein blood was collected for these samples, while whole blood was collected at the conclusion of the experiment, and serum was separated for further analysis. Serum TC and TG were measured using an automatic biochemical analyzer (Shenzhen Leidu Life Technology Co., Ltd.). Measurement of serum FFA was performed using an UV-Vis 752 spectrophotometer (Lengguang Optical Instrument, Shanghai, China).
Histopathology
Images of pancreatic sections were obtained with use of an optical microscope (OLYMPUS, Japan). To achieve this goal, the pancreas was first infiltrated with a 4% paraformaldehyde solution, fixed and embedded in paraffin for sectioning at 5 μm thickness. After the sections were applied onto a glass slide, the paraffin was removed with xylene and ethanol and the sections were stained with hematoxylin and eosin (HE). The sections were then dehydrated with alcohol and finally observed.
Western Blot Analysis
The thawed liver was homogenized in ice-cold lysis buffer with Teflon. Protein concentrations of immunoblotted AMPK, GLUT-4 and IR were determined with use of the BCA method. Specifically, 30–50 μg of total protein was first loaded with 10% SDS-polyacrylamide gel for electrophoresis and then transferred to a nitrocellulose membrane. The membrane was blocked with 5% skim milk powder in TBST for 1 h. Dilute primary antibodies were used at 1:1000–2000. The membrane was incubated with the primary antibody for 16 h at 4°C. The membrane was then washed with PBS and 0.01% Tween-20, followed by color development using the BCIP/NBT alkaline phosphatase colorimetric kit, and semi-quantitative analysis of the relevant proteins using ImageJ software.
Protein Chip Assay
Thawed liver samples, as described above, were added to each well of the GSM-CAA-4000 chip (RayBiotech, Inc., Guangzhou) and incubated overnight. The samples were subjected to repeated cleaning with the Thermo Scientific Well wash Versa chip washer. Scanning signals were obtained with use of a laser scanner (InnoScan 300, Innopsys, Carbonne – France). Data analysis was performed using chip-specific data analysis software.
Statistical Analysis
The data were expressed as mean ± SEM with a p <0.05 being required for results to be considered statistically significant. Graph Pad Prism software was used for the statistical analysis and the differences were determined using Student’s t-tests.
Results
ATM Effects on Body Weight
In mice within the NC and DM groups, body weights increased to varying degrees (Figure 1A). In contrast, body weights of the ATM100 and ATM 200 groups began to decrease after the 8th day of intervention, although these changes failed to achieve statistical significance as compared with that of the DM group (P>0.05). After the 4-week period of the intervention, statistically significant differences in weight gain were obtained, with weight gain rates of mice treated with ATM (100 and 200 mg/kg) being significantly decreased as compared with that of the DM group (p<0.01; Figure 1B). No statistically significant differences in body weights were obtained between the ATM 100 and ATM 200 groups (p>0.05).
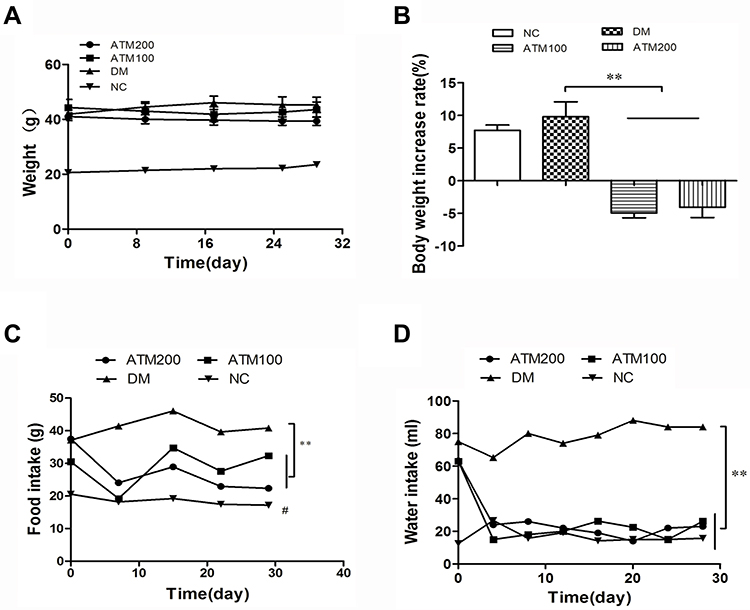 |
Figure 1 Effect of artemether (ATM) on general conditions in db/db mice as compared with responses in controls (NC). (A) Body weights, (B) rate of body weight increase as determined at the conclusion of the experiment, (C) food intake, (D) water intake. Data are expressed as mean ± SEM (n =6). #indicates NC (normal control) vs DM (diabetic model – db/db mice) group p<0.05; **indicates ATM (100 or 200 mg/kg in DM) vs DM group p<0.01. |
ATM Effects on Food and Water Intake
Food intake and water intake of the DM group were significantly increased as compared with that in the NC group (p<0.05; Figure 1C and D). Treatment with ATM 100 or ATM 200 significantly reduced food and water intake as compared with that observed in the DM group (p<0.01). These reductions were more apparent in the ATM 200 versus ATM 100 group from the data trends, but there were no significant statistical differences.
ATM Effects on Hyperglycemia and Glucose Intolerance
Fasting blood glucose levels in the DM group were significantly elevated as compared with that in the NC group (p < 0.05; Figure 2A). A significant inhibitory effect upon hyperglycemia in db/db mice was obtained at weeks 3 and 4 of ATM treatment (p < 0.05; Figure 2A). After 4 weeks of continuous treatment, ATM (100 and 200 mg/kg) significantly reduced fasting blood glucose levels in db/db mice as compared to that of the DM group (Figure 2B). To corroborate these results, IPGTT was used to assess the effects of ATM on glucose intolerance at the conclusion of the experimental period (Figure 2C). Results of these determinations revealed that areas under the curves (AUCs) of the DM group were significantly increased as compared with that of the NC group (P < 0.05). As compared with that of the DM group, blood glucose levels at each time point sampled were found to be significantly decreased in the two ATM groups, as indicated by analysis of the AUCs (p<0.05; Figure 2D). These findings provide an explanation for the improvements in glucose tolerance resulting from ATM treatment.
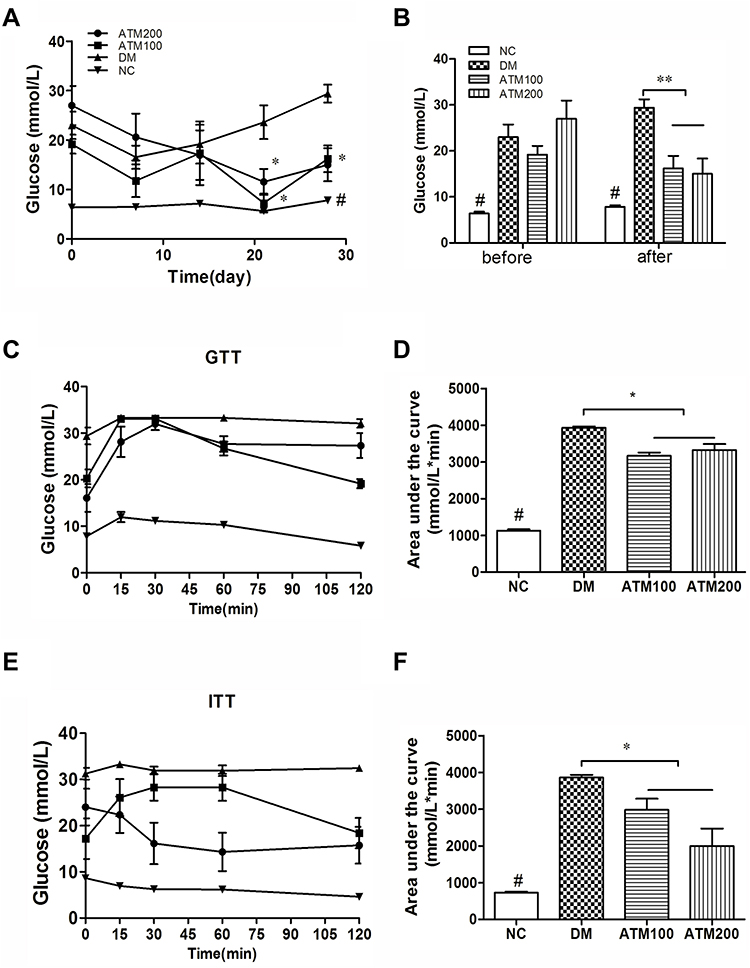 |
Figure 2 Effects of ATM on glucose and glucose tolerance in db/db mice as compared with responses in controls (NC). (A) Fasting blood glucose, (B) blood glucose changes as determined at the begin and conclusion of the experiment, (C) IPGTT, (D) areas under the curve from the glucose tolerance test shown in C, (E) IPITT, (F) areas under the curve from the glucose tolerance test shown in E. IPGTT, intraperitoneal glucose tolerance test; IPITT, intraperitoneal insulin tolerance test; data are expressed as mean ± SEM (n =6). # indicatesNC vs DM group p<0.05; *indicates ATM (at 100 or 200 mg/kg in DM) vs DM group p<0.05; **indicates ATM (at 100 or 200 mg/kg in DM) vs DM group p<0.01. |
ATM Effects on Insulin Intolerance
Results from the analysis of IPITT AUCs revealed that ATM intervention significantly decreased blood glucose levels at each time point sampled as compared with the DM group (p<0.05; Figure 2E). Although the differences failed to achieve statistical significance, blood glucose levels of the ATM 200 group were consistently lower than that obtained in the ATM100 group at each time point sampled (Figure 2F). These results demonstrate that ATM improved insulin sensitivity and ameliorated insulin resistance in db/db mice.
ATM Effects on Serum Lipid Profiles
A summary of serum TC, TG and FFA levels in mice is presented in Figure 3. Blood lipid levels in the DM group were significantly greater than those in the NC group (p < 0.05). Serum TC, TG and FFA levels in the DM group were significantly increased as compared with those in the ATM 200 group (p < 0.05). Within the ATM 100 group, there was also a tendency for reduced serum levels of TC and TG, but these differences failed to achieve statistical significance. In this way, blood lipid levels were shown to be decreased in response to ATM treatment, an effect that shows a dose-dependent trend.
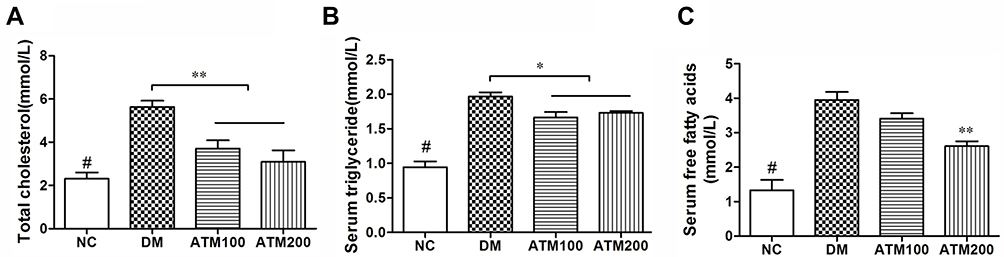 |
Figure 3 Effects of ATM on lipid levels in db/db mice as compared with responses in controls (NC). (A) Total cholesterol (TC). (B) Serum triglyceride (TC). (C) Serum-free fatty acid (FFA). Data are expressed as mean ± SEM (n =6). #indicates NC vs DM group p<0.05; *indicates ATM (at 100 or 200 mg/kg in DM) vs DM group p<0.05; **indicates ATM (at100 or 200 mg/kg in DM) vs DM group p<0.01. |
ATM Effects on Liver Morphology
As shown in Figure 4, liver weights in the DM group were significantly increased as compared with those in the NC group (p < 0.01) and red and white stripes were present on the cut surface (Figure 4A). Although there were no statistically significant differences in liver weights between the ATM and DM groups (p> 0.05; Figure 4B), the overall size of the liver and lipid infiltration was decreased, and the appearance of the liver consisted of a more rosy color in the ATM groups. Further analysis revealed that less fat content was present in livers with decreased weights in the ATM groups. We analyzed that there was no significant difference in liver weight, it may be that the weight of fat is lighter and the proportion of liver is lower, and the shorter ATM intervention time may also lead to this result. Results obtained from HE staining of the NC liver showed a normal distribution of hepatocytes, clear structures of liver lobules and no lipid deposition (Figure 4C). In the DM group, the arrangement of hepatocytes was disordered, hepatic lobule structure was ambiguous and large fragments of lipid droplets were present. However, in mice treated with ATM, liver fat vacuoles gradually decreased and the number of hepatocytes increased, suggesting that ATM improved liver lesions and reduced fat deposition.
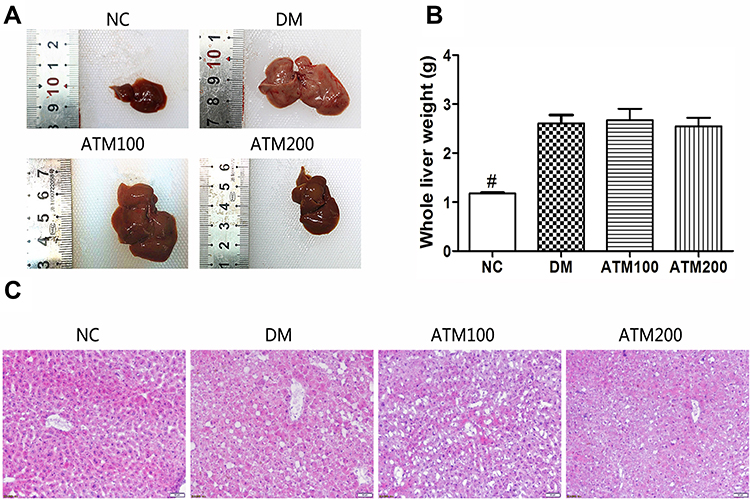 |
Figure 4 Effects of ATM on liver morphology in db/db mice as compared with responses in controls (NC). (A) Overall view of the liver. (B) Whole liver weights. (C) HE staining of the liver. Data are expressed as mean ± SEM (n =6). #indicates NC vs DM group p<0.05. Scale bar, 50 μm. (n = 6). Original magnification 200 ×. |
ATM Effects on Islet Morphology
The appearance of islet morphology in the NC group was regular with clear boundaries, the cells showed a normal distribution and no vacuolar degeneration was present (Figure 5A). In the DM group, there was a loss of islet boundary definition and vacuolar degeneration was obvious. Following treatment with ATM (100 mg/kg and 200 mg/kg), these diabetes-induced histopathological alterations were clearly improved. Specifically, the area (Figure 5B) and number (Figure 5C) of islet cells were increased.
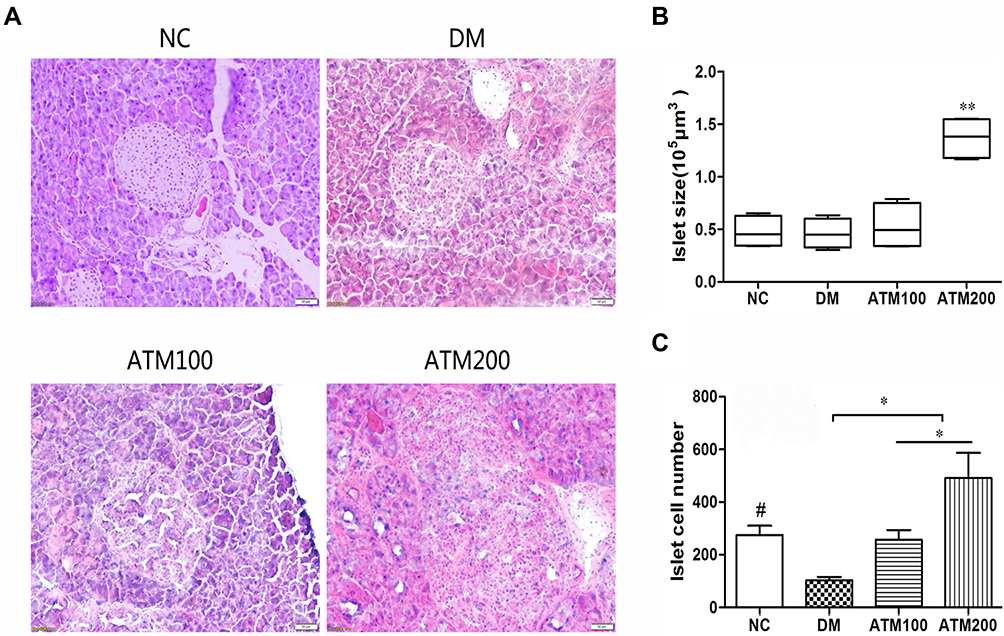 |
Figure 5 Effect of ATM on Islet morphology in db/db mice as compared with responses in controls (NC). (A) HE staining of the Islet. (n = 6). Original magnification 200 ×. (B) Quantification of islet size in sections from mice pancreas. Boxes and whiskers are shown, 10–90% confidence intervals. (C) Number of islet cells. #Means NC vs DM group p<0.05; *indicatesATM (at 100 or 200 mg/kg in DM) vs DM group p<0.05; **indicates ATM (at100 or 200 mg/kg in DM) vs DM group p<0.01. |
ATM Effects on AMPK, GLUT-4 and IR β
As shown in Figure 6, the expression levels of AMPK, GLUT-4 and IR β protein in the DM group were significantly decreased as compared with those in the NC group (p < 0.01), and expression levels of AMPK, GLUT-4 and IRβ protein in the liver of both ATM groups were significantly increased as compared with that observed in the DM group.
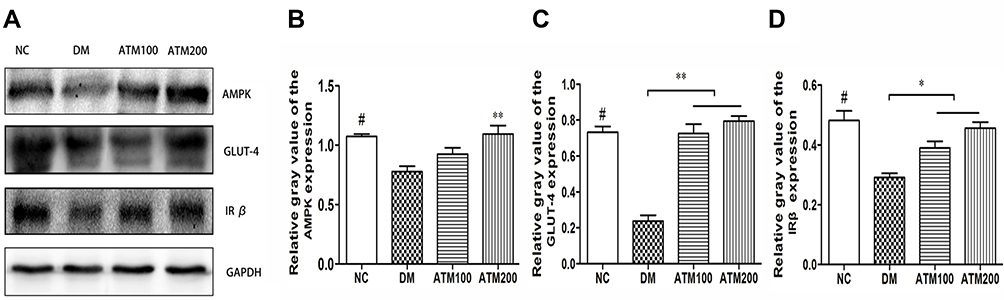 |
Figure 6 Effects of ATM on AMPK, GLUT-4, and IRβ protein expression within the liver of db/db mice as compared with responses in controls (NC). (A) Equal amounts of proteins were resolved on 10% SDS-PAGE and blotted with respective AMPK, GLUT-4, and IRβ antibodies. (B–D) Densitometric measurements of protein bands in A. Data are expressed as mean ± SEM (n = 6). Means NC vs DM group p<0.05; *indicates ATM (at 100 or 200 mg/kg in DM) vs DM group p<0.05; **indicates ATM (at100 or 200 mg/kg in DM) vs DM group p<0.01. |
Protein Chip Detection of ATM on Liver Protein Expression in db/db Mice
In response to ATM, expressions of the macrophage-derived chemokine (MDC), macrophage inflammatory protein 2 (MIP-2), macrophage inflammatory protein-1g (MIP-1g) as well as Interleukin-2 (IL-2) and Interleukin-6 (IL-6) within the liver were all decreased, while that of CD27L and CD30 were increased (Table 1). Biological processes, cell composition and molecular function of Gene Ontology (GO), and the KEGG (Kyoto Encyclopedia of Genes and Genomes) pathways were also analyzed in these samples (Figure 7). We found that ATM significantly improved the immune microenvironment, down-regulated the expression of inflammatory factors and activated cytokine-mediated signaling through cytokine–cytokine receptor interactions. These effects may involve extracellular effects of ATM.
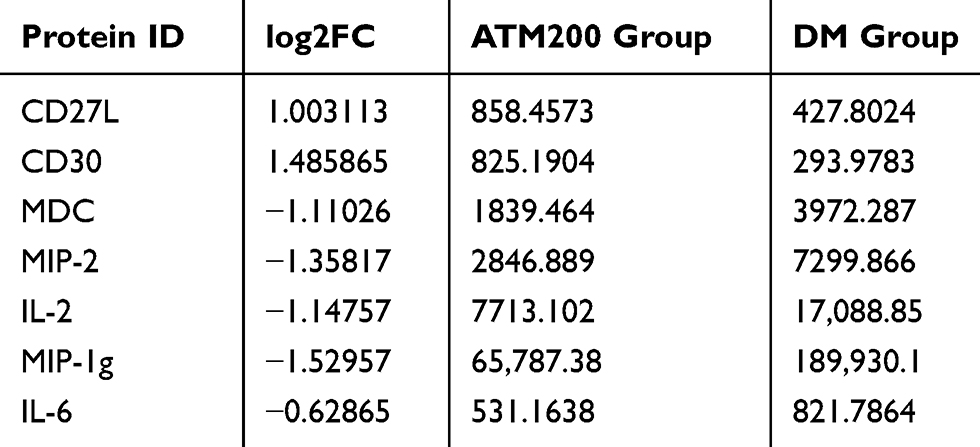 |
Table 1 Effect of Artemether (ATM) on the Expression of Protein Factors Within the Liver of db/db Mice |
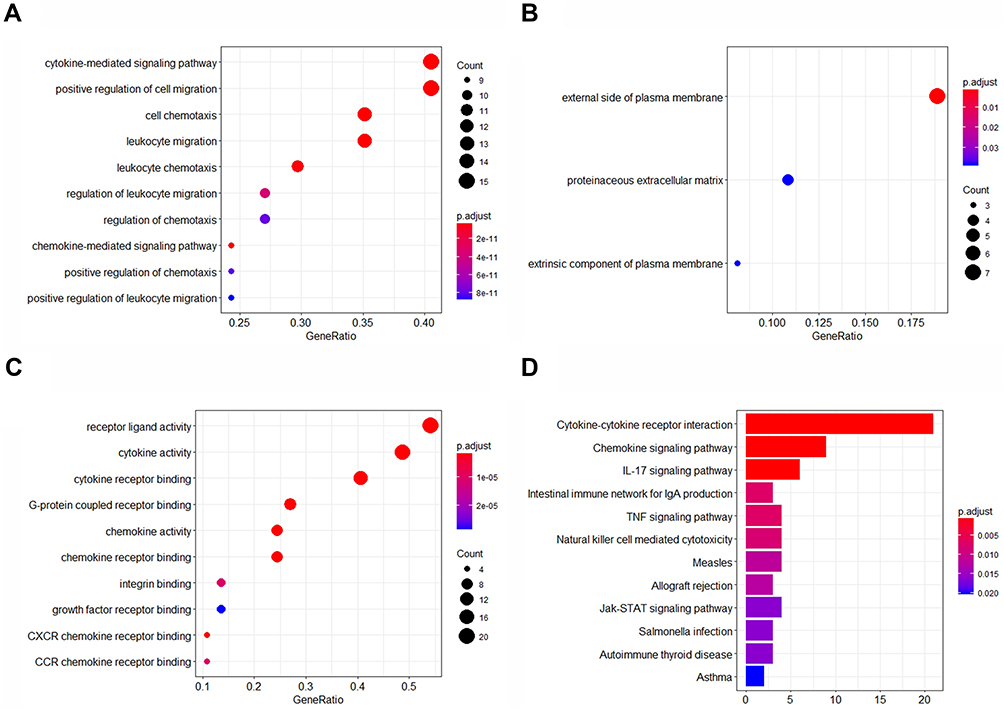 |
Figure 7 Gene Ontology enrichment map. (A) Biological processes. (B) Cell composition. (C) Molecular function. (D) KEGG (Kyoto Encyclopedia of Genes and Genomes) pathway. |
Discussion
In recent years, the role of ATM in the treatment of biomedical disorders has been expanding. Initially used for treating malaria, now the capacity for anti-tumor and anti-viral effects is being considered and explored.21,22 However, much remains to be understood regarding the efficacy of ATM and its derivatives in metabolic syndromes.
With the findings that ATM can act on the ARX receptor of islet alpha cells to transform these into islet β-like cells and promote insulin, an important potential for the treatment of type 1 diabetes was realized.16 Within our laboratory, we established a classic type 2 diabetes db/db mouse model, characterized by insulin resistance, obesity, and diabetic nephropathy.20 With this model we demonstrated that a 2-week administration of 200 mg/kg of ATM ether reduced weight gain and fasting blood glucose levels and improved insulin resistance.
In our current experiment, we expand upon these findings by increasing the sample size, extending the intervention time period to 4 weeks, and compared two different doses of ATM. Our current findings showing that body weights and food intake of these db/db mice were significantly decreased and were dose-related to ATM treatment are consistent with the conclusion that ATM can convert fat to reduce body weight and improve high-fat symptoms.15 However, there are also some studies showing that ATM and its analogs can form fat.23–25 Results obtained from our IPGTT and IPITT analyses demonstrated that ATM dose-dependently improved mouse islet cells, their function and insulin resistance. Moreover, mouse hepatic steatosis and islet vacuolar degeneration gradually improved over the course of the experimental period in an ATM dose-related manner in subsequent experiments we examined some of the mechanisms through which ATM improved glucose and lipid metabolism in these mice. We found that ATM can affect the AMPK pathway, thereby increasing expressions of GLUT-4 and IR β proteins, as well as producing increased glucose transport and islet β-cells. When AMPK is activated, several biosynthetic pathways can be down-regulated notably, of relevance to the present report, gluconeogenesis and fatty acid synthesis in the liver. Similarly, for several catabolic pathways of ATP, there are examples of an up-regulation of glucose uptake (GLUT-4) and production of glycolysis.26,27 It has been reported that artemisinin derivatives can improve non-alcoholic fatty liver disease by up-regulating the AMPK pathway,28 results which are similar to our current findings. Low-grade inflammation is a key component of T2DM which can then lead to insulin resistance,29 and inflammatory macrophages may reduce insulin sensitivity in the liver, skeletal muscle and pancreatic β-cells. Liver inflammation can be accelerated by MIP-2-recruitment and activation of neutrophils in various inflammatory mediators.30 Such findings have led to the suggestion that inhibition of inflammatory responses may provide a means to treat T2DM.31 Of particular relevance to these findings, our current results from liver protein chip analysis reveal that ATM can down-regulate the expressions of macrophage-derived chemokines (MDC), macrophage inflammatory proteins (MIP)-2 and macrophage inflammatory proteins (MIP)-1g in the liver. At the same time, microarray results showed that the expression of inflammatory factors IL-2 and IL-6 in the liver of mice treated with ATM decreased, which enhanced T cell immunity and up-regulated the expression of CD27L and CD30. In this way, the capacity for ATM to act on the immune microenvironment through up-regulating cellular immunity and thus reduces the expression of inflammatory factors, not only diminishes liver inflammatory damage, but also improves insulin resistance by exerting effects upon systemic metabolic inflammation.
In this experiment, we also found that ATM significantly decreased polydipsia and polyuria in db/db mice. While this effect was more evident in the ATM 200 group, there were no statistically significant differences between the ATM 100 and ATM 200 groups. These effects of ATM on polydipsia and polyuria may be due to actions exerted upon the kidneys. In support of this possibility are results from studies showing that artemisinin and its analogs can alleviate inflammatory responses of diabetic nephropathy, reduce urinary albumin and diminish the development of diabetic nephropathy.32,33 We next designed an experiment to examine the effect of ATM on diabetic nephropathy and found that ATM significantly reduced urinary albumin in mice, which is consistent with previous studies. The basis for ATM to significantly reduce the amount of urine remains unknown and will require further research.
At present, the effects of ATM on metabolic syndromes have been investigated under conditions of a relatively low dose and brief period of treatment (1 time/week). However, changes in these conditions may exert differential effects of ATM. For example, a long-term and low-dose exposure of ATM may induce free radical scavengers, resulting in reduced therapeutic efficiency.34 In this experiment, we used a daily fixed dose to maintain stable blood concentrations of ATM in mice. In an initial pilot experiment, we tested the effects of ATM at 500, 400, 200, 100 and 50 mg/kg doses to examine the effects of these different concentrations and occurrence of adverse reactions in the mice. We found that high-dose artemether had different degrees of digestive inhibition in mice, and the 200 mg/kg and lower ATM intervention dose was safe for mice. Further work will be required to identify the optimal intervention protocol for a safe and effective treatment of ATM.
In summary, in this study, we demonstrate a number of beneficial effects of ATM in a db/db mouse model of diabetes. We found that ATM significantly reduced body weights of db/db mice, improved their high-fat state and insulin resistance within the liver and up-regulated the expressions of GLUT-4 and IR β protein, likely through the AMPK pathway. Through these effects on liver cell immunity, ATM reduces the expression of inflammatory factors and diminishes inflammatory lesions within the liver. Accordingly, ATM may represent a new approach for the treatment of type 2 diabetes mellitus, which is mainly the result of a metabolic syndrome. However, the exact treatment protocol for ATM administration will require further work as high doses can result in adverse reactions while low doses induce free radicals. Subsequent work within our laboratory will be directed toward evaluating the efficacy of different ATM formulations for metabolic syndromes, the occurrence of adverse reactions and identification of ATM mechanisms involved with regulation of glycolipid metabolism. Results from these experiments will enable us to initiate a small clinical trial to evaluate the efficacy of ATM in type 2 diabetes patients (Registration No. ChiCTR-IPR-17010789).
Animal Statement
Procedures involving animals and their care were conducted in conformity with NIH guidelines (NIH Pub. No. 85–23, revised 1996) and were approved by Animal Care and Use Committee of the Henan University of Science and Technology.
Highlights
The capacity for artemether to lower blood sugars and decrease obesity as observed in db/db mice, in part, involves mechanisms that regulate the immune microenvironment by improving glycolipid metabolism. The results of this study provide important new information that can serve as the foundation for future research into the use of artemisinin as a means to improve glycolipid metabolism.
Acknowledgment
This work was supported by the National Natural Science Foundation of China (U1404805, 81141059).
Thanks to Professor Shipeng LI for his help in the writing and grammar guidance of this paper.
Disclosure
The authors declare that they have no conflicts of interest.
References
1. Nolan CJ, Ruderman NB, Kahn SE, et al. Insulin resistance as a physiological defense against metabolic stress: implications for the management of subsets of type 2 diabetes. Diabetes. 2015;64(3):673–686. doi:10.2337/db14-0694
2. Cotrozzi G, Casini RV, Relli P, et al. Role of the liver in the regulation of glucose metabolism in diabetes and chronic liver disease. Ann Ital Med Int 1997;12(2):84–91.
3. Tahrani AA, Barnett AH, Bailey CJ. Pharmacology and therapeutic implications of current drugs for type 2 diabetes mellitus. Nat Rev Endocrinol. 2016;12(10):566–592.
4. Prabhakar PK, Doble M. A target based therapeutic approach towards diabetes mellitus using medicinal plants. Curr Diabetes Rev. 2008;4(4):291–308. doi:10.2174/157339908786241124
5. Majori G. Combined antimalarial therapy using artemisinin. Parassitologia. 2004;46(1–2):85–87.
6. Efferth T. Cancer combination therapies with artemisinin-type drugs. Biochem Pharmacol. 2017;139:56–70. doi:10.1016/j.bcp.2017.03.019
7. An J, Minie M, Sasaki T, et al. Antimalarial drugs as immune modulators: new mechanisms for old drugs. Annu Rev Med. 2017;68(1):317–330. doi:10.1146/annurev-med-043015-123453
8. Lam NS, Long X, Su XZ, et al. Artemisinin and its derivatives in treating helminthic infections beyond schistosomiasis. Pharmacol Res. 2018;71(7):35–38.
9. Wang KS, Li J, Wang Z, et al. Artemisinin inhibits inflammatory response via regulating NF-κB and MAPK signaling pathways. J Immunopharmacol. 2017;39(1):28–36. doi:10.1080/08923973.2016.1267744
10. Shi C, Li H, Yang Y, et al. Anti-inflammatory and immunoregulatory functions of artemisinin and its derivatives. Mediators Inflamm. 2015;1–7.
11. Klayman DL. Qinghaosu (artemisinin): an antimalarial drug from China. Science. 1985;228(4703):1049–1055. doi:10.1126/science.3887571
12. Ahmad W, Khan I, Khan MA, et al. Evaluation of antidiabetic and antihyperlipidemic activity of artemisia indica linn (aeriel parts) in streptozotocin induced diabetic rats. J Ethnopharmacol. 2014;151(1):618–623. doi:10.1016/j.jep.2013.11.012
13. Ghazanfar K, Ganai BA, Akbar S, et al. Antidiabetic activity of artemisia amygdalina decne in streptozotocin induced diabetic rats. Biomed Res Int. 2015. doi:10.1155/2014/185676
14. Eun KK, Keon-Hee K, Won HR, et al. Artemisia annuaLeaf extract attenuates hepatic steatosis and inflammation in high-fat diet-fed mice. J Med Food. 2016;19(3):290–299. doi:10.1089/jmf.2015.3527
15. Lu P, Zhang FC, Qian SW, et al. Artemisinin derivatives prevent obesity by inducing browning of WAT and enhancing BAT function. Cell Res. 2016;26(10):1169–1172. doi:10.1038/cr.2016.108
16. Li J, Casteels T, Frogne T, et al. Artemisinins target GABA A receptor signaling and impair α cell identity. Cell. 2017;168(1/2):86–100. doi:10.1016/j.cell.2016.11.010
17. AL-Waili NS. Treatment of diabetes mellitus by artemisia herba-alba extract: preliminary study. Clin Exp Pharmacol Physiol. 1986;13(7):569–573. doi:10.1111/j.1440-1681.1986.tb00940.x
18. Chen D, Wang MW. Development and application of rodent models for type 2 diabetes. Diabetes Obes Metab. 2005;7(4):307–317. doi:10.1111/j.1463-1326.2004.00392.x
19. Tamrakar AK, Singh AB, Srivastava AK. db/+ mice as an alternate model in antidiabetic drug discovery research. Arch Med Res. 2009;40(2):73–78. doi:10.1016/j.arcmed.2008.12.001
20. Guo Y, Fu W, Xin Y, et al. Anti-diabetic and anti-obesity effects of artemether in db/db mice. Biomed Res Int. 2018;2018:1–9.
21. Efferth T. From ancient herb to versatile, modern drug: artemisia annua and artemisinin for cancer therapy. Semin Cancer Biol. 2017;46:65–83. doi:10.1016/j.semcancer.2017.02.009
22. Efferth T. Beyond malaria: the inhibition of viruses by artemisinin-type compounds. Biotechnol Adv. 2018;36(6):1730–1737. doi:10.1016/j.biotechadv.2018.01.001
23. Jang B-C. Artesunate inhibits adipogeneis in 3T3-L1 preadipocytes by reducing the expression and/or phosphorylation levels of C/EBP-α, PPAR-γ, FAS, perilipin A, and STAT-3. Biochem Biophys Res Commun. 2016;474(1):220–225. doi:10.1016/j.bbrc.2016.04.109
24. Kyung BH, Hyeji S, Hyunmook L, et al. Anti-adipogenic effect of artemisia annua in diet-induced-obesity mice model. J Vet Sci. 2015;16(4):389–396. doi:10.4142/jvs.2015.16.4.389
25. Lee J, Kim MH, Lee JH, et al. Artemisinic acid is a regulator of adipocyte differentiation and C/EBP δ expression. J Cell Biochem. 2012;113(7):2488–2499. doi:10.1002/jcb.24124
26. Hardie DG. Minireview: the AMP-activated protein kinase cascade: the key sensor of cellular energy status. Endocrinology. 2003;144(12):5179–5183. doi:10.1210/en.2003-0982
27. Hardie DG. The AMP-activated protein kinase pathway–new players upstream and downstream. J Cell Sci. 2004;117(23):5479–5487. doi:10.1242/jcs.01540
28. Wang ZQ, Zhang XH, Yu Y, et al. Artemisia scoparia extract attenuates non-alcoholic fatty liver disease in diet-induced obesity mice by enhancing hepatic insulin and AMPK signaling independently of FGF21 pathway. Metabolism. 2013;62(9):1239–1249. doi:10.1016/j.metabol.2013.03.004
29. Lackey DE, Olefsky JM. Regulation of metabolism by the innate immune system. Nat Rev Endocrinol. 2016;12(1):15–28. doi:10.1038/nrendo.2015.189
30. Qin CC, Liu YN, Hu Y, Yang Y, Chen Z. Macrophage inflammatory protein-2 as mediator of inflammation in acute liver injury. World J Gastroenterol. 2017;23(17):47–56.
31. Bai L, Gao J, Wei F, et al. Therapeutic potential of ginsenosides as an adjuvant treatment for diabetes. Front Pharmacol. 2018;1(9):423. doi:10.3389/fphar.2018.00423
32. Wu X, An P, Ye B, et al. Artemisinin ameliorated proteinuria in rats with adriamycin-induced nephropathy through regulating nephrin and podocin expressions. J Tradit Chin Med. 2014;34(1):63–68. doi:10.1016/S0254-6272(14)60056-X
33. Yuan DS, Chen YP, Tan LL, et al. Artemisinin: a panacea eligible for unrestrictive use? Front Pharmacol. 2017;17(8):737. doi:10.3389/fphar.2017.00737
34. Buffet PA, Safeukui I, Deplaine G, et al. The pathogenesis of plasmodium falciparum malaria in humans: insights from splenic physiology. Blood. 2011;117(2):381–392. doi:10.1182/blood-2010-04-202911
 © 2020 The Author(s). This work is published and licensed by Dove Medical Press Limited. The full terms of this license are available at https://www.dovepress.com/terms.php and incorporate the Creative Commons Attribution - Non Commercial (unported, v3.0) License.
By accessing the work you hereby accept the Terms. Non-commercial uses of the work are permitted without any further permission from Dove Medical Press Limited, provided the work is properly attributed. For permission for commercial use of this work, please see paragraphs 4.2 and 5 of our Terms.
© 2020 The Author(s). This work is published and licensed by Dove Medical Press Limited. The full terms of this license are available at https://www.dovepress.com/terms.php and incorporate the Creative Commons Attribution - Non Commercial (unported, v3.0) License.
By accessing the work you hereby accept the Terms. Non-commercial uses of the work are permitted without any further permission from Dove Medical Press Limited, provided the work is properly attributed. For permission for commercial use of this work, please see paragraphs 4.2 and 5 of our Terms.